

Consumer Insights
Uncover trends and behaviors shaping consumer choices today
Procurement Insights
Optimize your sourcing strategy with key market data
Industry Stats
Stay ahead with the latest trends and market analysis.
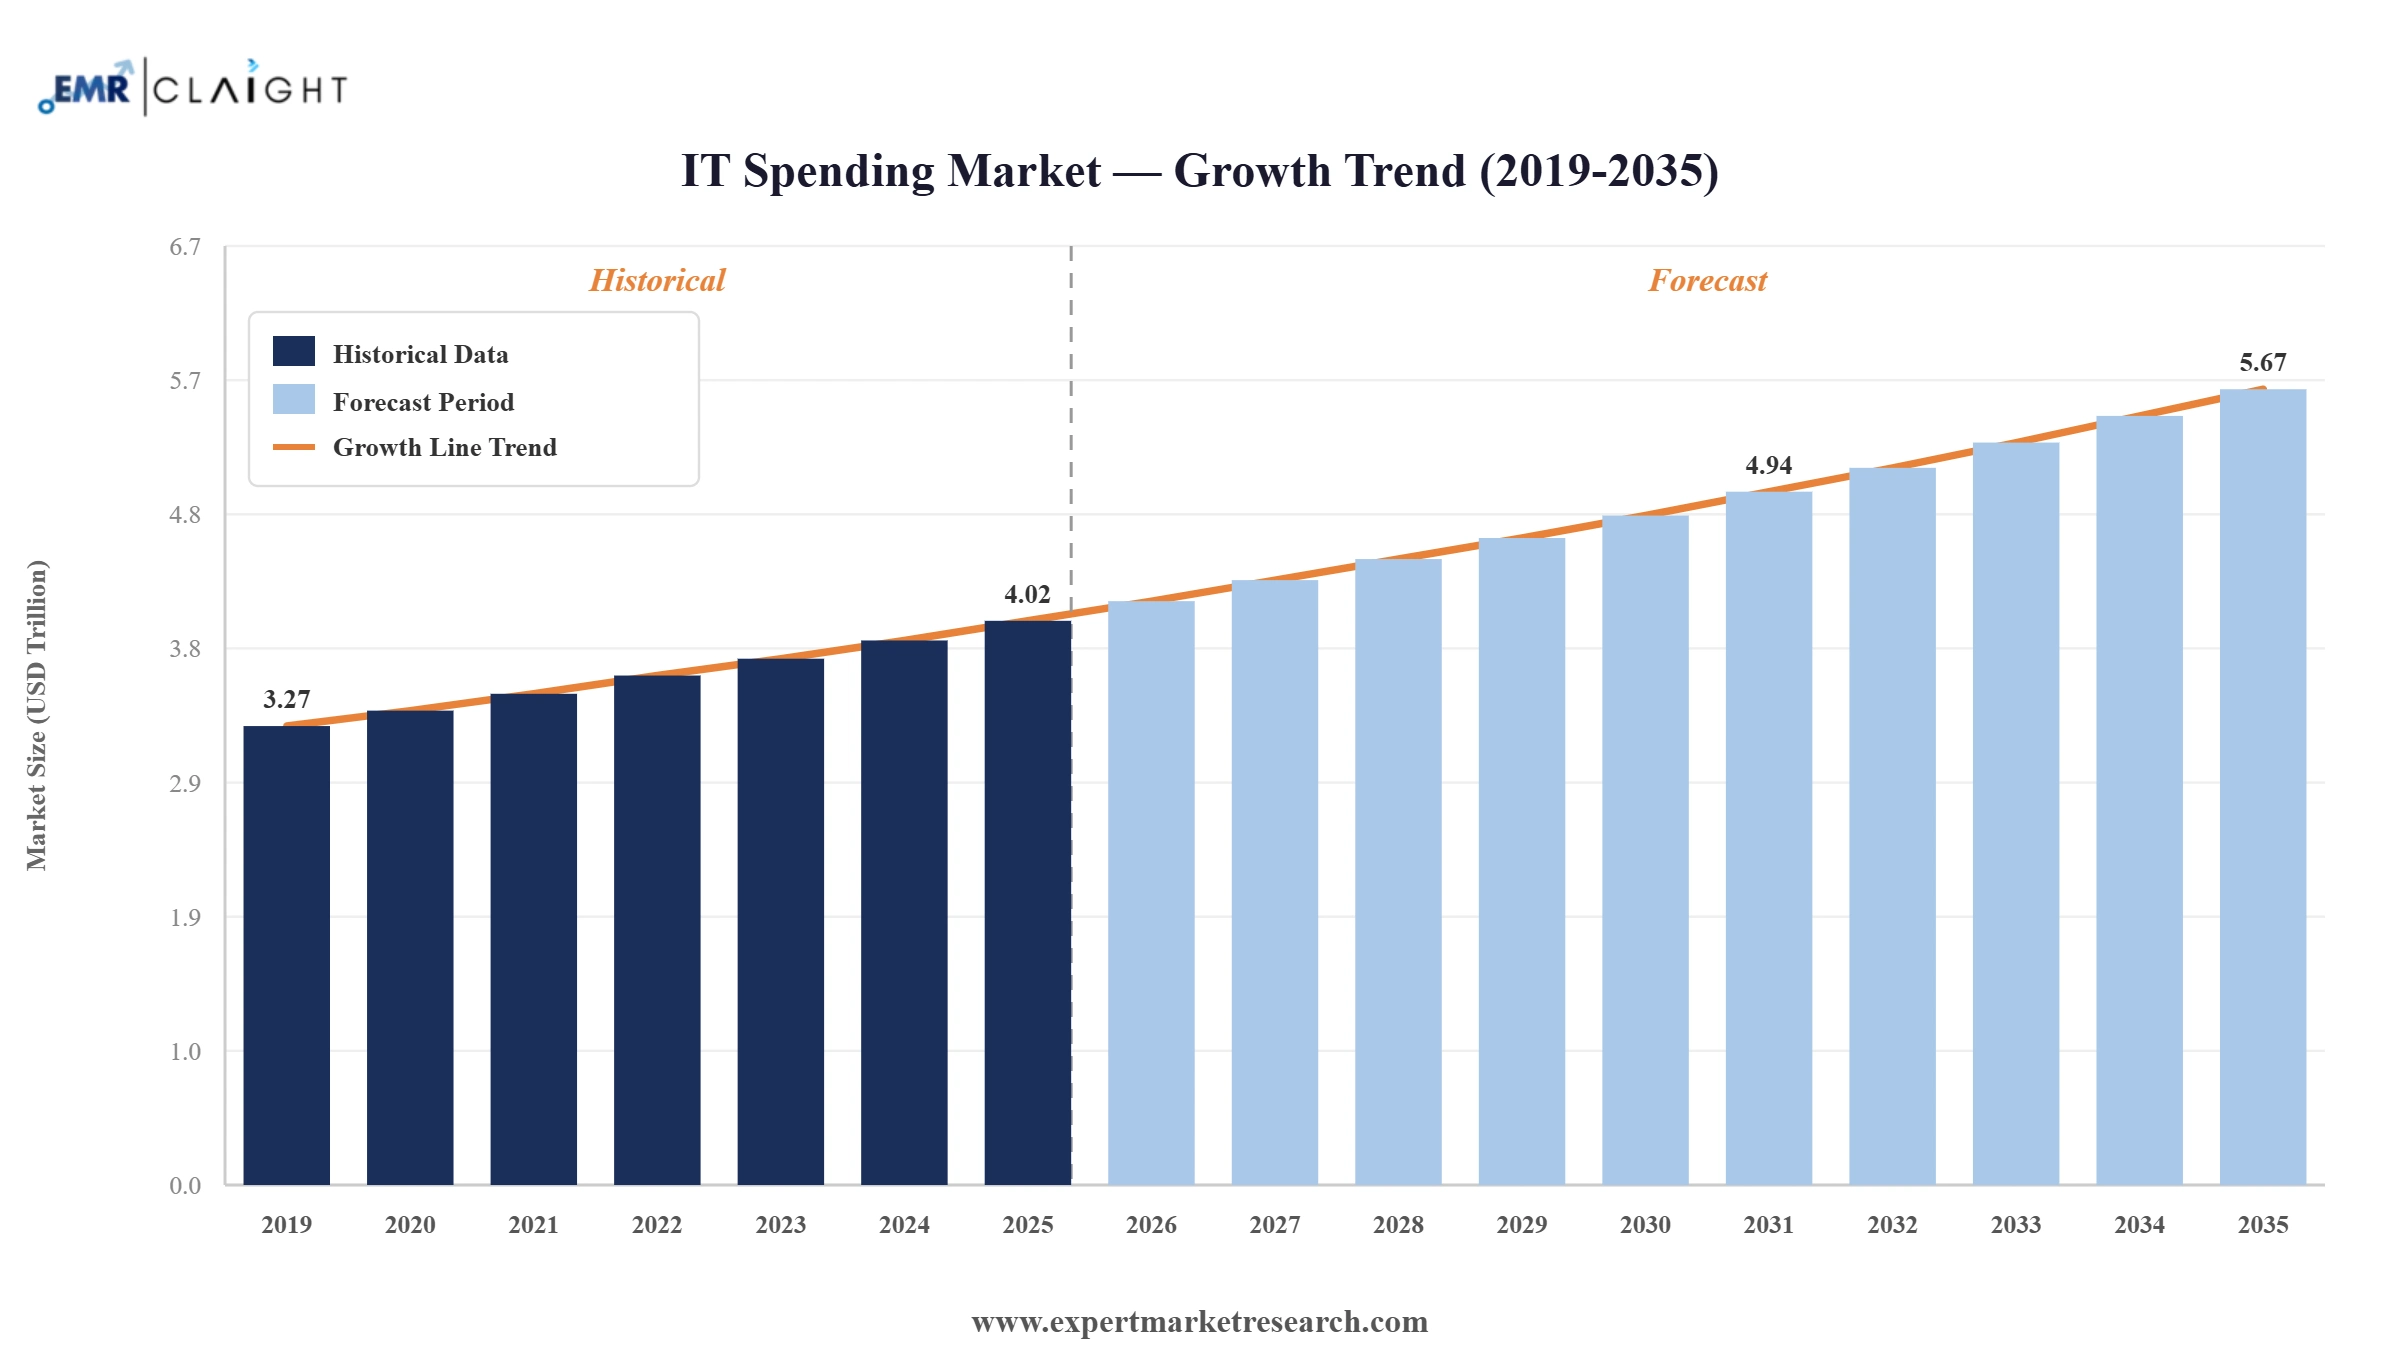
The Global IT Spending Market reached a value of USD 4.02 Trillion at 2025 and is projected to expand at a CAGR of around 3.50% during the forecast period of 2026-2035. With surging AI-infrastructure capex, generative-AI-driven software upgrades, the modernisation of data centres, and persistent cybersecurity priorities, the market is expected to reach USD 5.67 Trillion by 2035.
Read more about this report - REQUEST FREE SAMPLE COPY IN PDF
| Global IT Spending Market Report Summary | Description | Value |
| Base Year | USD Trillion | 2025 |
| Historical period | USD Trillion | 2019-2025 |
| Forecast Period | USD Trillion | 2026-2035 |
| Market Size 2025 | USD Trillion | 4.02 |
| Market Size 2035 | USD Trillion | 5.67 |
| CAGR 2019-2025 | Percent | XX% |
| CAGR 2026-2035 | Percent | 3.50% |
| CAGR 2026-2035 - Market by Region | Asia Pacific | 4.5% |
| CAGR 2026-2035 - Market by Country | India | 5.2% |
| CAGR 2026-2035 - Market by Country | China | 4.6% |
| CAGR 2026-2035 - Market by Type | Enterprise IT Services | 4.1% |
| Market Share by Country | Japan | 6.4% |
Four mutually reinforcing shifts are reshaping global IT spending: surging AI-infrastructure capex from hyperscalers, the embedding of generative and agentic AI into mainstream enterprise software, the prioritisation of cybersecurity in board-level budgets, and the steady migration of enterprise workloads to cloud-native, managed services that bundle compute, software and security as a service.
In April 2026, industry analysts raised their global IT spending forecast for 2026 to USD 6.31 Trillion, a 13.5% year-on-year jump driven almost entirely by AI infrastructure outlays. Data centre systems were guided to grow 55.8% to top USD 788 Billion, software to grow 15.1% to USD 1.44 Trillion, and IT services to surpass USD 1.87 Trillion as enterprises accelerate generative-AI implementation projects across finance, healthcare, manufacturing, and the public sector.
At Google Cloud Next in April 2026, Google introduced the Gemini Enterprise Agent Platform, a unified system replacing Vertex AI as Google's primary enterprise AI environment. The platform bundles agent building, deployment, data integration, security and lifecycle optimisation into a single offering, alongside the new Workspace Studio and an Agent2Agent (A2A) protocol. The launch signals a major reset in enterprise software spending, intensifying competition with OpenAI, Anthropic, Salesforce, and Microsoft for agentic-AI workloads.
In late 2025, financial filings and analyst notes confirmed that the Big Five hyperscalers-Amazon, Microsoft, Google, Meta and Oracle-planned more than USD 600 Billion of 2026 capital expenditure, a 36% jump on 2025, with roughly 75% earmarked for AI infrastructure. Amazon flagged USD 200 Billion, Alphabet USD 175-185 Billion, Meta USD 115-135 Billion, Microsoft USD 120 Billion+, and Oracle USD 50 Billion, materially lifting global data-centre and server spending baselines.
In late 2025, Salesforce completed its USD 8 Billion acquisition of Informatica ahead of its original early-2026 target, reinforcing its data-management foundation for Agentforce and the broader agentic-AI roadmap. The deal added enterprise-grade data integration, quality, governance and metadata-management capabilities to Salesforce's Data Cloud and Customer 360 stack, deepening competition with Microsoft, Oracle, IBM, and Snowflake for enterprise-AI data platforms in the IT services and software spending categories.
In May 2025, SAP expanded its strategic alliance with Microsoft to accelerate enterprise migration to SAP's Business Suite cloud bundles for finance, supply chain, HR, procurement and customer experience. The expanded partnership integrates SAP's Joule AI assistant with Microsoft 365 Copilot, Teams, Outlook, and Word, and creates a joint go-to-market for cloud-ERP migrations-an important lever in software and IT-services spending as on-premise ERP estates retire.
AI infrastructure has overtaken traditional cloud as the largest single driver of incremental IT spending. Industry analysts now forecast data-centre systems growth of 55.8% in 2026 and worldwide AI spending of USD 2.52 Trillion, a 44% jump year-on-year, including AI-specific GPUs, accelerator cards, AI-capable servers, AI cloud services and consulting. Hyperscalers alone will commit over USD 600 Billion of 2026 capex, with around 75% directly earmarked for AI infrastructure. The trend is significant because it is rerating capital intensity for both vendors and enterprise buyers, materially lifting the Global IT Spending Market growth trajectory.
Agentic AI is moving from pilots to embedded features across CRM, ERP, ITSM, productivity, and analytics platforms. Industry analysts expect 40% of enterprise applications to ship with task-specific AI agents by the end of 2026, up from less than 5% in 2025, while best-case scenarios suggest agentic AI could drive 30% of enterprise application software revenue by 2035. Salesforce's Agentforce and AELA pricing, Google's Gemini Enterprise Agent Platform, Microsoft's Copilot expansion and SAP's Joule integrations indicate that agent-native software is becoming the new baseline rather than an add-on, redirecting enterprise software budgets.
Cybersecurity is increasingly ringfenced inside CFO budgets even when broader IT spending tightens. Industry analysts forecast worldwide end-user information-security spending of USD 213 Billion in 2025 and USD 240 Billion in 2026, up 12.5%. Security software is forecast to climb from USD 95 Billion in 2024 to USD 121 Billion in 2026, with security services leading growth as enterprises outsource SOC, identity, and incident-response operations. The trend matters because cybersecurity is now woven into AI, cloud, and data-centre purchase decisions, creating a steady, multi-year pillar inside the IT services and software categories.
Cloud services have moved from optional to default for new enterprise workloads. Industry analysts expect worldwide cloud services spending of USD 877 Billion in 2026, with a fast-rising share targeting AI-optimised cloud infrastructure. The shift is reshaping the mix inside the Global IT Spending Market: enterprise IT services budgets are tilting toward managed-cloud, FinOps, and AI implementation services, while traditional on-premise hardware refreshes lose priority. Procurement teams now treat cloud-native, security-and-AI-bundled services as the default, accelerating the transition away from capex-heavy data-centre ownership for non-hyperscaler buyers.
The Expert Market Research’s report titled “IT Spending Market Report and Forecast 2026-2035” offers a detailed analysis of the market based on the following segments:
Breakup by Type
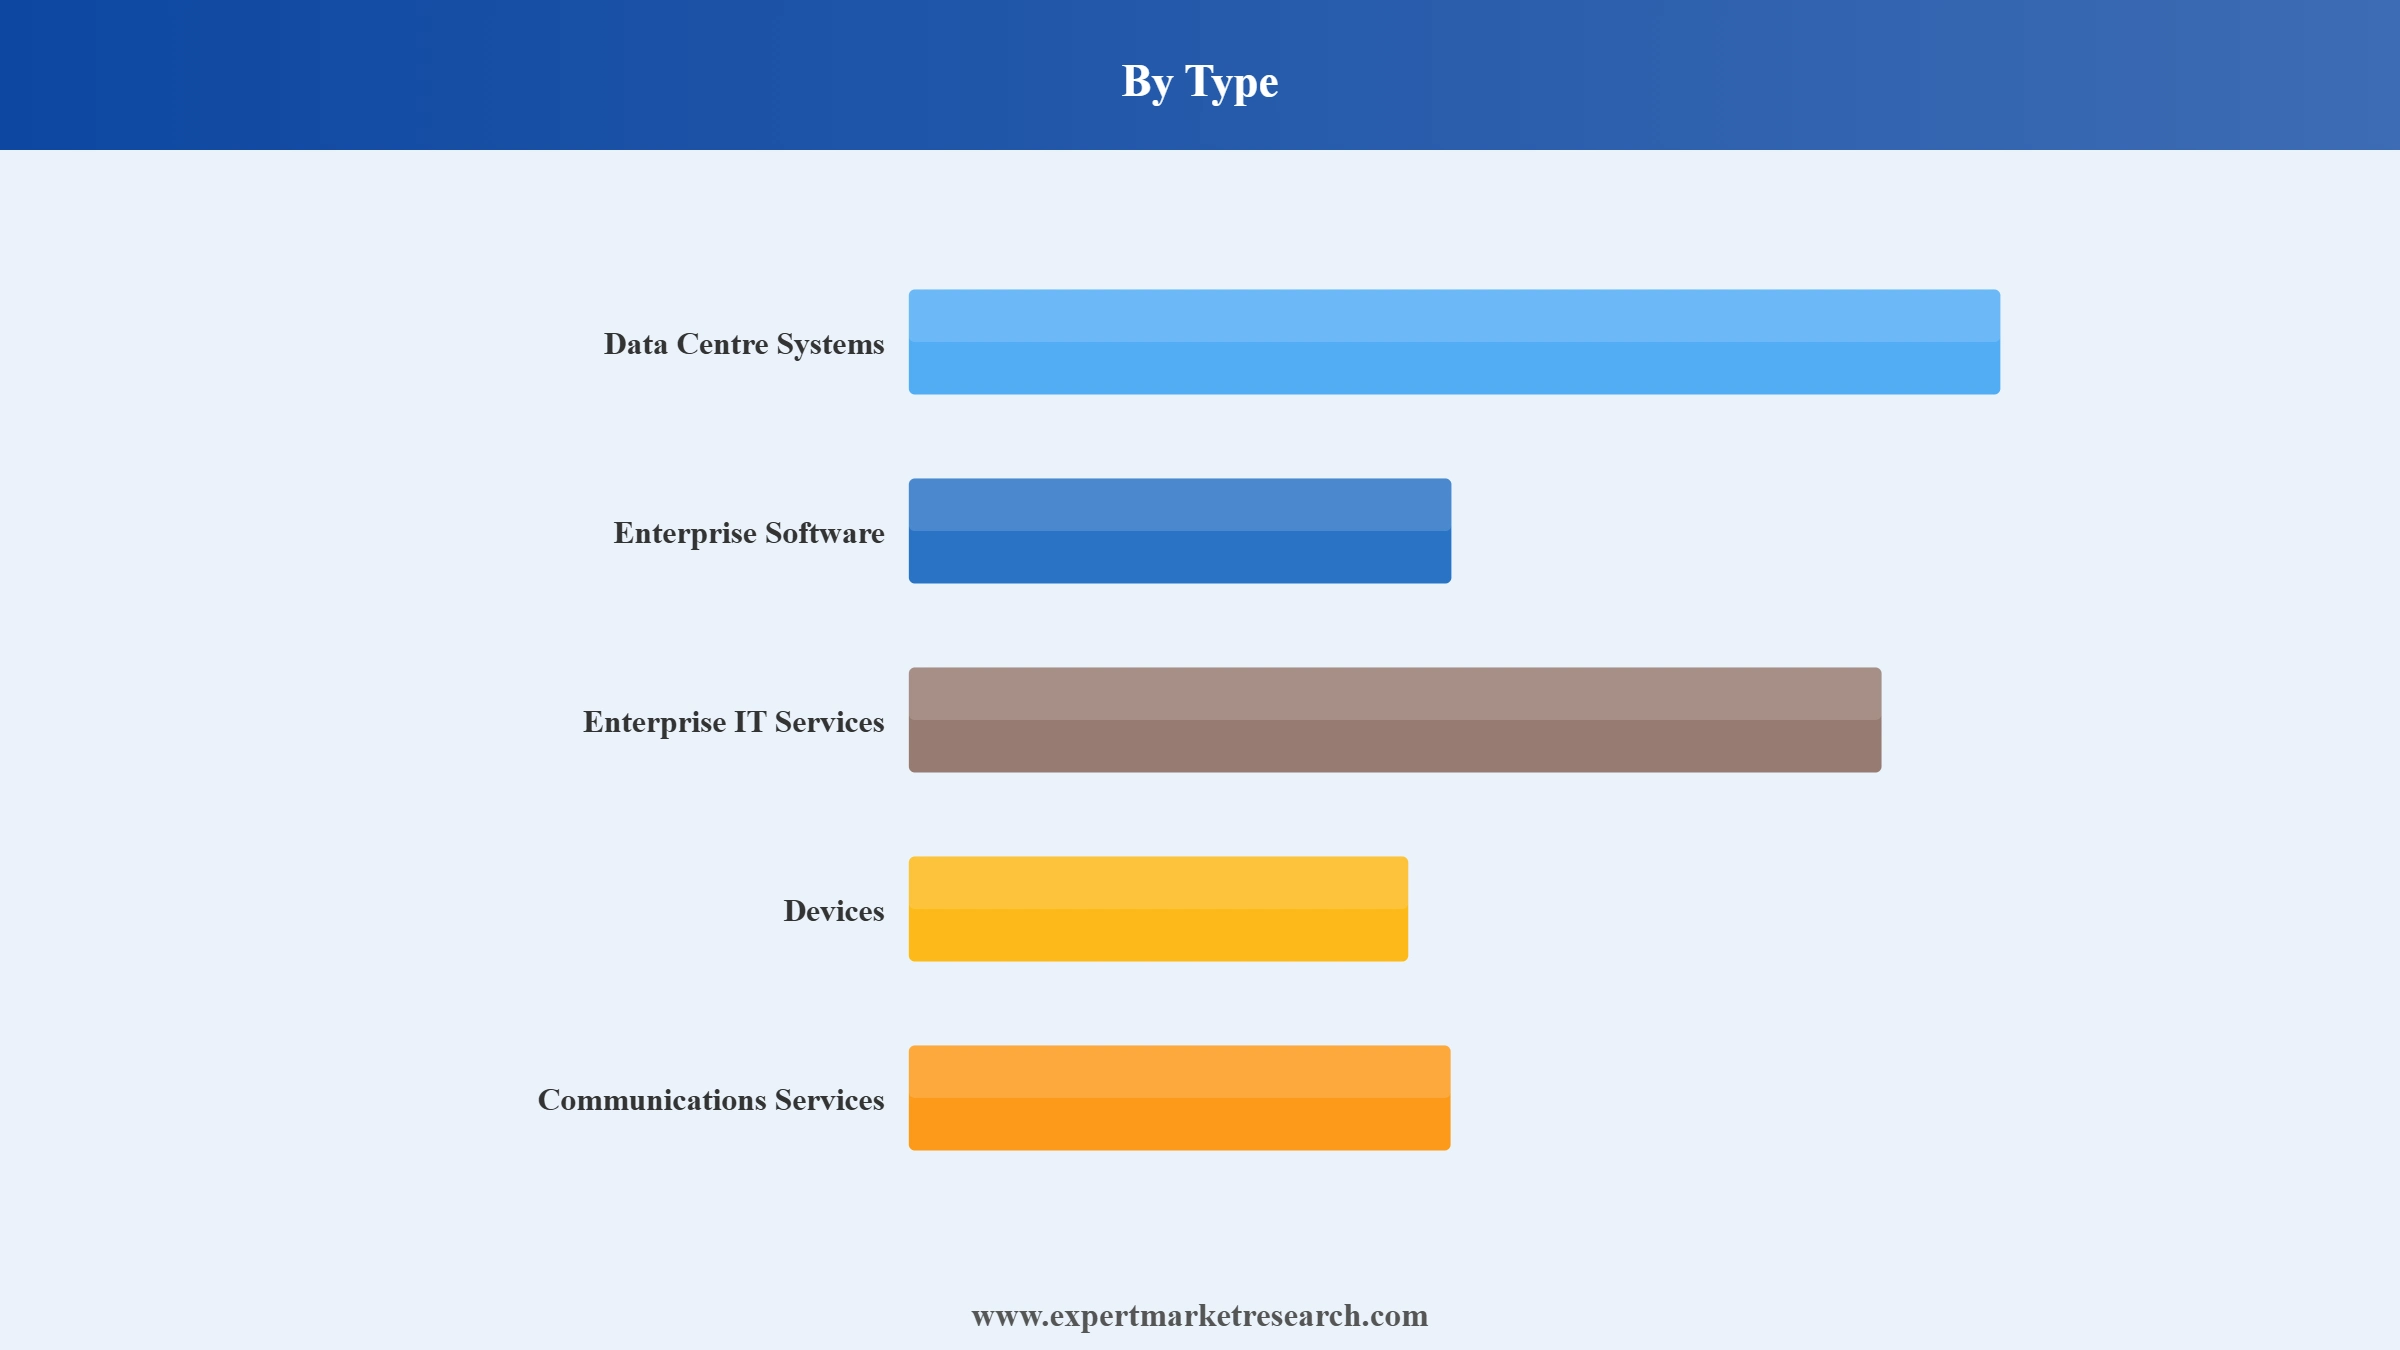
Key Insight: Communications Services and Enterprise IT Services together still account for the largest share of global IT spending, but Data Centre Systems is the fastest-growing type, lifted by AI-server and GPU capex; industry analysts expect data-centre spending to surpass USD 788 Billion in 2026 with 55.8% growth and projects a longer-term CAGR of around 7.4% for data-centre integrated systems through 2029. Enterprise Software is the second-fastest mover at roughly 15% growth in 2026, propelled by generative AI in CRM, ERP, BI, SCM and CMS suites from Microsoft, Salesforce, Oracle, SAP and IBM. Devices and Communications Services are mature, low-single-digit segments, with Communications Services held back by saturated telecoms ARPU.
Breakup by Region
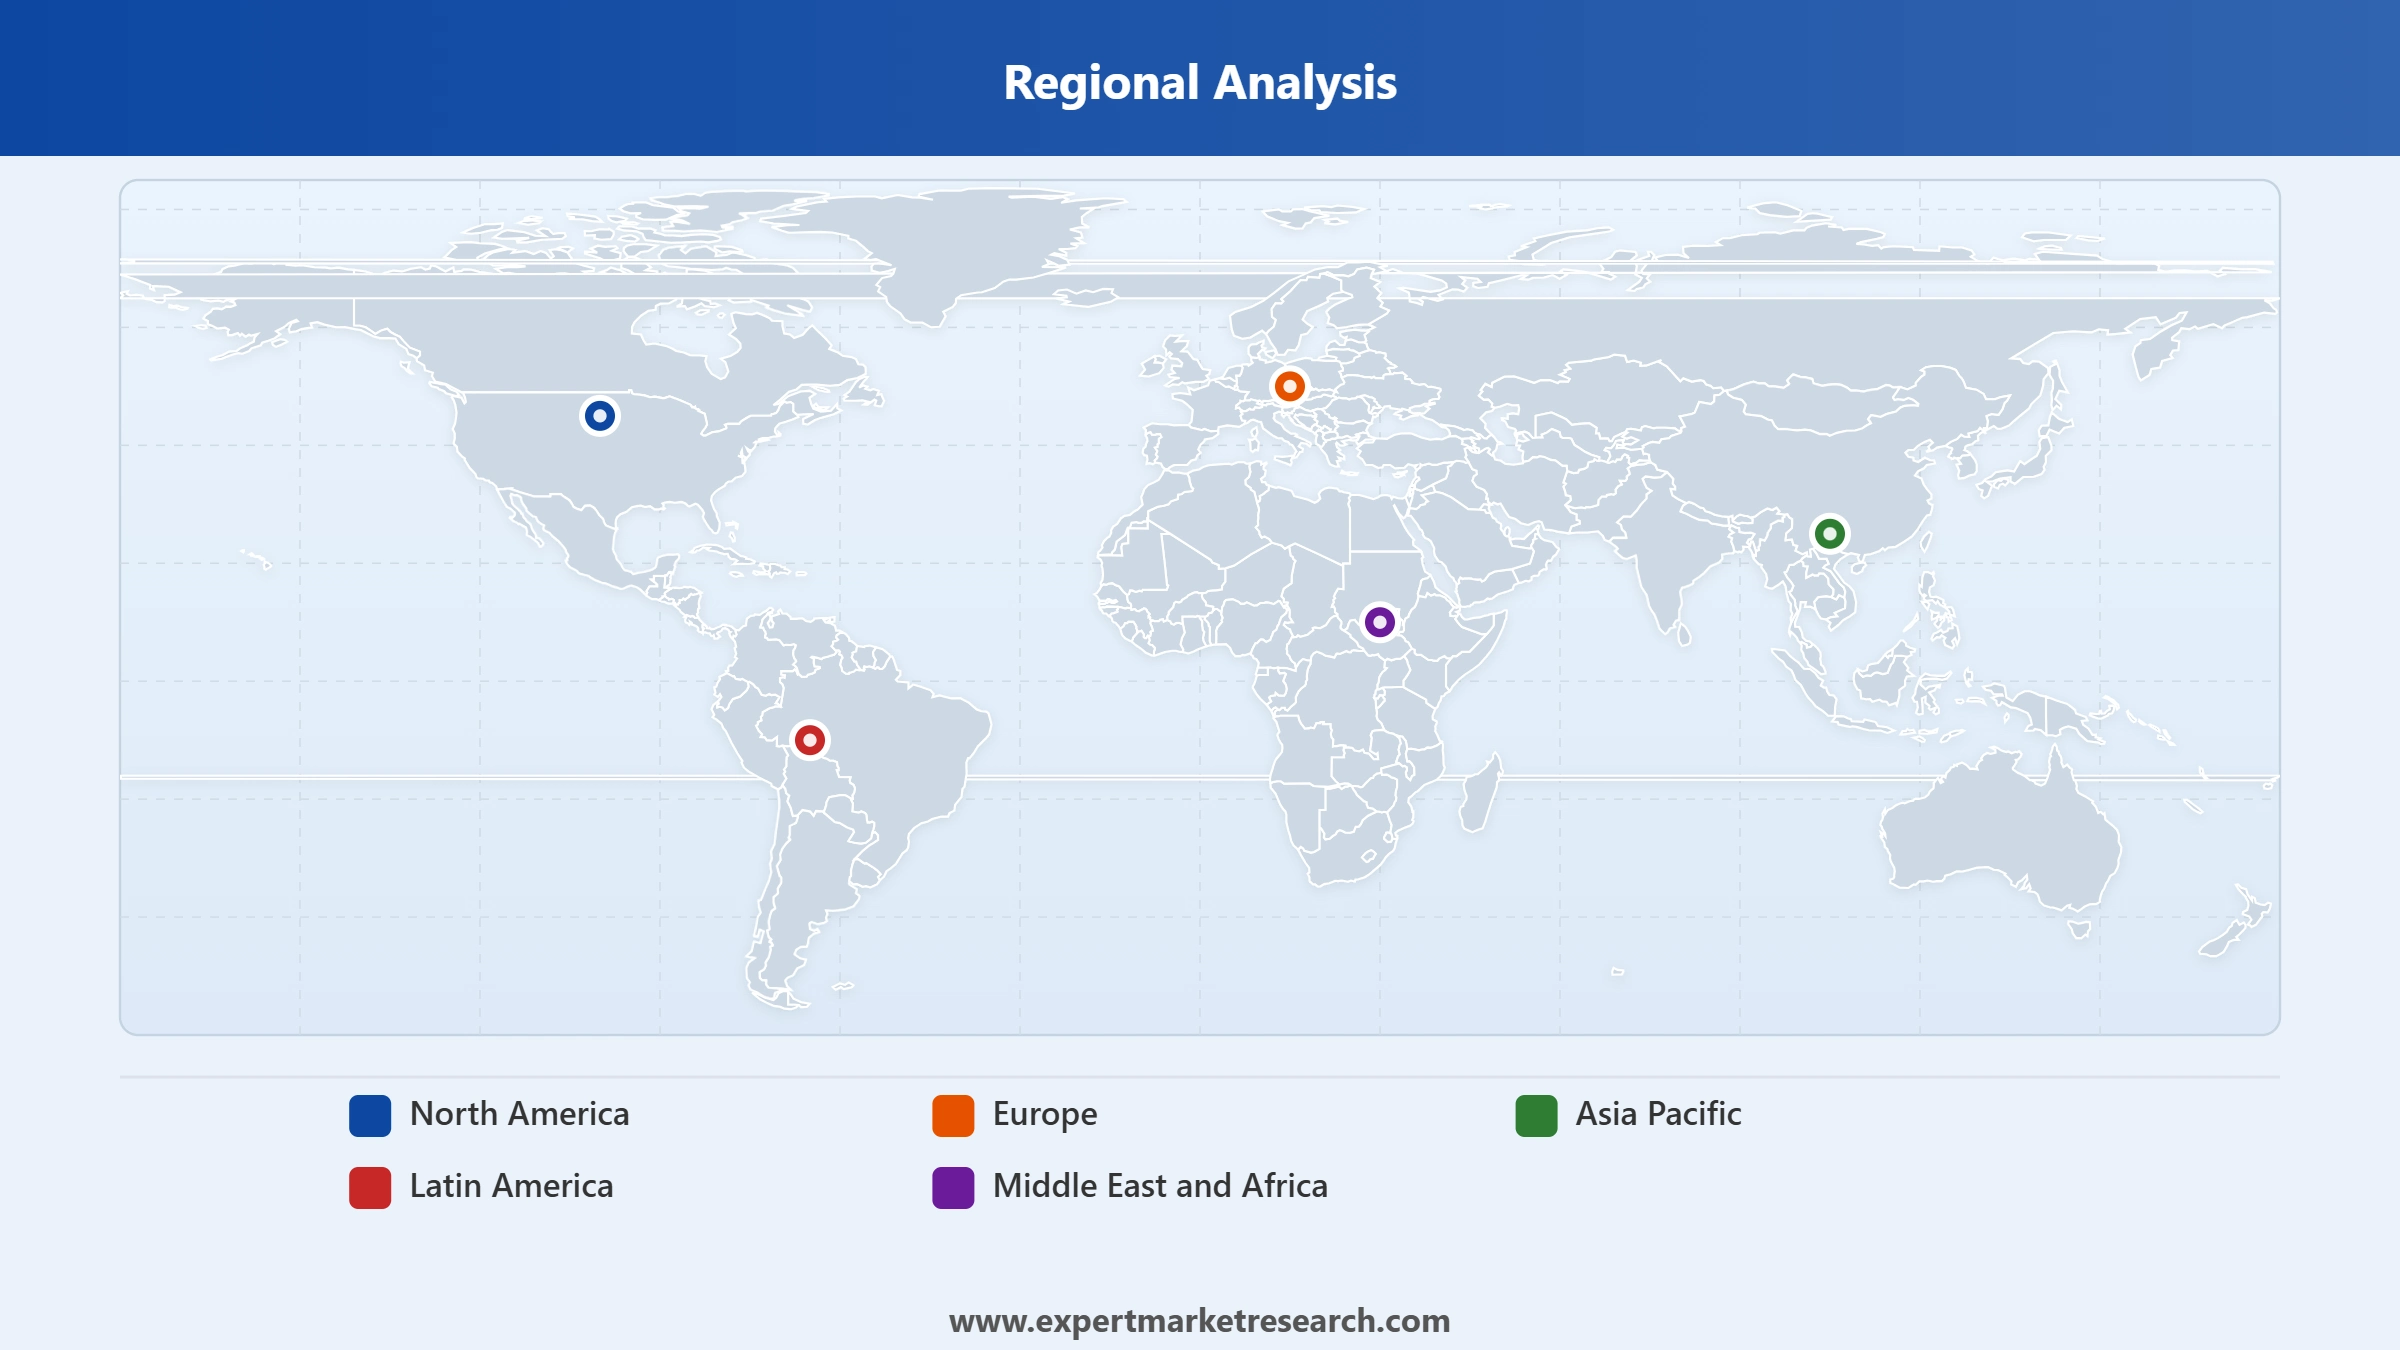
Key Insight: North America anchors revenue with the largest regional share, supported by USD 1.35 Trillion of 2025 US IT spending alone, deep enterprise budgets, and a hyperscaler base committing more than USD 600 Billion of 2026 capex. Europe is the fastest-growing major region, projected to rise from USD 1,189.91 Billion in 2025 to USD 2,592.81 Billion by 2035 at an 8.10% CAGR, supported by digital-sovereignty initiatives, AI Act compliance investments and large public-sector modernisation programmes. Asia Pacific (broader ICT) reached around USD 1.36 Trillion in 2025 and is forecast to grow at a 4.60% CAGR through 2035, led by China, India, Japan and Australia. Latin America and the Middle East and Africa are smaller but accelerating, with cloud-first national programmes in the GCC and Brazil pulling spend forward.
By Type, Communications Services historically anchors the largest share of total IT spending, supported by enterprise telecom contracts, fixed and mobile data services, and managed-network spending across hyperscale and enterprise customers, although the segment grows in low single digits. Enterprise IT Services-captured in EMR's report under customised software, app development, and IT consulting-is the second-largest share and is being reshaped by AI-implementation, FinOps, and managed-security demand. Data Centre Systems is comparatively smaller in revenue terms but commands the strongest forward CAGR thanks to AI-server, GPU and liquid-cooling capex, with industry analysts pegging 2026 growth at 55.8% and the long-run integrated-systems CAGR around 7.4%. Enterprise Software's share is rising visibly as agentic AI moves from optional add-on to default capability inside CRM, ERP, BI, and SCM suites.
Read more about this report - REQUEST FREE SAMPLE COPY IN PDF
By Region, North America commands the dominant share of global IT spending, anchored by the U.S. market's USD 1.35 Trillion 2025 base and the world's deepest hyperscaler ecosystem. Verizon, AT&T, Microsoft, Amazon, Google, Meta, and Oracle drive headline capex and IT-services demand. Europe is the second-largest share and the fastest-growing major region thanks to digital-sovereignty rules, the EU AI Act, GDPR-aligned cloud builds, and large public-sector digital transformation. Asia Pacific is a structural growth pillar with national strategies-Made in China 2025, Digital India, Society 5.0-accelerating cloud and software adoption, and India growing at around 5.1% CAGR through 2035 within the broader ICT footprint. Latin America and the Middle East and Africa are smaller but rising, with GCC sovereign cloud and AI investments lifting regional momentum.


Read more about this report - REQUEST FREE SAMPLE COPY IN PDF
North America remains the largest contributor to the Global IT Spending Market, with the U.S. alone accounting for USD 1.35 Trillion of 2025 spending and projected to reach USD 1.96 Trillion by 2035 at a 3.80% CAGR. The region's lead reflects deep enterprise IT budgets across financial services, healthcare, manufacturing, retail and the public sector, plus hyperscaler capex committing more than USD 600 Billion in 2026-roughly 75% of which is earmarked for AI infrastructure. Major company moves-Gemini Enterprise Agent Platform, Salesforce-Informatica, SAP-Microsoft cloud ERP alliance, and Oracle's USD 50 Billion 2026 capex-keep North America at the centre of generative-AI software, AI-server, cybersecurity, and IT-services demand, anchored by mature procurement, well-funded CIOs, and a deep partner channel.
Europe is the fastest-growing major region in the Global IT Spending Market, projected to scale from USD 1,189.91 Billion in 2025 to USD 2,592.81 Billion by 2035 at an 8.10% CAGR per EMR's regional report. Growth is driven by EU digital-sovereignty programmes, AI Act compliance spending, GDPR-aligned cloud builds, and large public-sector and defence modernisation budgets across Germany, France, the UK, Italy, and the Nordics. SAP's expanded Microsoft alliance, sovereign cloud builds by AWS, Google and Microsoft, and a wave of cybersecurity capex aimed at NIS2 and DORA compliance are propelling enterprise software, IT services and data-centre demand, while pan-European AI gigafactories anchor the next wave of infrastructure investment.
Read more about this report - REQUEST FREE SAMPLE COPY IN PDF
The Global IT Spending Market is best understood as an aggregate-demand pool rather than a single-vendor product market, with concentration at the category level: hyperscalers dominate cloud and AI infrastructure, a handful of mega-vendors anchor enterprise software, and a global cohort of consulting majors leads IT services. The competitive contest in 2026 has shifted from on-premise hardware and licence renewals toward AI-platform leadership, agentic-software differentiation, and sovereign-cloud positioning.
Strategic priorities across the vendor landscape converge on AI-infrastructure scale-up, embedding agentic AI inside flagship suites, cybersecurity bundling, and sovereign-cloud and data-residency capabilities for regulated industries. Cross-vendor partnerships-SAP-Microsoft for cloud ERP, Salesforce with OpenAI, Anthropic, Google and AWS, and the wider hyperscaler-telco cloud build-outs-indicate that interoperability and ecosystem reach are now decisive battlegrounds shaping enterprise IT spending allocation through 2035.
Discover the latest insights on the Global IT Spending Market 2026 with our comprehensive report. Stay ahead of the curve with detailed data on AI infrastructure capex, agentic enterprise software, cybersecurity, and the regions powering the next wave of IT investment. Whether you are a CIO building a multi-year roadmap, a vendor sizing your TAM, or an investor sizing the AI-IT supercycle, this report provides the clarity you need. Download your free sample now and unlock the key opportunities in the thriving Global IT Spending industry.
Upto 15% Off
USD
$2499 $2249
$3999 $3599
$4999 $4249
$5999 $5099


*While we strive to always give you current and accurate information, the numbers depicted on the website are indicative and may differ from the actual numbers in the main report. At Expert Market Research, we aim to bring you the latest insights and trends in the market. Using our analyses and forecasts, stakeholders can understand the market dynamics, navigate challenges, and capitalize on opportunities to make data-driven strategic decisions.*
In 2025, the market reached an approximate value of USD 4.02 Trillion.
The market is projected to grow at a CAGR of 3.50% between 2026 and 2035.
The market is estimated to witness a healthy growth in the forecast period of 2026-2035 to reach about USD 5.67 Trillion by 2035.
The emerging trends include the growing awareness regarding the benefits of AI audit management, the rising economic development, and the increasing investments to boost the security of IT.
North America dominates the market by its robust digital infrastructure, widespread cloud adoption, and leadership in AI and cybersecurity
The major types of IT spending in the market are data centre systems, enterprise software, enterprise IT services, devices, and communication services.
IT spending is the total money spent on IT systems and services by an organisation. IT spending is not only limited to IT organisations but is a significant aspect across diverse businesses, enabling the construction and maintenance of large-scale digital infrastructure and services.
Cloud Application Infrastructure Services (PaaS), Cloud Application Services (SaaS), and Cloud Business Process Services (BPaaS) contribute significantly to the market.
Key strategies driving the market include accelerated digital transformation, cloud migration, adoption of AI and automation, and focus on cybersecurity. Enterprises are investing in scalable infrastructure, enterprise software, and managed services to boost efficiency, enhance customer experience, and maintain competitiveness in an increasingly technology-driven global economy.
Explore our key highlights of the report and gain a concise overview of key findings, trends, and actionable insights that will empower your strategic decisions.
| Report Features | Details |
| Base Year | 2025 |
| Historical Period | 2019-2025 |
| Forecast Period | 2026-2035 |
| Scope of the Report |
Historical and Forecast Trends, Industry Drivers and Constraints, Historical and Forecast Market Analysis by Segment:
|
| Breakup by Type |
|
| Breakup by Region |
|
| Market Dynamics |
|
| Report Price and Purchase Option | Explore our purchase options that are best suited to your resources and industry needs. |
| Delivery Format | Delivered as an attached PDF and Excel through email, with an option of receiving an editable PPT, according to the purchase option. |
Datasheet
One User
USD 2,499
USD 2,249
tax inclusive*
Single User License
One User
USD 3,999
USD 3,599
tax inclusive*
Five User License
Five User
USD 4,999
USD 4,249
tax inclusive*
Corporate License
Unlimited Users
USD 5,999
USD 5,099
tax inclusive*
*Please note that the prices mentioned below are starting prices for each bundle type. Kindly contact our team for further details.*
Flash Bundle
Small Business Bundle
Growth Bundle
Enterprise Bundle
*Please note that the prices mentioned below are starting prices for each bundle type. Kindly contact our team for further details.*
Flash Bundle
Number of Reports: 3
20%
tax inclusive*
Small Business Bundle
Number of Reports: 5
25%
tax inclusive*
Growth Bundle
Number of Reports: 8
30%
tax inclusive*
Enterprise Bundle
Number of Reports: 10
35%
tax inclusive*
How To Order

Select License Type
Choose the right license for your needs and access rights.

Click on ‘Buy Now’
Add the report to your cart with one click and proceed to register.

Select Mode of Payment
Choose a payment option for a secure checkout. You will be redirected accordingly.
Strategic Solutions for Informed Decision-Making
Gain insights to stay ahead and seize opportunities.

Get insights & trends for a competitive edge.

Track prices with detailed trend reports.

Analyse trade data for supply chain insights.

Leverage cost reports for smart savings

Enhance supply chain with partnerships.

Connect For More Information
Our expert team of analysts will offer full support and resolve any queries regarding the report, before and after the purchase.
Our expert team of analysts will offer full support and resolve any queries regarding the report, before and after the purchase.
We employ meticulous research methods, blending advanced analytics and expert insights to deliver accurate, actionable industry intelligence, staying ahead of competitors.
Our skilled analysts offer unparalleled competitive advantage with detailed insights on current and emerging markets, ensuring your strategic edge.
We offer an in-depth yet simplified presentation of industry insights and analysis to meet your specific requirements effectively.


