

Consumer Insights
Uncover trends and behaviors shaping consumer choices today
Procurement Insights
Optimize your sourcing strategy with key market data
Industry Stats
Stay ahead with the latest trends and market analysis.
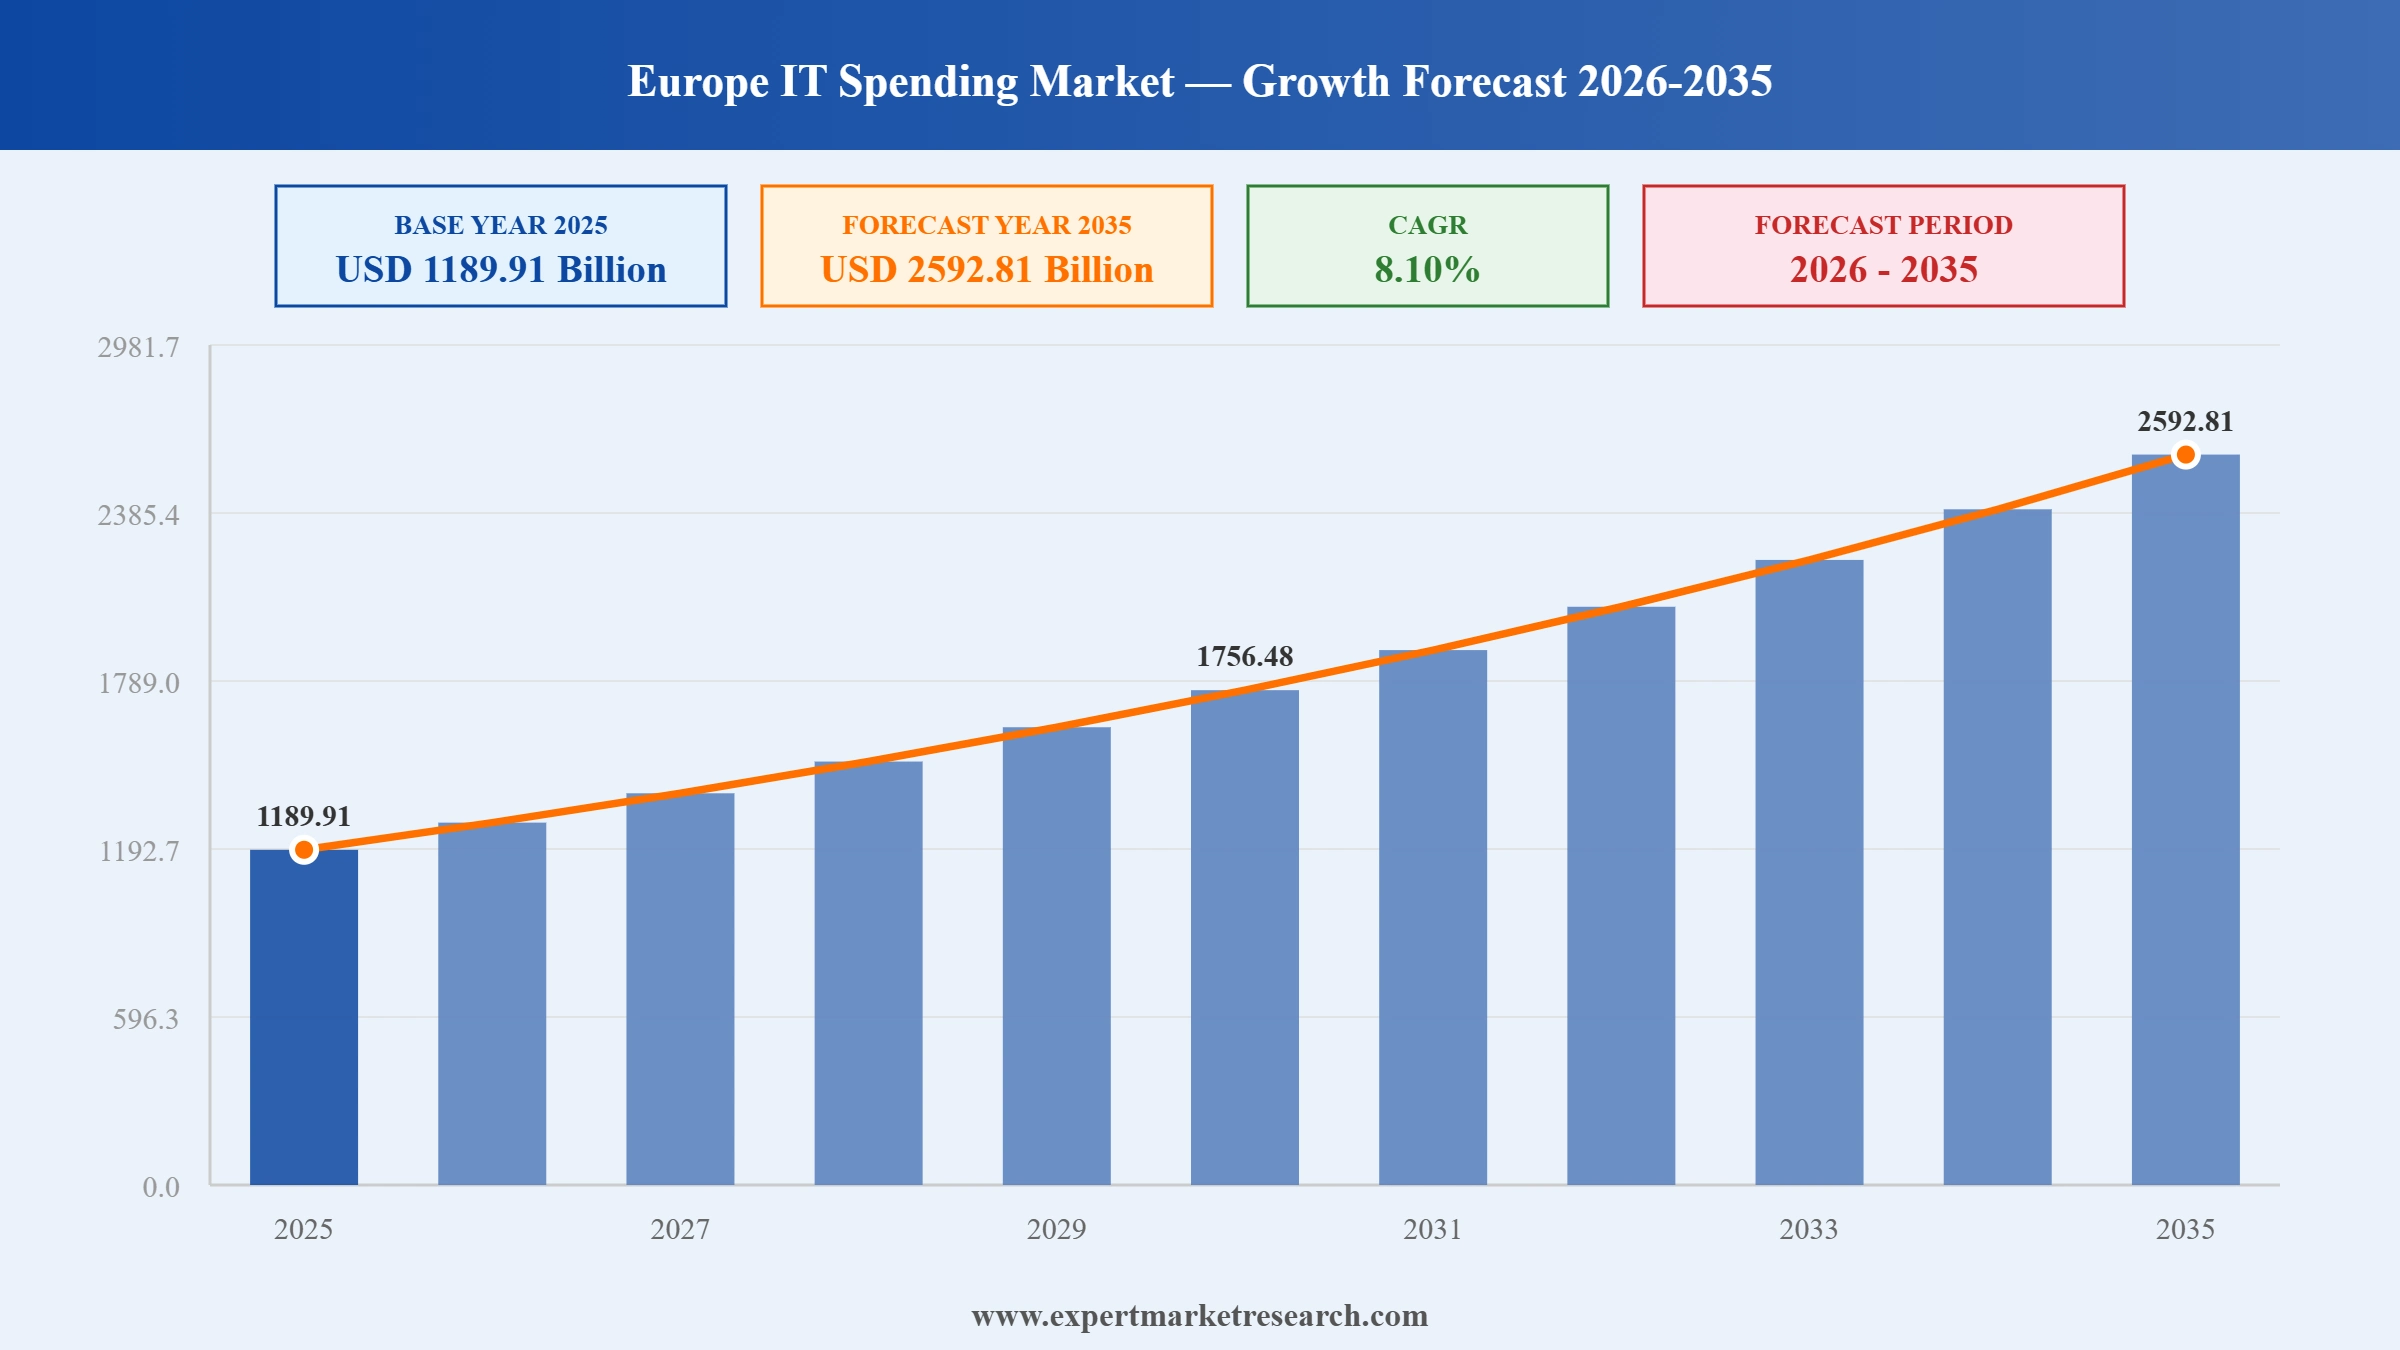
The Europe IT spending market reached a value of USD 1189.91 Billion at 2025 and is projected to expand at a CAGR of around 8.10% during the forecast period of 2026-2035. With accelerating generative AI adoption driving new infrastructure and governance investment, the EU AI Act enforcement creating enterprise software compliance expenditure waves, growing digital sovereignty mandates reshaping public sector procurement in favour of European-origin technology, and cloud migration timelines generating sustained multi-year IT services demand across enterprise and SME segments, the market is expected to reach USD 2592.81 Billion by 2035.
Read more about this report - REQUEST FREE SAMPLE COPY IN PDF
The Europe IT spending market is being defined by three concurrent structural forces: generative AI governance obligations under the EU AI Act, cloud migration timelines for enterprises still running on-premise workloads, and NIS2-driven cybersecurity investment that is no longer discretionary. Digital sovereignty policy is transitioning from rhetorical aspiration to procurement reality, with European-origin solutions gaining meaningful contract access in public sector and regulated industry segments.
Omdia confirmed Europe's technology spending entering its fastest growth period since 2021, with infrastructure investment rising 31% and server spending surging 53% as organisations expand data centre capacity for AI deployment. The UK technology sector expanded three times faster than France and twice as fast as Germany, signalling diverging national IT investment trajectories across the region.
Forrester confirmed Europe's technology spending surpassed €1.5 trillion, driven by AI hardware, cloud adoption, and digital sovereignty imperatives. Software investment rose 11%, with Germany's public cloud spending growing 17% to capture more than half of national software spend, while France's AI ecosystem anchored by Mistral AI and Hugging Face reinforced its competitive position in regional technology investment.
Amazon Web Services launched the general availability of its European Sovereign Cloud in Brandenburg, backed by a planned EUR 7.8 billion investment through 2040, accelerating procurement decisions across European enterprises prioritising GDPR-compliant infrastructure and localised cloud operations for sensitive workloads.
The European Commission accelerated EU AI Act risk classification enforcement, compelling enterprise IT buyers across financial services, healthcare, and critical infrastructure to allocate budgets toward AI governance tooling, model auditing platforms, and compliance documentation systems creating a structurally durable new IT spending category expected to sustain double-digit annual growth through the decade.
The most significant structural feature of the Europe IT spending market in 2025 is the simultaneous pressure of generative AI governance obligations, cloud migration timelines, and NIS2-driven cybersecurity investment. All three forces running concurrently explains the elevated CAGR on a market already exceeding one trillion dollars in base year value across the European region.
European digital sovereignty has moved from policy aspiration to procurement reality. The Industrial Accelerator Act, Data Act, and AI Act together create preferential access for European-origin technology in publicly funded procurement. European cloud providers and local AI platform vendors are winning contracts in the Europe IT spending market that would not have been competitive three years prior.
The shift from perpetual licences to SaaS is not simply a spending redistribution. When European companies migrate to cloud ERP, they typically add modules and integrate AI features, increasing per-seat spending. The European Commission's DESI 2022 data showed only 58% of enterprises providing adequate digital training, representing an enormous addressable SaaS market across the Europe IT spending market.
EU digitisation funding and SaaS affordability are driving rapid IT spending growth among European SMEs. The German Mittelstand is now a primary SaaS vendor target, and third-party providers are introducing tiered pricing plans to expand the Europe IT spending market growth opportunity in the smaller enterprise tier across the continent.
Gartner confirmed AI-related IT services spending in Europe reached USD 94 billion in 2025, up from USD 78 billion in 2024. This growth, concentrated in foundation model infrastructure, AI-adjacent data management tools, and EU AI Act compliance consulting, is creating the fastest-growing IT services sub-category in the Europe IT spending market.
The report titled "Europe IT Spending Market Report and Forecast 2026-2035" offers a detailed analysis of the market based on the following segments:
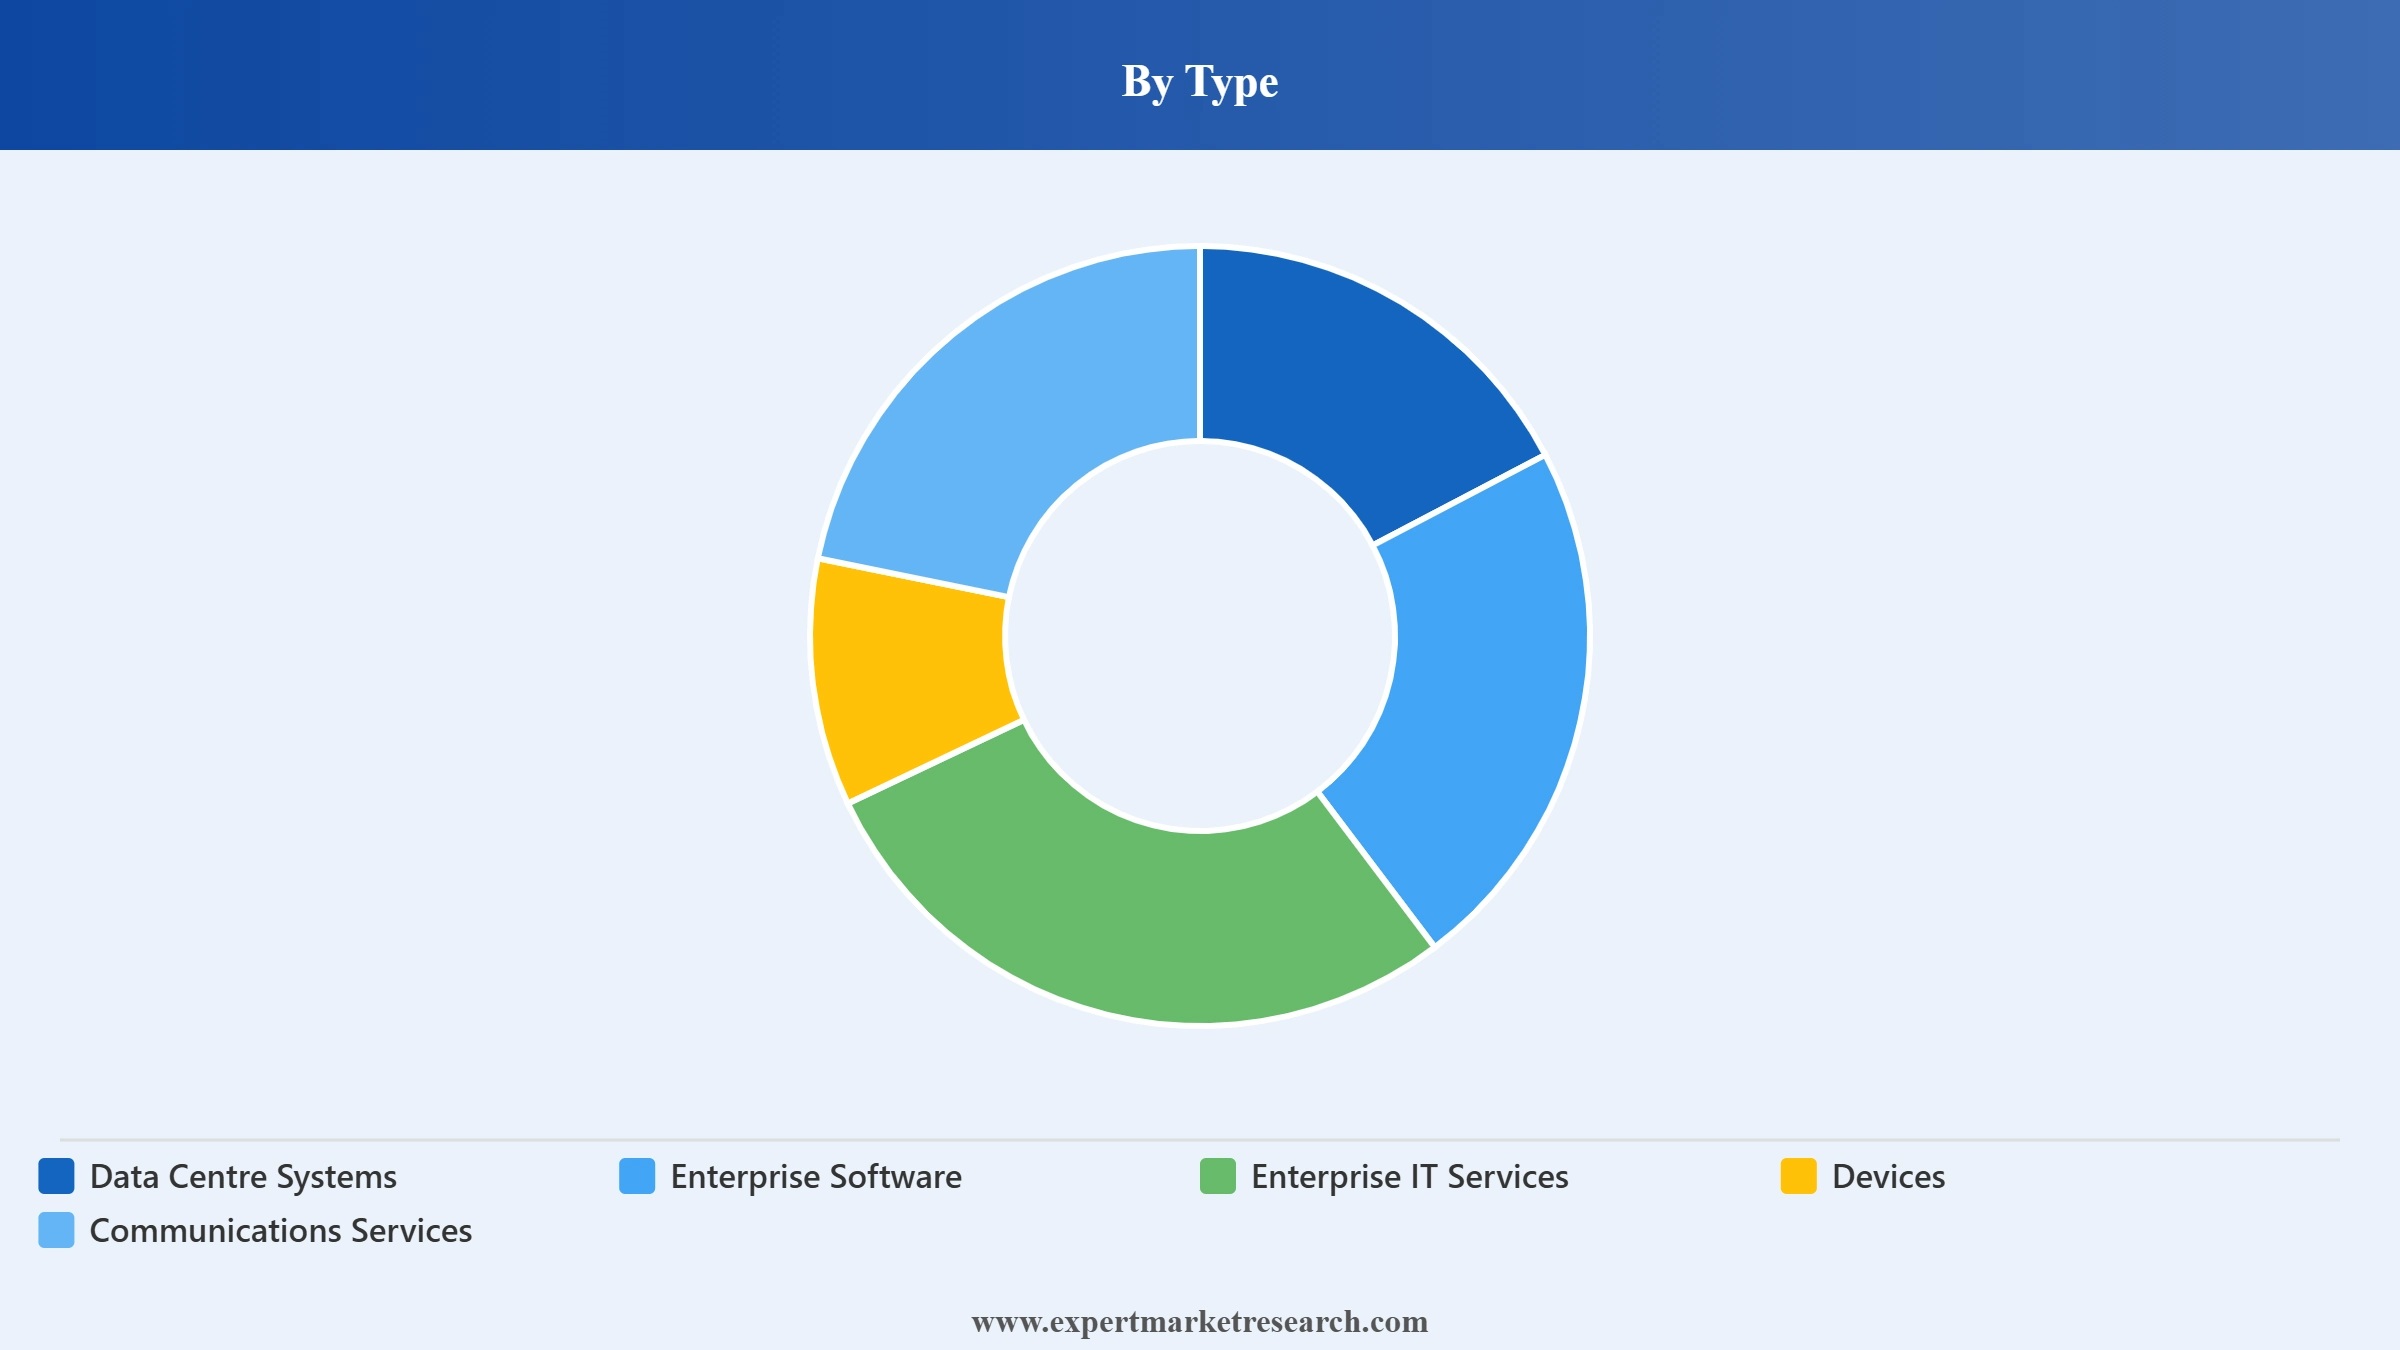
Market Breakup by Type
Key Insight: Data Centre Systems hold the dominant market share, driven by cloud infrastructure buildout, AI computing demand, and EU data sovereignty requirements mandating locally operated infrastructure. Large corporations are investing heavily in data centre development, and the market is expected to develop significantly with the continuously expanding cloud service market. Enterprise Software is the fastest-growing type, propelled by SaaS adoption and EU AI Act compliance tooling demand. Enterprise IT Services sustain the largest absolute value, underpinned by managed services and digital transformation consulting demand across European enterprises.
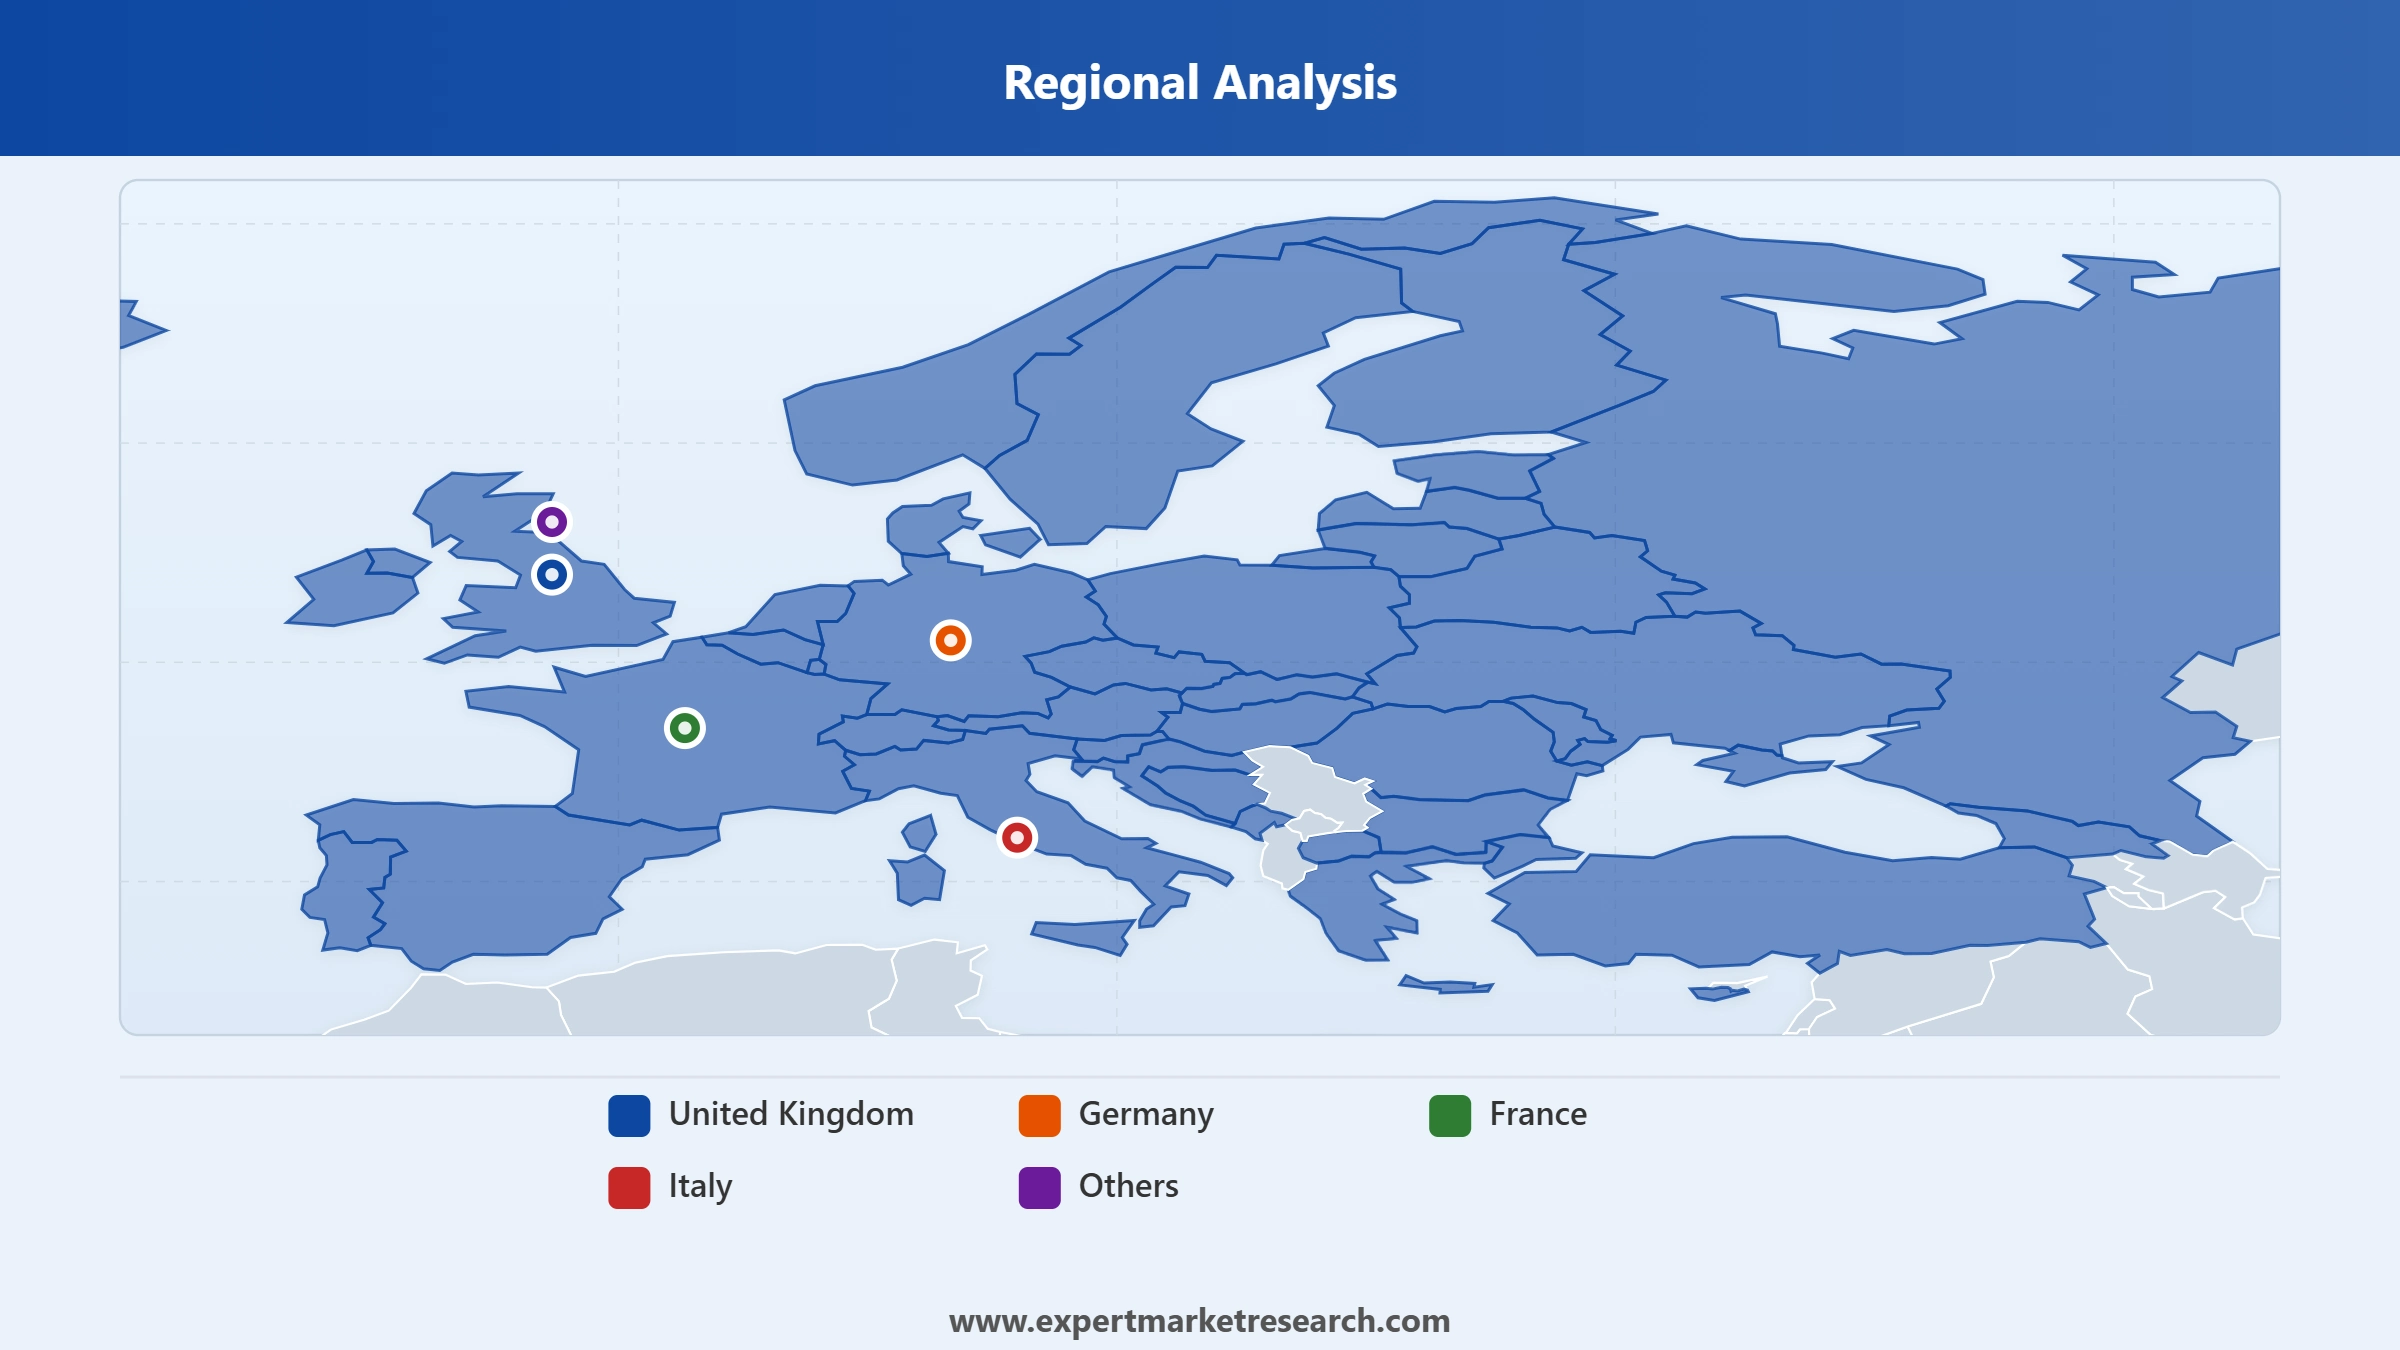
Market Breakup by Region
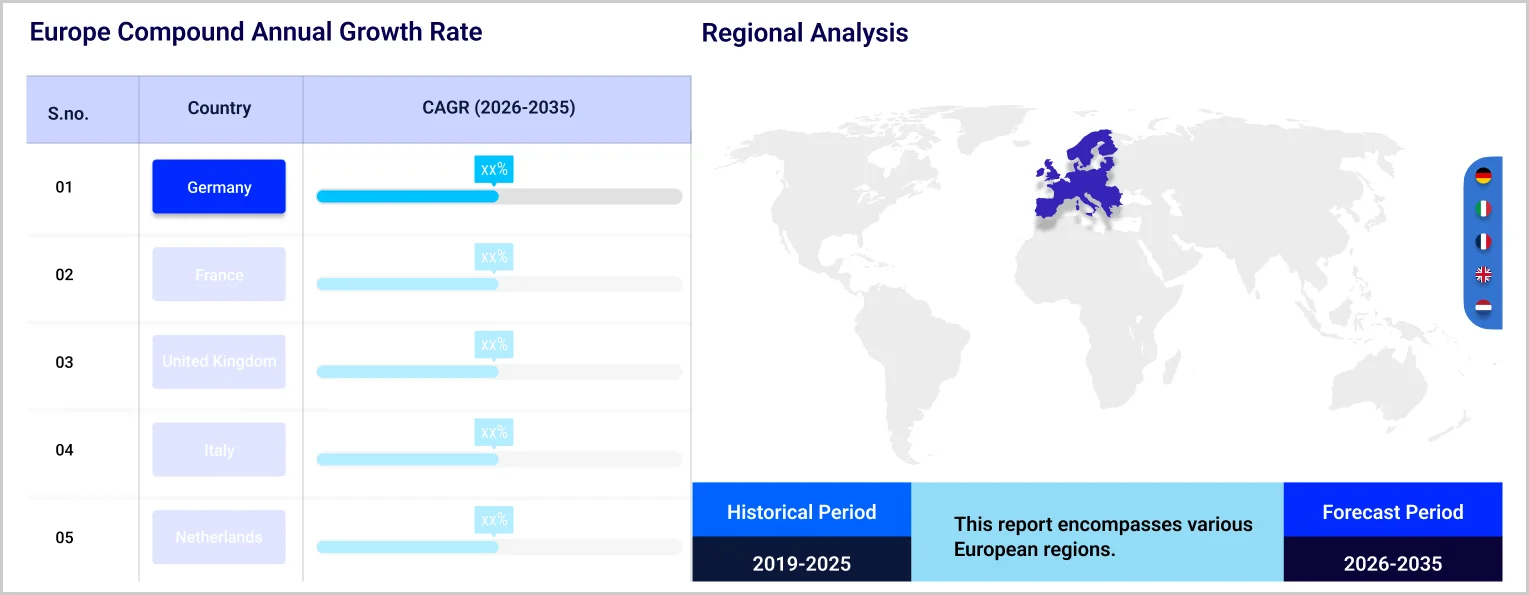
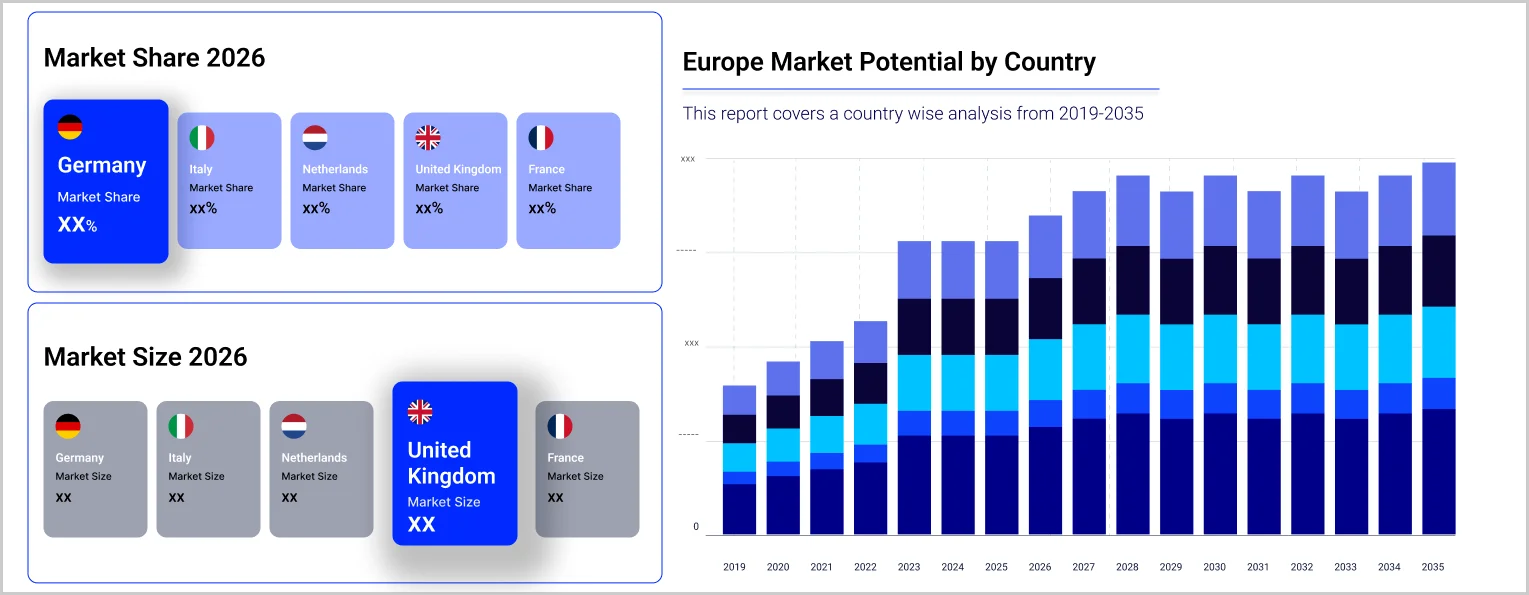
Key Insight: Germany leads the Europe IT spending market, with its industrial manufacturing sector generating intensive ERP, IoT, and automation software demand aligned with Industry 4.0 priorities. The United Kingdom remains a major market sustained by financial services and professional services IT intensity. France's public sector digitisation investments and Italy's National Recovery and Resilience Plan-funded enterprise software adoption are expanding both countries' IT spending market shares through the forecast period.
Read more about this report - REQUEST FREE SAMPLE COPY IN PDF
By Type, Data Centre Systems dominates the market due to cloud infrastructure buildout and increasing AI computing demand
Data Centre Systems hold the largest share of the Europe IT spending market, reflecting the capital-intensive nature of cloud infrastructure, AI computing capacity, and enterprise data centre modernisation. Large corporations across Germany, France, and the United Kingdom are investing heavily, while digital sovereignty mandates require EU-resident data processing, creating sustained demand for locally operated infrastructure. The continuously developing cloud service market in the region reinforces Data Centre Systems as the highest-value single segment in absolute terms.
Read more about this report - REQUEST FREE SAMPLE COPY IN PDF
Enterprise Software is the fastest-growing type segment in the Europe IT spending market, driven by the SaaS transition generating net per-seat spending increases when companies migrate to cloud ERP or CRM platforms. The EU AI Act's enforcement is additionally creating compliance software demand in financial services, insurance, and HR technology applications, adding a structurally new demand layer beyond organic SaaS migration spend. Enterprise IT Services underpin digital transformation programmes, while Communications Services grow as hybrid work sustains unified communications demand.
Germany dominates the European IT spending market due to industrial manufacturing sector technology investment requirements
Germany's position as the leading IT spending market in Europe is anchored by the scale and digitisation momentum of its industrial economy. Major manufacturing corporations, including automotive OEMs and their extensive supplier networks, are investing heavily in ERP platform modernisation, connected factory IoT infrastructure, and AI-driven quality control systems aligned with Industry 4.0 roadmaps. Germany's proactive AI adoption posture in engineering and production workflows, combined with federal and state-level digital transformation funding programmes, creates compound IT investment demand that consistently outpaces the continental average.
Read more about this report - REQUEST FREE SAMPLE COPY IN PDF
The United Kingdom, as the second-largest regional component of the Europe IT spending market, benefits from diversified demand across financial services, professional services, retail, and public sector digital transformation. In October 2024, the UK government published its National Data Strategy refresh, committing an additional GBP 2.5 billion to public sector technology modernisation and cloud migration over three years, directly increasing public sector IT spend. The country's financial services sector generates consistently high demand for enterprise software, cybersecurity services, and managed IT infrastructure.
The Europe IT spending market faces significant operational and structural challenges rooted in regulatory complexity, geopolitical pressure, and infrastructure cost disadvantages. The EU AI Act's binding risk classification framework imposes substantial compliance obligations on enterprise IT buyers across financial services, healthcare, and critical infrastructure, diverting resources from innovation-oriented spending. European data centres operate at structurally higher costs than US equivalents, driven by energy prices, grid constraints, and building permit timelines a cost gap that limits the pace at which European organisations can scale AI and cloud infrastructure.
Structural restraints moderate the pace and uniformity of IT spending growth across the region. IT budget constraints and limited headcount growth compress the speed at which organisations can deploy and operationalise AI investments despite high strategic intent. Regulatory fragmentation across member states creates cross-border compliance complexity for technology vendors and enterprise buyers alike, increasing procurement timelines and total cost of technology ownership. Digital sovereignty requirements, while commercially rational, push organisations toward local cloud providers that often carry higher unit costs than established hyperscaler alternatives.
Despite these headwinds, the market presents compelling growth opportunities. The AWS European Sovereign Cloud launch in Brandenburg confirms that global hyperscalers are permanently adapting to European compliance requirements, expanding available infrastructure for enterprise cloud migration. The EU AI Act is simultaneously creating a durable new IT spending category in AI governance tooling and model auditing. France's AI ecosystem anchored by Mistral AI and Hugging Face, combined with Germany's industrial digital transformation momentum, positions Europe to develop region-specific AI platforms that generate sustained domestic IT investment.
Gain a complete picture of the Europe IT spending market with our authoritative 2026 market report. Whether you are a technology vendor expanding your European footprint, a system integrator competing for digital transformation contracts, or an institutional investor evaluating European technology sector exposure, this report gives you the intelligence to move with confidence. Download your free sample now and explore the opportunities defining Europe's IT spending landscape.
Upto 15% Off
USD
$2499 $2249
$3999 $3599
$4999 $4249
$5999 $5099


*While we strive to always give you current and accurate information, the numbers depicted on the website are indicative and may differ from the actual numbers in the main report. At Expert Market Research, we aim to bring you the latest insights and trends in the market. Using our analyses and forecasts, stakeholders can understand the market dynamics, navigate challenges, and capitalize on opportunities to make data-driven strategic decisions.*
At 2025, the market reached an approximate value of USD 1189.91 Billion.
The market is projected to grow at a CAGR of 8.10% between 2026 and 2035.
The market is estimated to reach a value of USD 2592.81 Billion in 2035.
Companies shifting from traditional methods to modern systems and government organisations focusing on bolstering cybersecurity are the major industry drivers.
The triple convergence of GenAI, cloud migration, and cybersecurity driving non-discretionary spend increases, Digital Sovereignty reshaping public sector procurement from policy to practice, the SaaS transition creating spending acceleration beyond simple format substitution, and SME IT investment growing faster than enterprise as cloud-native tools reach the mid-market.
Data Centre Systems, Enterprise Software, Enterprise IT Services, Devices, and Communications Services. Each category further breaks down by company size, distinguishing spend patterns among small, mid-market, and large enterprise organisations.
The company sizes in the market include less than 300 employees, having 300-2000 employees, and having more than 2000 employees.
Explore our key highlights of the report and gain a concise overview of key findings, trends, and actionable insights that will empower your strategic decisions.
| REPORT FEATURES | DETAILS |
| Base Year | 2025 |
| Historical Period | 2019-2025 |
| Forecast Period | 2026-2035 |
| Scope of the Report |
Historical and Forecast Trends, Industry Drivers and Constraints, Historical and Forecast Market Analysis by Segment:
|
| Breakup by Type |
|
| Breakup by Region |
|
| Market Dynamics |
|
Datasheet
One User
USD 2,499
USD 2,249
tax inclusive*
Single User License
One User
USD 3,999
USD 3,599
tax inclusive*
Five User License
Five User
USD 4,999
USD 4,249
tax inclusive*
Corporate License
Unlimited Users
USD 5,999
USD 5,099
tax inclusive*
*Please note that the prices mentioned below are starting prices for each bundle type. Kindly contact our team for further details.*
Flash Bundle
Small Business Bundle
Growth Bundle
Enterprise Bundle
*Please note that the prices mentioned below are starting prices for each bundle type. Kindly contact our team for further details.*
Flash Bundle
Number of Reports: 3
20%
tax inclusive*
Small Business Bundle
Number of Reports: 5
25%
tax inclusive*
Growth Bundle
Number of Reports: 8
30%
tax inclusive*
Enterprise Bundle
Number of Reports: 10
35%
tax inclusive*
How To Order

Select License Type
Choose the right license for your needs and access rights.

Click on ‘Buy Now’
Add the report to your cart with one click and proceed to register.

Select Mode of Payment
Choose a payment option for a secure checkout. You will be redirected accordingly.
Strategic Solutions for Informed Decision-Making
Gain insights to stay ahead and seize opportunities.

Get insights & trends for a competitive edge.

Track prices with detailed trend reports.

Analyse trade data for supply chain insights.

Leverage cost reports for smart savings

Enhance supply chain with partnerships.

Connect For More Information
Our expert team of analysts will offer full support and resolve any queries regarding the report, before and after the purchase.
Our expert team of analysts will offer full support and resolve any queries regarding the report, before and after the purchase.
We employ meticulous research methods, blending advanced analytics and expert insights to deliver accurate, actionable industry intelligence, staying ahead of competitors.
Our skilled analysts offer unparalleled competitive advantage with detailed insights on current and emerging markets, ensuring your strategic edge.
We offer an in-depth yet simplified presentation of industry insights and analysis to meet your specific requirements effectively.


