

Consumer Insights
Uncover trends and behaviors shaping consumer choices today
Procurement Insights
Optimize your sourcing strategy with key market data
Industry Stats
Stay ahead with the latest trends and market analysis.
The global label-free array systems market size reached around USD 1.59 Billion in 2025. The market is projected to grow at a CAGR of 4.40% between 2026 and 2035 to reach nearly USD 2.45 Billion by 2035.
Compound Annual Growth Rate
4.4%
Value in USD Billion
2026-2035
Read more about this report - REQUEST FREE SAMPLE COPY IN PDF
North America is projected to be the largest regional market for label-free array systems driven by the rising demand for the product. The market in North America is being driven by the growing drug discoveries for chronic illnesses in the United States. The diversification and optimisations of the products by the manufacturers in the region are expected to boost the industry growth further.
Lael-free array systems do not use fluorescent or radioactive labels, dyes, or any other specialised reagents, unlike traditional labelled systems. They are preferred because of their accurate results, fast delivery, and reliability.
By technology, the market can be divided into:
The market can be broadly categorised on the basis of its applications segments into:
Based on end-use, the industry can be segmented into:
The EMR report looks into the regional markets of label-free array systems like:
Read more about this report - REQUEST FREE SAMPLE COPY IN PDF
Surface plasmon resonance technology is expected to witness the fastest growth among other label-free array systems technologies. The label-free array systems industry is being driven by the rising drug discovery by pharmaceutical and biotechnology companies. Personalisation of medicine is expected to boost the industry growth. The rising innovations and technological advancements are expected to drive the industry growth in the forecast period.


The report presents a detailed analysis of the following key players in the global label-free array systems market, looking into their capacity, market shares, and latest developments like capacity expansions, plant turnarounds, and mergers and acquisitions:
The EMR report gives an in-depth insight into the industry by providing a SWOT analysis as well as an analysis of Porter’s Five Forces model.
Upto 15% Off
USD
$5499 $4949
$3299 $2969
$6999 $5949
$8199 $6969


*While we strive to always give you current and accurate information, the numbers depicted on the website are indicative and may differ from the actual numbers in the main report. At Expert Market Research, we aim to bring you the latest insights and trends in the market. Using our analyses and forecasts, stakeholders can understand the market dynamics, navigate challenges, and capitalize on opportunities to make data-driven strategic decisions.*
The market attained a value of about USD 1.59 Billion in 2025 driven by increased fundings in life sciences research across the globe.
The market is anticipated to grow at a CAGR of 4.40% during the forecast period of 2026-2035, likely to reach a market value of USD 2.45 Billion by 2035.
The market demand is driven by increasing technical advancements along with growth in application of label free array systems across several research domains.
One of the significant market trends include rising automation in label free array systems. It enables proficient processing of large sample volumes and enhances the scalability and reproducibility of samples in drug discovery process.
Based on techniques, the market is divided into surface plasmon resonance, microcantilever, scanning kelvin nanoprobe, enthalpy array, atomic force microscopy, bio layer interferometry, cellular dielectric spectroscopy, electrochemical impedance spectroscopy, ellipsometry technique and others.
Major end users include contract research organizations (CROs), academic and research institutes, pharmaceutical and biotechnology industries, and others.
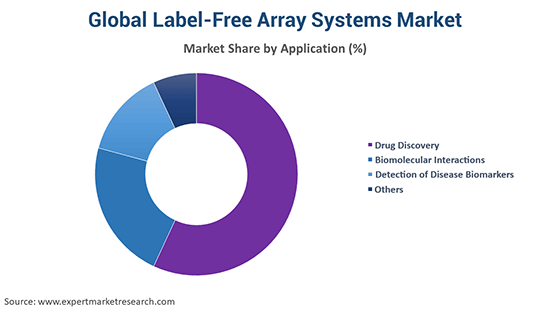
Common application areas include drug discovery, biomolecular interactions, protein interface analysis, antibody characterization and development, protein complex and cascade analysis, detection of disease biomarkers and others.
The major regions of the market include North America, Europe, Asia Pacific, Latin America, Middle East, and Africa.
Key players involved in the market are Cytiva, General Electric, Agilent Technologies, Inc., PerkinElmer Inc., Attana, BiOptix Analytical LLC, Eppendorf AG, Molecular Devices, LLC, Berthold Technologies GmbH and Co. KG, Arrayjet, Plexera Bioscience, Danaher Corporation, F. Hoffmann-La Roche Ltd., and Bio-Rad Laboratories, Inc.
Explore our key highlights of the report and gain a concise overview of key findings, trends, and actionable insights that will empower your strategic decisions.
| REPORT FEATURES | DETAILS |
| Base Year | 2025 |
| Historical Period | 2019-2025 |
| Forecast Period | 2026-2035 |
| Scope of the Report |
Historical and Forecast Trends, Industry Drivers and Constraints, Historical and Forecast Market Analysis by Segment:
|
| Breakup by Technology |
|
| Breakup by Application |
|
| Breakup by End Use |
|
| Breakup by Region |
|
| Market Dynamics |
|
| Competitive Landscape |
|
| Companies Covered |
|
| Report Price and Purchase Option | Explore our purchase options that are best suited to your resources and industry needs. |
| Delivery Format | Delivered as an attached PDF and Excel through email, with an option of receiving an editable PPT, according to the purchase option. |
Single User License
One User
USD 5,499
USD 4,949
tax inclusive*
Datasheet
One User
USD 3,299
USD 2,969
tax inclusive*
Five User License
Five User
USD 6,999
USD 5,949
tax inclusive*
Corporate License
Unlimited Users
USD 8,199
USD 6,969
tax inclusive*
*Please note that the prices mentioned below are starting prices for each bundle type. Kindly contact our team for further details.*
Flash Bundle
Small Business Bundle
Growth Bundle
Enterprise Bundle
*Please note that the prices mentioned below are starting prices for each bundle type. Kindly contact our team for further details.*
Flash Bundle
Number of Reports: 3
20%
tax inclusive*
Small Business Bundle
Number of Reports: 5
25%
tax inclusive*
Growth Bundle
Number of Reports: 8
30%
tax inclusive*
Enterprise Bundle
Number of Reports: 10
35%
tax inclusive*
How To Order

Select License Type
Choose the right license for your needs and access rights.

Click on ‘Buy Now’
Add the report to your cart with one click and proceed to register.

Select Mode of Payment
Choose a payment option for a secure checkout. You will be redirected accordingly.
Strategic Solutions for Informed Decision-Making
Gain insights to stay ahead and seize opportunities.

Get insights & trends for a competitive edge.

Track prices with detailed trend reports.

Analyse trade data for supply chain insights.

Leverage cost reports for smart savings

Enhance supply chain with partnerships.

Connect For More Information
Our expert team of analysts will offer full support and resolve any queries regarding the report, before and after the purchase.
Our expert team of analysts will offer full support and resolve any queries regarding the report, before and after the purchase.
We employ meticulous research methods, blending advanced analytics and expert insights to deliver accurate, actionable industry intelligence, staying ahead of competitors.
Our skilled analysts offer unparalleled competitive advantage with detailed insights on current and emerging markets, ensuring your strategic edge.
We offer an in-depth yet simplified presentation of industry insights and analysis to meet your specific requirements effectively.


