

Consumer Insights
Uncover trends and behaviors shaping consumer choices today
Procurement Insights
Optimize your sourcing strategy with key market data
Industry Stats
Stay ahead with the latest trends and market analysis.
The global land survey equipment market reached a value of approximately USD 8535.64 Million in 2025. The market is projected to grow at a CAGR of 6.20% between 2026 and 2035, reaching a value of around USD 15576.91 Million by 2035.
Compound Annual Growth Rate
6.2%
Value in USD Million
2026-2035
Read more about this report - REQUEST FREE SAMPLE COPY IN PDF
The progression of technology within land survey equipment is the primary driver behind the advancement of the market. Innovations like GPS technology, LiDAR, and drone surveying are elevating the effectiveness and precision of land surveying procedures.
Precision agriculture's adoption, reliant on precise land mapping and analysis, fuels the demand for specialized surveying equipment. Farmers and agricultural professionals utilise survey data to optimise crop yields, resource allocation, and land management practices.
The agriculture and allied sectors contributed approximately 18.6 % of India's GVA at current prices during 2021-22 whereas in 2019-2020 it was 18.3%.
Urbanisation trends, mobile and cloud-based surveying solutions, integration with geographic information systems, and miniaturization and cost efficiency are the major trends impacting global land survey equipment market growth.
Volvo Construction Equipment (Volvo CE) is at the forefront of electrifying construction machinery, revealing three fresh mid-size electric models that underscore the company's steadfast commitment to sustainable innovation.
In 20 districts, the Bihar state government has allocated electronic total station (ETS) machines to newly recruited amins. This move aligns with the revenue department's strategy to digitise land records and expedite survey work.
The National Land Survey of Finland exemplifies AI's integration into national mapping. NLS launched the ATMU project, funded by the Finnish Ministry of Finance, to develop deep learning for detecting changes in buildings.
LYNX, a venture by Lawrence & Mayo, has introduced its branded Total Station, seeking to revolutionise India's land surveying sector. The initiative aims to enhance accessibility and ensure competitive pricing for Total stations.
Urbanisation spurs demand for land surveying to aid planning, management, and sustainable development amidst city expansion and population growth.
Mobile and cloud-based solutions facilitate real-time data collection and team collaboration, enabling surveyors to access and update information remotely, thus enhancing workflow efficiency and shortening project timelines.
GIS technology enables improved data visualisation and analysis, enhancing decision-making in land surveying. Integration of survey data with GIS platforms generates comprehensive maps and models for valuable insights.
The development of lightweight and portable surveying equipment makes it easier for surveyors to carry out fieldwork in challenging terrains.
The growth of the land survey equipment market is projected to the integration of AI and machine learning algorithms which results in automating tasks such as data processing, object detection, and change recognition.
Advancements in lightweight, portable surveying equipment simplify fieldwork in rugged environments. Moreover, technological progress has lowered costs, widening access to high-quality surveying tools for diverse users.
Read more about this report - REQUEST FREE SAMPLE COPY IN PDF
“Land Survey Equipment Market Report and Forecast 2026-2035” offers a detailed analysis of the market based on the following segments:
Market Breakup by Product
Market Breakup by Industry
Market Breakup by Application
Market Breakup by Region


Read more about this report - REQUEST FREE SAMPLE COPY IN PDF
Global Navigation Satellite System (GNSS) enhance the land survey equipment market by offering versatility in surveying applications, enabling surveyors to conduct various survey types, including topographic mapping, construction layout, and cadastral surveys.
GNSS-enabled surveying equipment allows for faster data collection and processing. Surveyors can cover larger areas in less time compared to traditional surveying methods, leading to increased productivity and shorter project timelines.
UAVs equipped with advanced sensors and cameras can capture high-resolution imagery and data of land areas with unprecedented detail. Advances in UAV technology allow for real-time data processing and analysis, enabling surveyors to generate actionable insights and make informed decisions on-site.
The construction industry contributes to the land survey equipment market growth by conducting regular surveys to ensure adherence to design specifications and quality standards.
The integration of land surveying data with Building Information Modeling (BIM) systems enhances the accuracy and efficiency of construction projects. Surveying equipment captures precise site data, which is then used to create detailed 3D models in BIM software.
The oil and gas industry increasingly integrates advanced technologies like GIS, LiDAR, and real-time data processing with traditional surveying methods. This technological convergence enhances data accuracy, facilitates comprehensive analysis, and improves decision-making processes.
The Asia-Pacific region significantly drives the global land survey equipment market. This is primarily due to rapid urbanisation, infrastructure development, and government initiatives for land management and mapping in countries like China, India, and Southeast Asian nations. Additionally, advancements in technology, such as the integration of GPS and GIS in survey equipment, further stimulate market growth in this region.
Further, the construction Industry in India is expected to reach USD 1.4 trillion by 2025, further resulting in driving the land survey equipment market.
According to ITA, the Australian Building and Construction sector conducts building and construction activities worth over U$162 billion every year, representing roughly 10% of the GDP. This makes it the fifth-largest sector in the economy, as reported by Master Builders Australia.
As per the Construction Association of Korea (CAK) and the Construction & Economy Research Institute of Korea (CERIK), the Korean construction industry was expected to be valued at $166 billion (KRW 207 trillion) in 2023.
The company operates in segments including smart infrastructure business, industrial technology, mobility, and technological solutions.
Founded in 1932 and is headquartered in Tokyo. The company operates in three main segments including the Positioning Business, the Smart Infrastructure Business, and the Eye Care Business.
Founded in 2000 and is a Stockholm, Sweden-based company. Hexagon is a global leader in digital reality solutions. It utilises data to improve efficiency, productivity, quality, and safety in industrial, manufacturing, and mobility applications.
The company is headquartered in Baden-Wuerttemberg. The company operates in four business sectors: mobility, industrial technology, consumer goods, and energy and building technology.
Founded in 1978 and is headquartered in Westminster, CO. The company deals with technological solutions including analytics, connectivity, modelling, positioning, extended reality, and others.
*Please note that this is only a partial list; the complete list of key players is available in the full report. Additionally, the list of key players can be customized to better suit your needs.*
Other global land survey equipment market key players are Industries Limited (V.I Instruments), Hi-Target Suzhou Foif Co., Ltd., Kolida Instrument Co., Ltd., Shanghai Huace Navigation Technology Ltd. (CHC Navigation), and Stonex among others.
Upto 15% Off
USD
$2499 $2249
$3999 $3599
$4999 $4249
$5999 $5099


*While we strive to always give you current and accurate information, the numbers depicted on the website are indicative and may differ from the actual numbers in the main report. At Expert Market Research, we aim to bring you the latest insights and trends in the market. Using our analyses and forecasts, stakeholders can understand the market dynamics, navigate challenges, and capitalize on opportunities to make data-driven strategic decisions.*
The market was valued at USD 8535.64 Million in 2025.
The market is projected to grow at a CAGR of 6.20% between 2026 and 2035.
The revenue generated from the land survey equipment market is expected to reach USD 15576.91 Million in 2035.
The major market drivers include the increasing use of land survey equipment in precision agriculture, the growing use of land survey equipment to enhance seed quality, and the rising deployment of land survey equipment in the oil and gas market.
The key market trends include the growing cost-effectiveness of unmanned aerial vehicles (UAV), the increasing interest in LiDAR technology, and rising technological advancements and innovations.
The market is broken down into North America, Europe, Asia Pacific, Latin America, and Middle East and Africa.
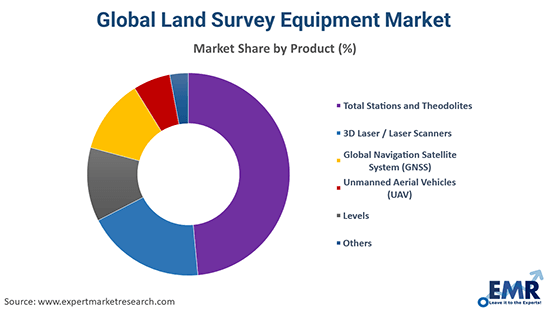
The market is categorised according to the product, which includes total stations and theodolites, 3d laser/laser scanners, global navigation satellite system (GNSS), unmanned aerial vehicles (UAV), levels, and others.
Based on the industry, the market is divided into oil and gas, construction, mining, disaster management, agriculture, and others.
Based on the application, the market is divided into volumetric calculations, inspection and monitoring, and layout points.
The market key players are Topcon Corporation, Hexagon, Robert Bosch GmbH (CST/Berger), Trimble Inc., Industries Limited (V.I Instruments), Hi-Target Suzhou Foif Co., Ltd., Kolida Instrument Co., Ltd., Shanghai Huace Navigation Technology Ltd. (CHC Navigation), and Stonex among others.
Explore our key highlights of the report and gain a concise overview of key findings, trends, and actionable insights that will empower your strategic decisions.
| REPORT FEATURES | DETAILS |
| Base Year | 2025 |
| Historical Period | 2019-2025 |
| Forecast Period | 2026-2035 |
| Scope of the Report |
Historical and Forecast Trends, Industry Drivers and Constraints, Historical and Forecast Market Analysis by Segment:
|
| Breakup by Product |
|
| Breakup by Industry |
|
| Breakup by Application |
|
| Breakup by Region |
|
| Market Dynamics |
|
| Competitive Landscape |
|
| Companies Covered |
|
| Report Price and Purchase Option | Explore our purchase options that are best suited to your resources and industry needs. |
| Delivery Format | Delivered as an attached PDF and Excel through email, with an option of receiving an editable PPT, according to the purchase option. |
Datasheet
One User
USD 2,499
USD 2,249
tax inclusive*
Single User License
One User
USD 3,999
USD 3,599
tax inclusive*
Five User License
Five User
USD 4,999
USD 4,249
tax inclusive*
Corporate License
Unlimited Users
USD 5,999
USD 5,099
tax inclusive*
*Please note that the prices mentioned below are starting prices for each bundle type. Kindly contact our team for further details.*
Flash Bundle
Small Business Bundle
Growth Bundle
Enterprise Bundle
*Please note that the prices mentioned below are starting prices for each bundle type. Kindly contact our team for further details.*
Flash Bundle
Number of Reports: 3
20%
tax inclusive*
Small Business Bundle
Number of Reports: 5
25%
tax inclusive*
Growth Bundle
Number of Reports: 8
30%
tax inclusive*
Enterprise Bundle
Number of Reports: 10
35%
tax inclusive*
How To Order

Select License Type
Choose the right license for your needs and access rights.

Click on ‘Buy Now’
Add the report to your cart with one click and proceed to register.

Select Mode of Payment
Choose a payment option for a secure checkout. You will be redirected accordingly.
Strategic Solutions for Informed Decision-Making
Gain insights to stay ahead and seize opportunities.

Get insights & trends for a competitive edge.

Track prices with detailed trend reports.

Analyse trade data for supply chain insights.

Leverage cost reports for smart savings

Enhance supply chain with partnerships.

Connect For More Information
Our expert team of analysts will offer full support and resolve any queries regarding the report, before and after the purchase.
Our expert team of analysts will offer full support and resolve any queries regarding the report, before and after the purchase.
We employ meticulous research methods, blending advanced analytics and expert insights to deliver accurate, actionable industry intelligence, staying ahead of competitors.
Our skilled analysts offer unparalleled competitive advantage with detailed insights on current and emerging markets, ensuring your strategic edge.
We offer an in-depth yet simplified presentation of industry insights and analysis to meet your specific requirements effectively.


