

Consumer Insights
Uncover trends and behaviors shaping consumer choices today
Procurement Insights
Optimize your sourcing strategy with key market data
Industry Stats
Stay ahead with the latest trends and market analysis.
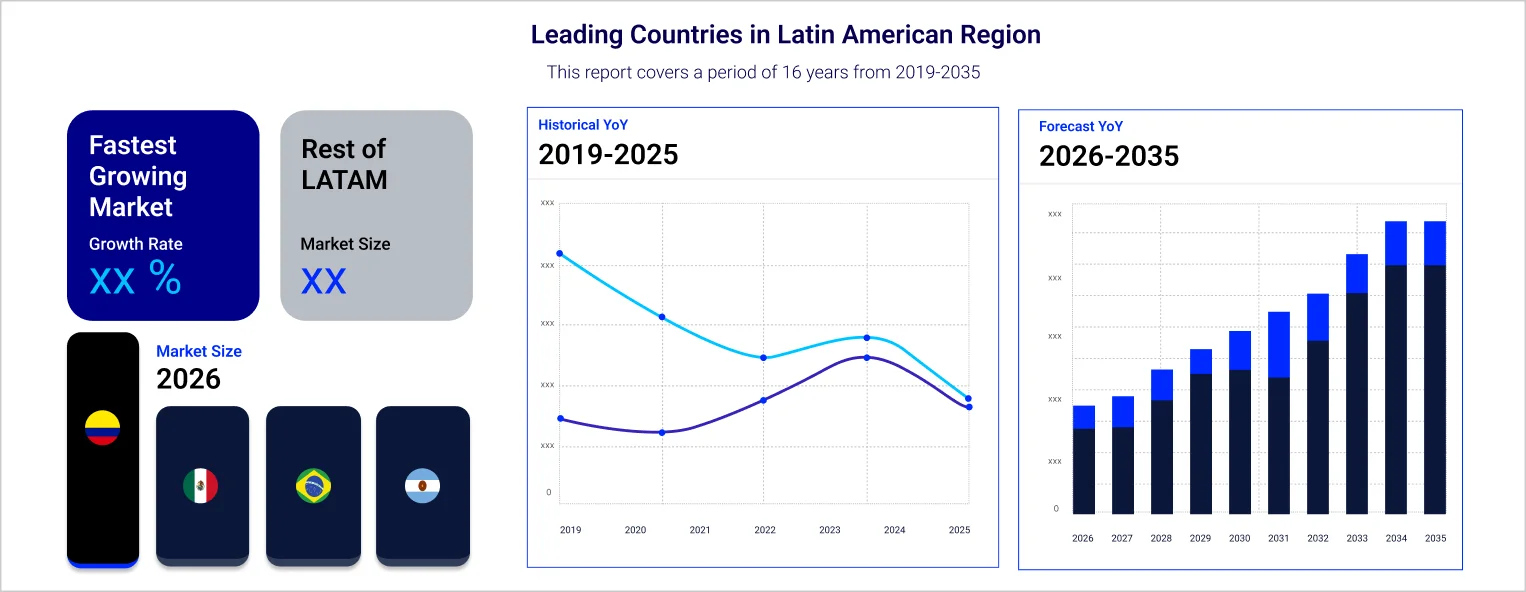
The Latin America polylactic acid (PLA) market is estimated to grow at a CAGR of 10.20% during 2026-2035.
Stringent laws in several Mexican states, such as the State of Guerrero and Jalisco prohibiting the use of plastic bags, are aiding the demand for bioplastics.
Brazil is the world’s fourth-largest producer of plastic waste.
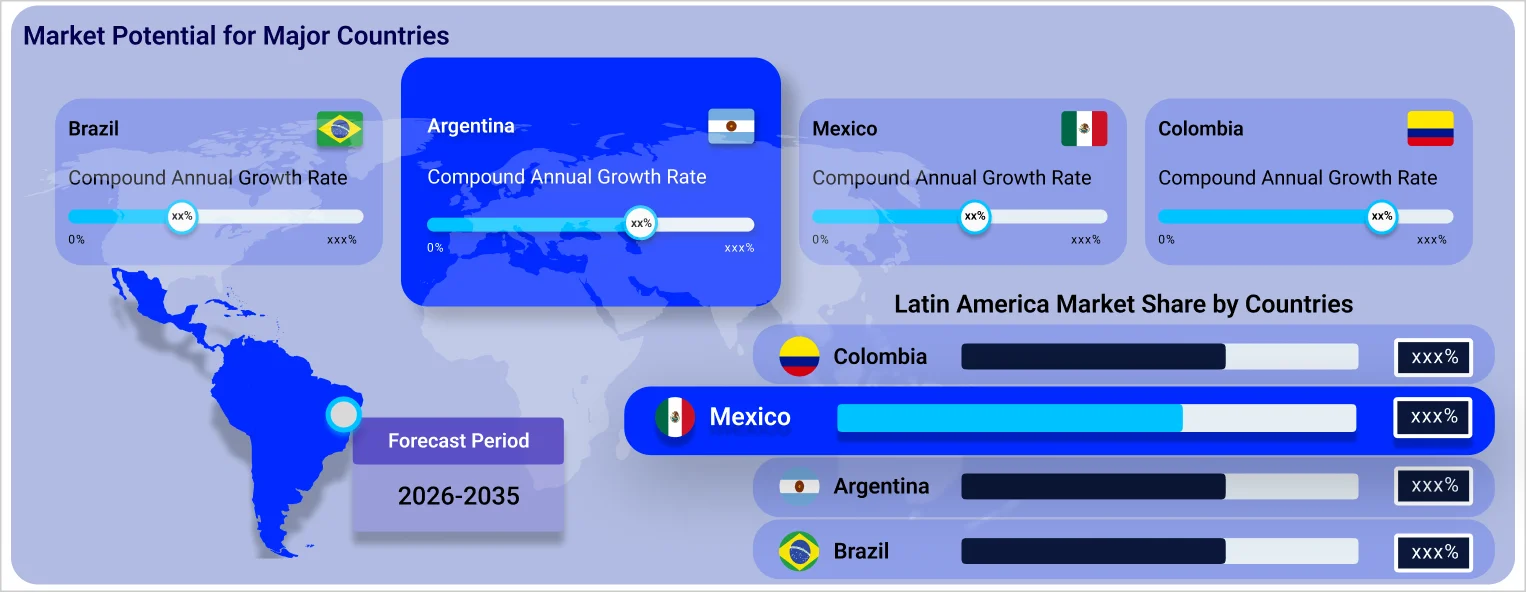
Compound Annual Growth Rate
10.2%
2026-2035
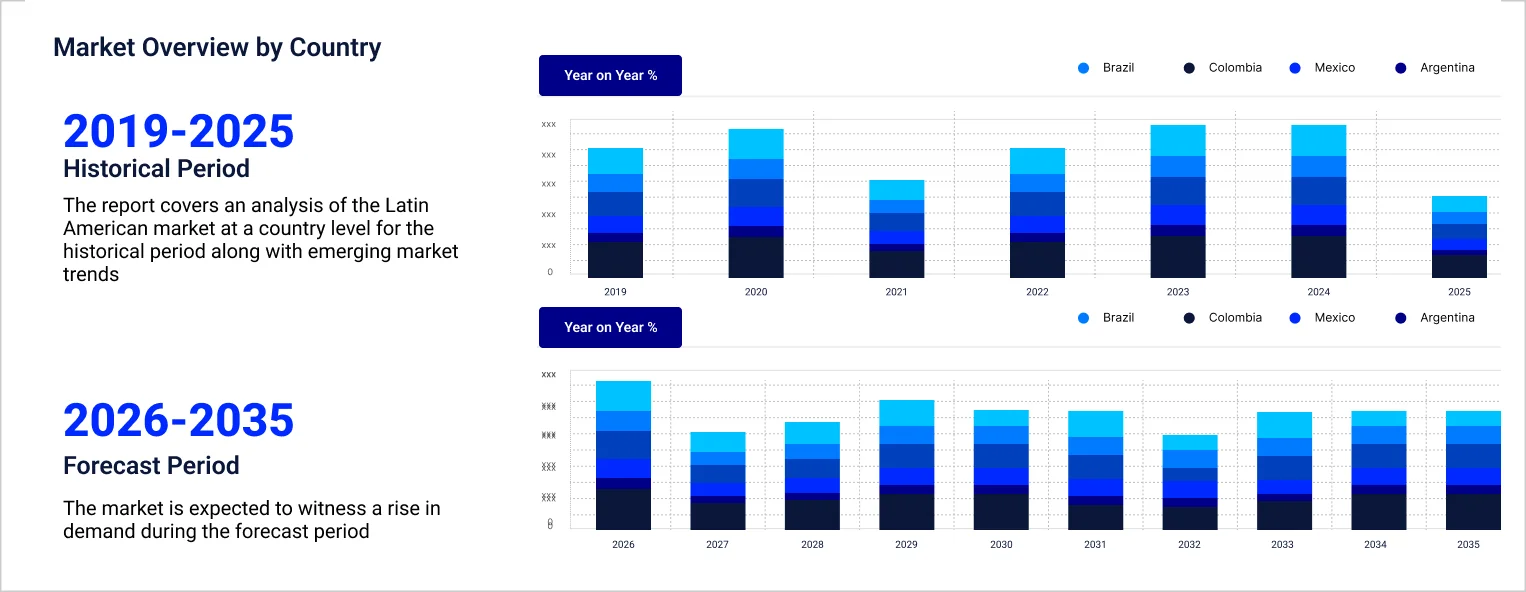
The rising plastic waste generated by the country is compelling the government to encourage the production and adoption of bioplastics, aiding the Latin America polylactic acid (PLA) market growth. For instance, according to the Blue Keepers project which is part of the United Nations (UN) Global Compact in Brazil, the country discards around 3.44 million tons of plastic bags, bottles, shampoo containers, straws, and polystyrene into the environment annually. Further, Argentinean consumers discards around 12 million plastic bottles daily. Further, less than 25% of these get recycled. The heaps of plastic waste in roadside dumps and landfills make the switching to bioplastics and bio-based plastics sustainable for Latin Americans.
Further, the raw materials for PLA production include corn, cassava, sugar beet, and sugarcane. Brazil is a significant corn producer globally. During 2021-2022, the country produced 116 million metric tons of corn. The shift towards sustainable materials is also becoming a standard in the Mexican packaging sector, with companies widely using plant-based plastics, biodegradable compounds, and recycled paper. Packaging made from cornstarch-based bioplastics is gaining prevalence as an eco-friendly alternative to traditional plastic.
As per the Latin America polylactic acid (PLA) market report, PLA plays a crucial role in the biomedical sector. A variety of PLA blends can be deployed for a variety of biomedical applications such as drug delivery, tissue engineering, implants, and sutures.
"Latin America Polylactic Acid (PLA) Market Report and Forecast 2026-2035" offers a detailed analysis of the market based on the following segments:
Market Breakup by Raw Material
Market Breakup by Grade
Market Breakup by Application
Market Breakup by End Use
Market Breakup by Region
The key players in the polylactic acid (PLA) market in Latin America are investing in research to develop advanced PLA products to meet the sustainability requirements of end-use markets.
Upto 15% Off
USD
$2499 $2249
$3999 $3599
$4999 $4249
$5999 $5099


*While we strive to always give you current and accurate information, the numbers depicted on the website are indicative and may differ from the actual numbers in the main report. At Expert Market Research, we aim to bring you the latest insights and trends in the market. Using our analyses and forecasts, stakeholders can understand the market dynamics, navigate challenges, and capitalize on opportunities to make data-driven strategic decisions.*
The market is expected to grow at a CAGR of 10.20% between 2026 and 2035.
Polylactic Acid (PLA)’s biodegradation time makes it an ideal choice for in vivo implantation. The combination of PLA with materials such as glass particles and PEG allows for better control of the scaffold's physical and mechanical properties to improve the printing process.
PLA’s biodegradability and biocompatibility constitute an ideal vehicle for parenteral-controlled drug delivery systems.
The major drivers of the market include rising plastic pollution caused by non-biodegradable plastic packaging, a ban on plastic use, and a wide availability of corn to produce PLA.
Key trends aiding market expansion include growing awareness of environmental pollution, research in raw materials for producing bioplastics, and a ban on non-biodegradable plastics in several countries.
Major countries in the market are Brazil, Mexico, Argentina, and others.
The raw materials of polylactic acid (PLA) are sugarcane, corn, cassava, sugar beet, and others.
Key players in the market are BASF SE, NatureWorks LLC, TotalEnergies SE, FUTERRO S.A., Unitika Ltd, Jiangxi Keyuan Bio-Material Co., Ltd, Jilin COFCO Biomaterial Co., Ltd, China BBCA Group, and others.
Explore our key highlights of the report and gain a concise overview of key findings, trends, and actionable insights that will empower your strategic decisions.
| REPORT FEATURES | DETAILS |
| Base Year | 2025 |
| Historical Period | 2019-2025 |
| Forecast Period | 2026-2035 |
| Scope of the Report |
Historical and Forecast Trends, Industry Drivers and Constraints, Historical and Forecast Market Analysis by Segment:
|
| Breakup by Raw Material |
|
| Breakup by Grade |
|
| Breakup by Application |
|
| Breakup by End Use |
|
| Breakup by Region |
|
| Market Dynamics |
|
| Competitive Landscape |
|
| Companies Covered |
|
Datasheet
One User
USD 2,499
USD 2,249
tax inclusive*
Single User License
One User
USD 3,999
USD 3,599
tax inclusive*
Five User License
Five User
USD 4,999
USD 4,249
tax inclusive*
Corporate License
Unlimited Users
USD 5,999
USD 5,099
tax inclusive*
*Please note that the prices mentioned below are starting prices for each bundle type. Kindly contact our team for further details.*
Flash Bundle
Small Business Bundle
Growth Bundle
Enterprise Bundle
*Please note that the prices mentioned below are starting prices for each bundle type. Kindly contact our team for further details.*
Flash Bundle
Number of Reports: 3
20%
tax inclusive*
Small Business Bundle
Number of Reports: 5
25%
tax inclusive*
Growth Bundle
Number of Reports: 8
30%
tax inclusive*
Enterprise Bundle
Number of Reports: 10
35%
tax inclusive*
How To Order

Select License Type
Choose the right license for your needs and access rights.

Click on ‘Buy Now’
Add the report to your cart with one click and proceed to register.

Select Mode of Payment
Choose a payment option for a secure checkout. You will be redirected accordingly.
Strategic Solutions for Informed Decision-Making
Gain insights to stay ahead and seize opportunities.

Get insights & trends for a competitive edge.

Track prices with detailed trend reports.

Analyse trade data for supply chain insights.

Leverage cost reports for smart savings

Enhance supply chain with partnerships.

Connect For More Information
Our expert team of analysts will offer full support and resolve any queries regarding the report, before and after the purchase.
Our expert team of analysts will offer full support and resolve any queries regarding the report, before and after the purchase.
We employ meticulous research methods, blending advanced analytics and expert insights to deliver accurate, actionable industry intelligence, staying ahead of competitors.
Our skilled analysts offer unparalleled competitive advantage with detailed insights on current and emerging markets, ensuring your strategic edge.
We offer an in-depth yet simplified presentation of industry insights and analysis to meet your specific requirements effectively.


