

Consumer Insights
Uncover trends and behaviors shaping consumer choices today
Procurement Insights
Optimize your sourcing strategy with key market data
Industry Stats
Stay ahead with the latest trends and market analysis.
The global military sensors market attained a value of USD 12.65 Billion in 2025 and is projected to expand at a CAGR of 5.80% through 2035. The market is further expected to achieve USD 22.23 Billion by 2035. Growing adoption of autonomous defense equipment and electronic warfare systems is creating a greater need for compact and highly accurate military sensors.
According to RTX, Raytheon completed the first flight test of its RAIVEN Staring electro-optical and infrared sensor suite on a UH-60 Black Hawk on April 15, 2026, demonstrating 270-degree situational awareness in zero illumination. The advance reinforces accelerating demand for next-generation EO/IR military sensors across air, ground, and sea platforms and supports durable growth and competitive momentum across the global military sensors market.
According to Military Embedded Systems, the Lower Tier Air and Missile Defense Sensor radar continued approaching a major U.S. Army production milestone in early 2026, with low-rate initial production already underway. The 360-degree GaN-based system is reshaping integrated air-and-missile defense sensor architectures, reinforcing accelerating procurement momentum and durable growth across the global military sensors market amid heightened geopolitical demand.
Procurement of military equipment is being impacted by two different sources of demand. Growth in defense against UAS attacks results in greater use of radar systems, electro-optical systems, and radio frequency detection networks, which detect aerial threats to military facilities and infrastructure that have minimal signatures. Secondly, border intelligence enhancement is leading to greater use of seismic sensors, infrared sensors, and fiber-based sensor technology that remotely detects activity along borders, thereby accelerating demand in the military sensors market.
The rapid development in sensors technology in the military sector is being accelerated by the modernization of defense electronics, multi-domain surveillance needs, and digitization of warfare, which is obliging contractors to enhance sensor precision in challenging environments. For example, in January 2024, Lockheed Martin announced increased activity surrounding the integration of advanced infrared sensing for missiles tracking and layered air defenses linked to sophisticated battle-awareness needs. The trend is being further prompted by the growing attention to consistent target detection, with militaries aiming at sensor fusion among ground, naval, and aerial platforms. According to the military sensors market analysis, global military spending reached USD 2718 billion in 2024, with electronic warfare, ISR, and sensor-related modernization attracting considerable investments. As a result, defense companies are being prompted to design advanced thermal, radar, acoustic, and electromagnetic sensing solutions capable of withstanding extreme vibrations and signal interference.
Another trend in the military sensors market involves the development of AI-enabled sensing platforms that minimize response times in missiles interception, detection of drones, and perimeter surveillance systems. For example, in May 2026, Arkeus raised USD 18 million in Series A funding to scale AI-powered industrial imaging and inspection technologies. Military contractors are becoming increasingly focused on developing multi-functional payload modules as opposed to separate sensors. Moreover, there is an increasing focus by naval defense contractors on enhancing underwater acoustic sensor technology for anti-submarine warfare amidst growing geostrategic interest in maritime surveillance.
Compound Annual Growth Rate
5.8%
Value in USD Billion
2026-2035
Read more about this report - REQUEST FREE SAMPLE COPY IN PDF
BAE Systems provided next generation polar satellites for the United States Space Force, enhancing the capacity to use space-based systems for surveillance and defense sensing operations. Businesses could leverage such developments in the military sensors market through investments in advanced sensor systems that enable secure surveillance, tracking, and multi-domain defense intelligence gathering.
Saab released the new Sirius Compact R-ESM solution for fixed defense systems, ensuring better intelligence collection, detection efficiency, and electronic support measures. Companies can gain from such developments by creating compact sensors for gathering intelligence through electronic warfare.
A germanium-free EO/IR sensor led to higher efficiency in infrared detection while decreasing reliance on expensive specialty material for use in the defense industry. Therefore, lucrative business opportunities lie in the development of alternative materials for sensors which result in cheaper production costs and greater supply security.
United States Army tested vehicle sensors developed by startups to enhance the situational awareness, navigation accuracy, and self-defense platforms capabilities. Companies in the military sensors market can leverage this development as an opportunity to create advanced sensors for military vehicles.
Demand in the military sensors market is on the rise as defense departments upgrade their intelligence, surveillance, and reconnaissance capabilities through all military platforms including ground, naval, aerial, and outer-space vehicles. Modernization initiatives among various armed forces are leading to increased demand for advanced EO/IR sensors, radar systems, and signal detectors, which can facilitate synchronized battlefield operations. For instance, in May 2026, DZYNE launched BLITZ UAV, enabling affordable autonomous swarm deployment, modular adaptability, rapid missions, and scalable defense operations.
Due to the rise of UAVs in the battlefields, demand for military sensors that can detect drones is growing rapidly. Military organizations are adopting counter-drone technology by integrating radars, radio frequency, thermal, and optical systems in order to enhance interception rates. The military sensors market observes increased installation of C-UAS infrastructure at military bases and airports. Several European military projects are intensifying procurement activities for drone countermeasures following concerns over rising deployment of UAVs in war zones. Aligning with this trend, in March 2026, L3Harris initiated high-volume VAMPIRE counter-unmanned systems production, strengthening drone defense, scalability, and battlefield protection capabilities.
The tensions in naval security are spurring investment in underwater detection systems such as sonar, acoustic arrays, and seabed sensors. The defense contractors are concentrating on anti-submarine warfare, maritime border information collection, and deep-water threat surveillance. Governments are increasing naval modernization investments to improve their knowledge in the underwater domain, boosting the military sensors market expansion. The consistent budgetary spending by the United States Navy on advanced sonar and submarine surveillance is creating opportunities for the development of acoustic sensors. Sensor companies are prioritizing pressure-resistant structures, long-range underwater communications, and improved noise discrimination. For example, in October 2025, Fincantieri launched its first DEEP underwater drone system, strengthening seabed security, surveillance, autonomy, and defense infrastructure protection.
Advanced military sensors are featuring satellite-enabled missile launch warnings, infrared surveillance, and electronic intelligence. Governments around the world are supporting persistent space sensing systems for hypersonic and hostile launch detection and surveillance. The market is also witnessing changes in the objectives of United States Space Development Agency and missile defense-related projects towards satellite layers for real-time warning infrastructure. Manufacturers are being encouraged to produce lightweight infrared detectors, radiation-tolerant semiconductor sensors, and reliable thermal imaging sensors, widening the military sensors market scope. For instance, Boeing increased missile-tracking sensor production for military satellites, strengthening space defense surveillance and threat detection, in February 2026.
AI is transforming the military sensors market dynamics by enabling automatic processing of information gathered from radar, acoustic, optical, and electromagnetic waves. Militaries are increasingly focusing on predictive sensors that can rapidly detect, identify, and analyze anomalies, thereby improving threat assessment and response efficiency across defense operations. Countries are incorporating AI into their efforts to modernize battlefield electronics technology. This trend can be seen in the growing focus on AI-powered sensors within various initiatives for innovation in defense technologies and AI incorporation in militaries. For example, in September 2025, Leonardo DRS launched AI-enabled rugged smart displays, improving battlefield awareness, sensor integration, and mission-critical defense operations.
Read more about this report - REQUEST FREE SAMPLE COPY IN PDF
The Expert Market Research's report titled “Global Military Sensors Market Report and Forecast 2026-2035” offers a detailed analysis of the market based on the following segments:
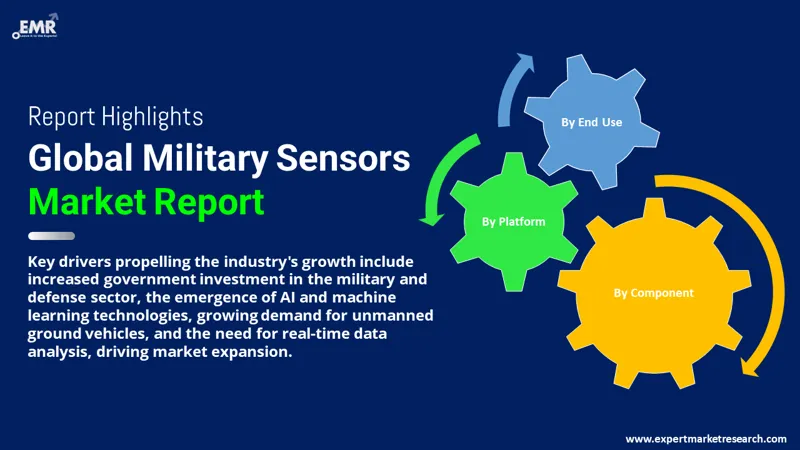
Market Breakup by Component
Key Insight: Hardware components continue to form the core of the military sensors market owing to the fact that sensing hardware forms the base for detection, tracking, and environment monitoring within combat platforms. There is a fast-growing demand for software components due to the move towards automation, visualization on the battlefield, and fusion of multiple sensors into one platform. Cybersecurity technology also becomes strategic for the sector since sensor networks become vulnerable to eavesdropping, jamming, spoofing, and cyberattacks. Aligning with a similar trend, in August 2025, AeroVironment expanded drone software with autonomy and RF sensing tools, improving threat detection and mission intelligence.
Market Breakup by Platform
Key Insight: The demand for airborne technology remains high due to the need to rapidly detect, navigate, and target aerial objects from various platforms such as fighter jets, helicopters, utility aircraft, and UAVs. In May 2026, GA-ASI completed its first MQ-9B flight with AEW pods, strengthening airborne surveillance, radar sensing, and defense intelligence. On the other hand, the land platform continues to dominate the military sensors market in terms of operational size, including all types of vehicles, personnel, and fixed installations that are used during a military operation. Marine technologies continue to be important as combat ships, submarines, naval fleets, and unmanned marine systems rely on sensors like sonar and acoustic sensors.
Market Breakup by End Use
Key Insight: As per the military sensors market report, both intelligence and reconnaissance are important since all military decisions are based on accurate situational awareness. Sensors for communication and navigation must stabilize positioning and connectivity, as well as route coordination. On the other hand, sensors for combat must ensure precise targeting and provide feedback on the survivability of military vehicles. Electronic warfare is becoming more common as electromagnetic threats are being detected and the use of electronic spectrums is becoming more regulated. Applications for target recognition are increasing as a result of the necessity to enhance autonomous system classification capacity. Applications for surveillance and monitoring provide perimeter and constant surveillance. Artillery applications demand sensors embedded in artillery systems for precise targeting.
Market Breakup by Region
Key Insight: North America accounts for the major share of the military sensors market value through advanced military equipment manufacturing and effective integration of sensor technology. Europe retains importance due to borderless defense projects, aerospace advancements, and investment in electronic warfare. The market in Asia Pacific is advancing through the modernization of their naval, air, and ground defense systems. Latin America offers new opportunities due to a growing interest in border control, tactical surveillance, and infrastructure protection. The Middle East and Africa markets keep expanding through defense preparedness, perimeter security, and ruggedized sensors. While each region exhibits unique procurement needs, they are all increasingly influenced by secure sensing architecture, interoperable military systems, unmanned combat vehicles, and adaptive battlefield intelligence platforms.
Read more about this report - REQUEST FREE SAMPLE COPY IN PDF
By component, the hardware category accounts for the largest share of the market due to rugged battlefield integration
Hardware components play a major role in the military sensors market due to their indispensability in the physical sense in most defense technologies. Infrared detectors, radar systems, acoustic sensors, pressure sensors, gyroscopes, and electro-optics, among other hardware forms, are being embedded in missiles, naval, UAVs, and tanks. Military contractors are increasingly focusing on the development of rugged hardware which is vibration-resistant and capable of operating in high temperatures and electromagnetic conditions.
The software segment observes rapid growth in the military sensors market as militaries increasingly require analytics on-the-go provided by the denser sensor network. Software solutions that utilize artificial intelligence for processing signals and target identification are expected to play a key role in extracting maximum value from sensor data. Military contractors are creating adaptive systems incorporating data from radar systems, thermal, and communication equipment into single dashboard systems. In August 2025, Q-CTRL was selected by DARPA to develop next-generation quantum sensors for resilient navigation on advanced defense platforms.
By platform, the land category registers notable growth due to wide deployment diversity
The land domain is becoming increasingly crucial in the military sensors market because of the extensive use of military sensors within ground armored vehicles, combat support vehicles, unmanned ground vehicles, operational bases, and soldier-borne equipment. The areas of border monitoring, terrain monitoring, motion monitoring, communication on battlefields, and tactical reconnaissance require sensor layers based in land domains. Military contractors are emphasizing vibration-resistant radars, infrared cameras, seismic sensors, and portable sensor modules. In March 2026, Mission Sudarshan Chakra strengthened India-Israel defense ties, advancing missile defense, surveillance integration, and strategic security cooperation.
The space domain is expanding rapidly due to growing military reliance on orbital capabilities for surveillance, missile detection, and early identification of strategic threats. In space, military sensor manufacturers are developing radiation-hardened infrared detectors, radiation-resilient optical systems, and imaging modules to be used on satellites. Space-based sensing systems can provide persistent monitoring beyond terrestrial limitations, making them essential components of early-warning and defense architectures. For example, in May 2026, Rocket Lab secured a USD 90 million Space Force contract for GEO satellites, strengthening missile-tracking and space surveillance.
By end use, the intelligence and reconnaissance category leads the market growth due to persistent battlefield visibility needs
The intelligence and reconnaissance end use domains largely contribute to the military sensors market revenue due to the current trend toward defense planning based on reliable identification and environmental monitoring of any threats. In the military sector, sensors are being extensively deployed to conduct terrain mapping, target tracking, and movement analysis, as well as to coordinate ISR activities. Electro-optical, radar, infrared, and acoustic sensors provide long-range reconnaissance services. For example, in May 2026, Helsing and OHB formed a space-based reconnaissance venture, advancing AI-driven surveillance, targeting, and military intelligence systems.
The increasing popularity of electronic warfare is driven by the rising number of signal disruption, jamming, and electromagnetic threats. Military sensors must be able to detect, monitor, and analyze signals from an enemy as well as classify these emissions and deploy appropriate countermeasures. Moreover, in order to operate under complex conditions, electronic warfare requires prompt responses from sensors. In May 2026, Bharat Electronics Limited (BEL) announced that the company is preparing to enter India’s growing loitering munition market with an indigenous strike UAV, increasing competition for private defense firms in the sector.


Read more about this report - REQUEST FREE SAMPLE COPY IN PDF
North America clocks in the leading position of the market due to advanced defense electronics manufacturing
North America’s dominance in the global military sensors market is powered by the presence of established defense suppliers, superior aerospace capabilities, and battlefield electronics integration. The region provides significant opportunities for development in technologies such as radars, infrared sensors, autonomous sensors, and missile-based detection systems. Interoperability and advanced sensor fusion are key priorities in military procurement across this region, while semiconductor development further strengthens defense manufacturing capabilities and supports next-generation military technologies. In April 2026, Northrop Grumman delivered next-gen polar infrared sensors, strengthening missile warning, tracking accuracy, and Arctic threat detection.
The Asia Pacific region is experiencing fast growth in the military sensors market as a result of increased defense modernization efforts in the areas of air defense, naval tracking, border security, and unmanned systems. The countries in this region are undertaking investments in their ISR capabilities, antisubmarine warfare capabilities, and drone-based sensors. For example, in May 2026, China developed GPS-free submarine navigation technology, improving stealth operations, positioning accuracy, and resilience against tracking.
The market remains intensely competitive as defense contractors seek to optimize precision sensing in compact sizes while ensuring greater survivability and multi-domain functionality. Some of the leading military sensors market players are focusing on AI-powered sensor fusion, sensors that can withstand high levels of radiation, embedded cybersecurity features, and lightweight electro-optic sensors. There is currently a trend towards developing modular sensors that could be updated without having to redesign entire systems, thus creating possibilities in the aftermarket segment.
Other technologies that military sensor companies are investing in include radio-frequency detection, thermal imaging, acoustic intelligence gathering, and unmanned sensing systems. One way through which firms in the avionics, semiconductor and defense industries can capitalize on the market includes strategic partnerships aimed at enhancing system interoperability across airborne, maritime, ground, and space domains. Edge processing sensors are other products that have significant potential for growth since they help in decreasing latency in combat situations.
Founded in 1906, is located in Charlotte, North Carolina, United States, Honeywell International Inc. provides services to the military sensors market using inertial navigation sensors, avionics electronics, and rugged aerospace sensors. Honeywell International Inc. focuses on lightweight embedded solutions, environmental sensors, and high navigation precision for survivability, missiles, and communication of defense systems.
Founded in 1941 and based in Switzerland, TE Connectivity Ltd. offers equipment such as harsh environment connectors, pressure sensors, miniaturized electronics, and high-signal reliability systems for defense manufacturers' needs.
Raytheon Technologies Corporation was founded in 1922 and operates from its headquarters in Arlington, Virginia, United States. The company focuses on the enhancement of military sensors' deployment through radar intelligence, missile-sensor capabilities, electro-optic tracking, and RF-based defense electronics.
Founded in 1995, Lockheed Martin Corporation is a company based in Bethesda, Maryland, United States. The company serves the market through infrared tracking sensors, missile defense sensors, space-based detection sensors, and autonomous battlefield sensors.
Other key players in the market include Thales Group, Kongsberg Gruppen ASA, Ultra Electronics, Esterline Technologies Corporation, General Electric Company, BAE Systems PLC, Microflown Avisa B.V., and Vectornav Technologies, LLC, among others.
*Please note that this is only a partial list; the complete list of key players is available in the full report. Additionally, the list of key players can be customized to better suit your needs.*
Unlock the latest insights with our military sensors market trends 2026 report. Discover regional growth patterns, consumer preferences, and key industry players. Stay ahead of competition with trusted data and expert analysis. Download your free sample report today and drive informed decisions in the market.
Upto 15% Off
USD
$2499 $2249
$3999 $3599
$4999 $4249
$5999 $5099


*While we strive to always give you current and accurate information, the numbers depicted on the website are indicative and may differ from the actual numbers in the main report. At Expert Market Research, we aim to bring you the latest insights and trends in the market. Using our analyses and forecasts, stakeholders can understand the market dynamics, navigate challenges, and capitalize on opportunities to make data-driven strategic decisions.*
In 2025, the global military sensors market attained a value of nearly USD 12.65 Billion.
The market is projected to grow at a CAGR of 5.80% between 2026 and 2035.
The key trends guiding the growth of the market include the growing investments in the military and defence sector by various governments, the advent of AI and machine learning, the rising demand for unmanned ground vehicles, and the need for real-time data analysis.
The key trends guiding the growth of the market include the introduction of favourable government initiatives and technological advancements.
The major regions in the market are North America, Latin America, the Middle East and Africa, Europe, and the Asia Pacific.
Hardware, software, and cybersecurity solutions are the major components of military sensors.
Airborne, land, naval, space, and munitions are the significant platforms of military sensors considered in the market report.
The major end use segments of the product include intelligence and reconnaissance, communication and navigation, combat operations, electronic warfare, target recognition, surveillance and monitoring, artillery systems, and command and control.
The major players in the market are Honeywell International Inc, TE Connectivity Ltd., Raytheon Technologies Corporation, Lockheed Martin Corporation, Thales Group, Kongsberg Gruppen ASA, Ultra Electronics, Esterline Technologies Corporation, General Electric Company, BAE Systems PLC, Microflown Avisa B.V., and Vectornav Technologies, LLC, among others.
Explore our key highlights of the report and gain a concise overview of key findings, trends, and actionable insights that will empower your strategic decisions.
| REPORT FEATURES | DETAILS |
| Base Year | 2025 |
| Historical Period | 2019-2025 |
| Forecast Period | 2026-2035 |
| Scope of the Report |
Historical and Forecast Trends, Industry Drivers and Constraints, Historical and Forecast Market Analysis by Segment:
|
| Breakup by Component |
|
| Breakup by Platform |
|
| Breakup by End Use |
|
| Breakup by Region |
|
| Market Dynamics |
|
| Competitive Landscape |
|
| Companies Covered |
|
| Report Price and Purchase Option | Explore our purchase options that are best suited to your resources and industry needs. |
| Delivery Format | Delivered as an attached PDF and Excel through email, with an option of receiving an editable PPT, according to the purchase option. |
Datasheet
One User
USD 2,499
USD 2,249
tax inclusive*
Single User License
One User
USD 3,999
USD 3,599
tax inclusive*
Five User License
Five User
USD 4,999
USD 4,249
tax inclusive*
Corporate License
Unlimited Users
USD 5,999
USD 5,099
tax inclusive*
*Please note that the prices mentioned below are starting prices for each bundle type. Kindly contact our team for further details.*
Flash Bundle
Small Business Bundle
Growth Bundle
Enterprise Bundle
*Please note that the prices mentioned below are starting prices for each bundle type. Kindly contact our team for further details.*
Flash Bundle
Number of Reports: 3
20%
tax inclusive*
Small Business Bundle
Number of Reports: 5
25%
tax inclusive*
Growth Bundle
Number of Reports: 8
30%
tax inclusive*
Enterprise Bundle
Number of Reports: 10
35%
tax inclusive*
How To Order

Select License Type
Choose the right license for your needs and access rights.

Click on ‘Buy Now’
Add the report to your cart with one click and proceed to register.

Select Mode of Payment
Choose a payment option for a secure checkout. You will be redirected accordingly.
Strategic Solutions for Informed Decision-Making
Gain insights to stay ahead and seize opportunities.

Get insights & trends for a competitive edge.

Track prices with detailed trend reports.

Analyse trade data for supply chain insights.

Leverage cost reports for smart savings

Enhance supply chain with partnerships.

Connect For More Information
Our expert team of analysts will offer full support and resolve any queries regarding the report, before and after the purchase.
Our expert team of analysts will offer full support and resolve any queries regarding the report, before and after the purchase.
We employ meticulous research methods, blending advanced analytics and expert insights to deliver accurate, actionable industry intelligence, staying ahead of competitors.
Our skilled analysts offer unparalleled competitive advantage with detailed insights on current and emerging markets, ensuring your strategic edge.
We offer an in-depth yet simplified presentation of industry insights and analysis to meet your specific requirements effectively.


