

Consumer Insights
Uncover trends and behaviors shaping consumer choices today
Procurement Insights
Optimize your sourcing strategy with key market data
Industry Stats
Stay ahead with the latest trends and market analysis.
The global monosodium glutamate market was valued at USD 6.14 Billion in 2025. The market is expected to grow at a CAGR of 4.00% during the forecast period of 2026-2035 to reach a value of USD 9.09 Billion by 2035. The market is witnessing a shift toward the preparation of healthy food and clean labels, which is spurring product innovation as companies struggle to reconcile the need to lower sodium content in their products with taste profiles.
The monosodium glutamate market is witnessing a surge in demand for convenient and processed foods globally, as more consumers demand ready-to-eat meals and snacks, as well as foods with added flavors. In response to this demand, manufacturers are boosting production and building stronger regional supply chains, which guarantee high quality and supply. In addition, there has been ongoing innovation in amino acid complex salts, such as L-lysine-L-glutamate and L-arginine-L-aspartate salts, which improve solubility while decreasing odor and nutritional value. These functional developments enable the use of MSG in fortified and health-conscious meals, thereby expanding its use and stimulating the growth of new and established markets.
Food manufacturers are also redeveloping items such as snacks, soups, and sauces to contain less salt, and MSG, which contains roughly one-third the amount of sodium as table salt, is an effective ingredient for increasing taste intensity while also assisting in meeting regulatory and customer health goals. This expanded industry profile is influenced by an increased interest in umami as a pleasant flavor profile, as well as scientific confirmation of MSG's contribution to palatability and lack of negative health consequences, which are driving its increased consumption food products. In this respect, key market participants in the monosodium glutamate market are introducing new solution platforms that incorporate flavor enhancement with health-driven needs. In June 2025, Ajinomoto Health & Nutrition North America, Inc. launched its Salt Answer and Palate Perfect platforms to enable manufacturers to reduce sodium by up to 30% without decreasing taste in major categories.
Compound Annual Growth Rate
4%
Value in USD Billion
2026-2035
Read more about this report - REQUEST FREE SAMPLE COPY IN PDF
| Global Monosodium Glutamate Market Report Summary | Description | Value |
| Base Year | USD Billion | 2025 |
| Historical Period | USD Billion | 2019-2025 |
| Forecast Period | USD Billion | 2026-2035 |
| Market Size 2025 | USD Billion | 6.14 |
| Market Size 2035 | USD Billion | 9.09 |
| CAGR 2019-2025 | Percentage | XX% |
| CAGR 2026-2035 | Percentage | 4.00% |
| CAGR 2026-2035 - Market by Region | Asia Pacific | 5.2% |
| CAGR 2026-2035 - Market by Country | India | 5.9% |
| CAGR 2026-2035 - Market by Country | China | 5.0% |
| CAGR 2026-2035 - Market by Application | Noodles, Soup, and Broth | 4.4% |
| CAGR 2026-2035 - Market by End Use | Food Processing Industries | 4.5% |
| Market Share by Country 2025 | Australia | 1.3% |
Ajinomoto CELLiST Korea introduced its CELLiST™ AAV Production Supplement 1, which increases gene therapy viral vector productivity. The move builds on the company’s innovation potential (based on more than a century of research on glutamate) and indirectly bolsters the demand for MSG-derived technologies and makes amino acid-based ingredient markets grow.
At the United Kingdom-based Honest Umami, four MSG-based flavor boosts, such as pure, chili, salt, and pepper, and 3-2-1 blends, were released by Honest Umami. Through the provision of accessible and convenient seasoning formats and encouraging transparency regarding MSG, the brand contributes to consumer education, triggering the growth in the monosodium glutamate market.
Ajinomoto Vietnam diversified its MSG capabilities into healthcare and medical food products such as low-sugar herbal teas fortified with glycine. Such developments help boost the demand growth of monosodium glutamate and amino acid ingredients, as well as improve consumer health through AminoScience applied to nutrition and wellness.
United Kingdom–based startup Honest Umami launched a small-batch MSG seasoning called “Sprout Mix,” combining smoked sea salt, pepper, garlic, and fermented MSG to enhance the natural flavor of Brussels sprouts. The brand contributes to the normalization of the use of MSG by producing products of seasoning that are convenient and easy to use and increases the demand in the market.
The monosodium glutamate market is expanding fast around the world due to increased consumption of processed foods, ready-to-eat foods, and convenience items. The manufacturers are upscaling production capacities to facilitate reliable supply, optimize cost efficiencies, and cater to new high-potential markets in the Asia-Pacific, Latin American, and African regions. The expansion activities also enhance integration of raw materials and the geographical distribution chains. In April 2025, Fufeng Group Limited declared plans to build an USD 800 million corn processing and fermentation plant in the Zhambyl region in Kazakhstan to increase output and supply of MSG in the long run.
Ongoing development of amino acid complex salts, L-lysine-L-glutamate, L-lysine-L-aspartate, and L-arginine-L-aspartate, which improve the functional and nutritional value of the food products is expanding the monosodium glutamate market scope. These salts enhance solubility, minimize odor, and enhance bioavailability of amino acids and are therefore, suitable in the process of flavor enhancement and fortification. These innovations promote the greater use of MSG-based ingredients in processed food and functional nutrition, which has presented new developmental opportunities to manufacturers. For instance, in September 2025, Sanxia Proudin launched three amino acid complex salts for nutrition and food applications.
The current trend in the monosodium glutamate market is product innovation by manufacturers as a way of normalizing product consumption and emphasizing the health and flavor advantages of the ingredient. With the launch of easy, universal, culturally appropriate MSG-based seasonings, organizations not only educate the consumer, but they also counter misinformation and increase household penetration. In March 2025, Asian women-owned brand DIME first introduced its own line of everyday MSG-based MSG seasonings in the United States, encouraging the use of umami-enhancing cooking or cooking without cultural stigma. This innovation spurs experimentation and brand faith in competitive markets.
The continued scientific studies are pointing out the extra benefits of MSG as an ingredient in addition to flavor enhancement, especially in the palatability of specialized diets, which is helping to boost the overall monosodium glutamate market penetration. Proving the safety and functional advantages of MSG, researchers lessen the number of misconceptions and promote its use by manufacturers and health-aware consumers. There is additional evidence that MSG lowers salt and enhances nutrition. In May 2025, scholars at the University of Alberta researched the ability of MSG to improve the flavor of foods for people with swallowing problems and discovered that it is applicable to such patients.
Monosodium glutamate producers are expanding the ingredient application outside traditional food products, focusing on functional meals, drinks, and animal nutrition. This strategic diversification enables firms to expand their revenue sources while improving product utility and acceptance. These initiatives, which rely on research and development, help with both market penetration and the creation of value-added solutions for end customers. For example, Eppen Biotech provides a feed-grade MSG version that improves feed efficiency in aquaculture and poultry trials.
Read more about this report - REQUEST FREE SAMPLE COPY IN PDF
The EMR’s report titled “Global Monosodium Glutamate Market Report and Forecast 2026-2035” offers a detailed analysis of the market based on the following segments:
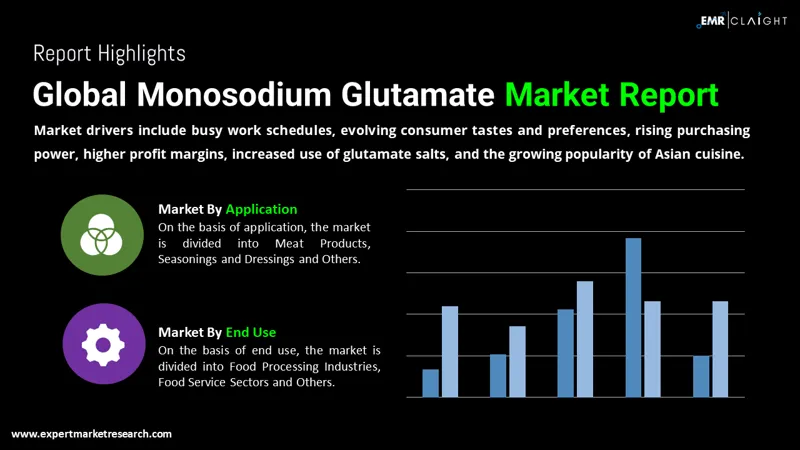
Market Breakup by Application
Key Insight: In terms of applications, the monosodium glutamate market scope covers noodles, soup and broth, meat products, seasonings and dressing, and other foods. The increasing demand for convenient, flavored, and ready-to-cook products is growing in all segments. Companies like Ajinomoto Co., Inc. are innovating MSG-added soups and broths, while Fufeng Group Limited is enhancing the flavor of meat products, and Corbion N.V. is working on seasoning blends and functional fortification. Product innovations in the noodles, ready meals, and seasoning categories are gaining more momentum, which promotes wider market penetration and improves taste and nutritional value for global consumers.
Market Breakup by End-use
Key Insight: The monosodium glutamate market caters to the surging demand across food processing industries and food service industries, as well as other end-use applications. Food processors use it in sauces, pre-prepared meals, and ready-to-eat food with consistency of flavor and quality in restaurants and catering services. Companies such as McCormick and Company offer bulk MSG solutions to industrial clients, while Kikkoman Corporation collaborates with hospitality and foodservice chains, and Ajinomoto Co., Inc. specializes in seasoning solutions. Awareness programs on the safety and flavor-enhancing aspects of MSG are also contributing to its adoption in commercial and retail markets.
Market Breakup by Region
Key Insight: Regionally, the monosodium glutamate market landscape covers North America, Europe, Asia Pacific, Latin America, the Middle East, and Africa. North America is expanding its global market share through product innovation and clean labels that are being spearheaded by Ajinomoto North America. Europe focuses on natural flavorings, where Kerry Group has launched functional flavorings. The largest consumer has been represented by the Asia Pacific, whose production is sustained by the Fufeng Group Limited, which produces in large quantities. The growing consumption of processed foods in Latin America and MEA is being supported by investments in production capacity, regional distribution, and strategic partnerships by Meihua Holdings Group and Corbion N.V.
Read more about this report - REQUEST FREE SAMPLE COPY IN PDF
By application, noodles, soup, and broth show notable growth owing to rising demand for umami-rich flavor
In the noodles, soup, and broth applications, the monosodium glutamate market is witnessing booming growth due to the demand by consumers to have a richer taste and genuine umami flavor in convenience foods. MSG makes food taste seasonally balanced and enables food processors to establish culturally varied and ready-prepared products. It is also optimally suited to processed and instant foods due to its functional benefits, such as an improvement in flavor without the need to use too much sodium. This trend has been emphasized by the introduction of Old El Paso and Totino ramen noodles in March 2025 by General Mills, which reinforced the importance of MSG in improving noodles, soups, and broths.
The seasonings and dressings category accounts for considerable share of the monosodium glutamate market revenue due to consumer demand for convenient, tasty, and umami cuisine. Manufacturers are also coming up with products that are versatile in terms of serving various culinary preferences, and they add flavor and make meal preparation easy. New applications of MSG-based blends, egg seasonings, and wrap seasonings are facilitating an increase in consumption rates and repeat usage. For instance, in April 2025, Culley announced the launch of three new products, namely MSG, Egg Seasoning, and Wrap Seasoning, with an emphasis on the trend of a wider range of flavors to meet the changing needs of consumers.
By end-use, food processing sector has surged product demand owing to amino science innovation
In terms of end-use, the food processing industries contribute substantially to the monosodium glutamate market value, with the growing need for reliable and high-quality flavors to be used in processed foods, ready-to-eat meals, and frozen food. Firms like as Ajinomoto Thailand are developing AJI-NO-MOTO 0M and RosDee cubes, as well as long-simmered broth liquids, to achieve consistent taste on a large scale. Improved production efficiency, ecological operations, and amino acid-based supplements boost demand in this category. For instance, in September 2025, Ajinomoto Thailand announced plans to diversify its spice portfolios and Japanese-style frozen dinners to meet shifting consumer demands.
MSG is rapidly gaining acceptance in the food service industry to add flavor and simplify the cooking process for restaurants, cafeterias, and catering services, which is boosting the monosodium glutamate market expansion. Ajinomoto Co. (Thailand) Ltd., Fufeng Group Limited, and Kerry Group are among the key companies that offer MSG-containing spices to food service operators in an effort to deliver a consistent supply of umami-rich flavor and quick cooking time. Expanding consumer demand for tasteful, pre-cooked food supports the growth of the market and promotes menu innovation and operational efficiency to generate new markets, enabling suppliers in major and new food service markets.


Read more about this report - REQUEST FREE SAMPLE COPY IN PDF
By region, Asia Pacific dominates the market, supported by strengthened regulatory oversight that drives quality standards
Asia Pacific accounts for a significant share of the global monosodium glutamate market with increasing consumption which has raised concerns related to the food safety and quality of the product. To sustain consumer trust, manufacturers and distributors are investing in supply chain monitoring and testing, as well as regulatory compliance. These initiatives also promote innovation in proven MSG products, which help to support premium positioning and increase adoption in retail and foodservice outlets. In May 2025, Vietnam started to conduct nationwide inspections of food safety after finding that the collective kitchens contained adulterated Famimoto MSG, indicating that quality assurance and safe consumption are priorities in the region.
The North America monosodium glutamate market is growing at a rapid pace with the growing inclination of the consumer to tasty, convenient, and ready-to-consume foods. The major market contenders like Ajinomoto Co., Inc., Fufeng Group Limited, and Corbion N. V. are constantly updating their MSG-based seasonings, sauces, and culinary blends according to the various taste requirements. These plans also increase the flavor of foods and increase domestic penetration and brand loyalty. Increased product consciousness about the functionality of MSG is another factor that is favoring the incorporation of the ingredient in the retail and foodservice markets.
| CAGR 2026-2035 - Market by | Country |
| India | 5.9% |
| China | 5.0% |
| Brazil | 5.0% |
| Germany | 2.9% |
| Italy | 2.5% |
| USA | 2.4% |
| Canada | XX% |
| UK | XX% |
| France | XX% |
| Japan | XX% |
| Australia | XX% |
| Saudi Arabia | XX% |
| Mexico | XX% |
The major monosodium glutamate market players are increasing production and distribution channels in their regions to deal with increasing international demand. The consistent supply, cost-effectiveness, and availability of high-growth markets in Asia-Pacific, North America, and Europe due to the investment in sophisticated fermentation technologies, new manufacturing facilities, and optimal supply chains, respectively, ensure a general increase in the overall market.
Other monosodium glutamate companies are investing in innovation in order to add functionality and appeal to the consumer. Amino acid complex salt, flavor enhancers, and ready-to-use seasonings are developed to aid processed foods, sauces, and culinary uses. These programs promote MSG in noodles, soups, meat products, and spices, encourage acceptance of this technology in food service and retail marketplaces, and contribute to the long-term expansion of the industry.
Ajinomoto Co., Inc. is a company based in Tokyo, Japan, which was established in 1909, that focuses on food seasonings and nutrition solutions that are health-related. The company also utilizes its decades of experience in the field of Amino Science to create certain new product lines and to expand its operations into the sector of processed food, seasoning, and nutritional supplements in the international market.
Fufeng Group is a Chinese-based company established in 1999 and headquartered in Xinjiang. The firm deals in the production of monosodium glutamate, corn-based starch, and amino acids. The company aims at scaling production, optimizing fermentation technologies, and expanding domestic and international food markets.
MeiHua Holdings Group Co, established in 1995 and headquartered in Shandong, China, is a major player in the food additives sector, offering MSG, seasonings, and flavor enhancers. The company focuses on innovation, quality control, and efficiency of the supply chain to serve the domestic and export markets.
Shandong Qilu Biotechnology Group is a producer of amino acids, monosodium glutamate, and other biochemical products, headquartered in Shandong, China, and established in 1994. The company has consistently grown its products and international market presence with a focus on research-based innovation and top production methods of fermentation.
*Please note that this is only a partial list; the complete list of key players is available in the full report. Additionally, the list of key players can be customized to better suit your needs.*
Other key players in the global monosodium glutamate market include Vedant Int’l, among others.
Explore the latest trends shaping the global monosodium glutamate market 2026-2035 with our in-depth report. Gain strategic insights, future forecasts, and key market developments that can help you stay competitive. Download a free sample report or contact our team for customized consultation on global monosodium glutamate market trends 2026.
Upto 15% Off
USD
$2499 $2249
$3999 $3599
$4999 $4249
$5999 $5099


*While we strive to always give you current and accurate information, the numbers depicted on the website are indicative and may differ from the actual numbers in the main report. At Expert Market Research, we aim to bring you the latest insights and trends in the market. Using our analyses and forecasts, stakeholders can understand the market dynamics, navigate challenges, and capitalize on opportunities to make data-driven strategic decisions.*
The market is projected to grow at a CAGR of 4.00% between 2026 and 2035.
Key strategies driving the market include product innovation, expansion of production capacity, strategic partnerships, and targeting emerging high-growth regions.
The growing demand emanating from the food processing industry and the changing lifestyles of individuals are the key industry trends propelling the market's growth.
The major regions in the industry are North America, Latin America, the Middle East and Africa, Europe, and the Asia Pacific.
The major applications are noodles, soup, and broth, meat products, seasonings and dressings, among others.
The market finds its end-uses in the food processing industries and food service sectors, among others.
The key players in the market include Ajinomoto Co., Inc., Fufeng Group, MeiHua Holdings Group Co, Shandong Qilu Biotechnology Group, and Vedant Int’l, among others.
In 2025, the global monosodium glutamate market reached an approximate value of USD 6.14 Billion.
The market is estimated to witness a healthy growth in the forecast period of 2026-2035 to reach USD 9.09 Billion by 2035.
The major challenges that global monosodium glutamate market players face includes regulatory restrictions, health perception concerns, raw material price volatility, and intense competition.
Explore our key highlights of the report and gain a concise overview of key findings, trends, and actionable insights that will empower your strategic decisions.
| REPORT FEATURES | DETAILS |
| Base Year | 2025 |
| Historical Period | 2019-2025 |
| Forecast Period | 2026-2035 |
| Scope of the Report |
Historical and Forecast Trends, Industry Drivers and Constraints, Historical and Forecast Market Analysis by Segment:
|
| Breakup by Application |
|
| Breakup by End Use |
|
| Breakup by Region |
|
| Market Dynamics |
|
| Competitive Landscape |
|
| Companies Covered |
|
| Report Price and Purchase Option | Explore our purchase options that are best suited to your resources and industry needs. |
| Delivery Format | Delivered as an attached PDF and Excel through email, with an option of receiving an editable PPT, according to the purchase option. |
Datasheet
One User
USD 2,499
USD 2,249
tax inclusive*
Single User License
One User
USD 3,999
USD 3,599
tax inclusive*
Five User License
Five User
USD 4,999
USD 4,249
tax inclusive*
Corporate License
Unlimited Users
USD 5,999
USD 5,099
tax inclusive*
*Please note that the prices mentioned below are starting prices for each bundle type. Kindly contact our team for further details.*
Flash Bundle
Small Business Bundle
Growth Bundle
Enterprise Bundle
*Please note that the prices mentioned below are starting prices for each bundle type. Kindly contact our team for further details.*
Flash Bundle
Number of Reports: 3
20%
tax inclusive*
Small Business Bundle
Number of Reports: 5
25%
tax inclusive*
Growth Bundle
Number of Reports: 8
30%
tax inclusive*
Enterprise Bundle
Number of Reports: 10
35%
tax inclusive*
How To Order

Select License Type
Choose the right license for your needs and access rights.

Click on ‘Buy Now’
Add the report to your cart with one click and proceed to register.

Select Mode of Payment
Choose a payment option for a secure checkout. You will be redirected accordingly.
Strategic Solutions for Informed Decision-Making
Gain insights to stay ahead and seize opportunities.

Get insights & trends for a competitive edge.

Track prices with detailed trend reports.

Analyse trade data for supply chain insights.

Leverage cost reports for smart savings

Enhance supply chain with partnerships.

Connect For More Information
Our expert team of analysts will offer full support and resolve any queries regarding the report, before and after the purchase.
Our expert team of analysts will offer full support and resolve any queries regarding the report, before and after the purchase.
We employ meticulous research methods, blending advanced analytics and expert insights to deliver accurate, actionable industry intelligence, staying ahead of competitors.
Our skilled analysts offer unparalleled competitive advantage with detailed insights on current and emerging markets, ensuring your strategic edge.
We offer an in-depth yet simplified presentation of industry insights and analysis to meet your specific requirements effectively.


