

Consumer Insights
Uncover trends and behaviors shaping consumer choices today
Procurement Insights
Optimize your sourcing strategy with key market data
Industry Stats
Stay ahead with the latest trends and market analysis.
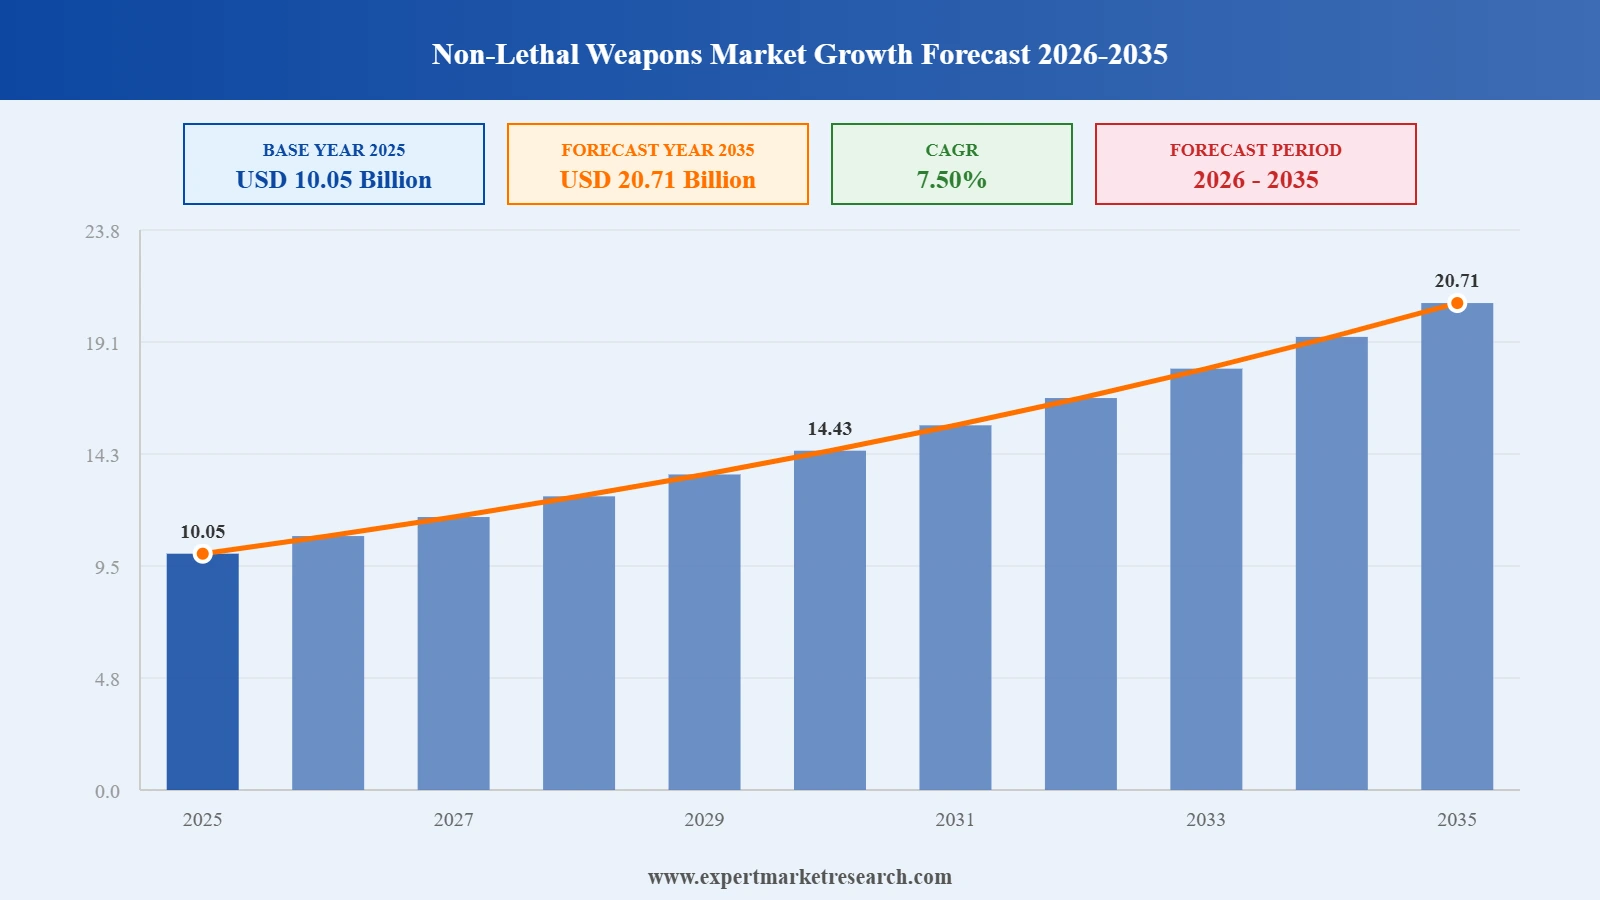
The global non-lethal weapons market value reached around USD 10.05 Billion in 2025. The increasing need for crowd control solutions amid rising civil unrest and protests worldwide has heightened the demand for non-lethal options. Law enforcement agencies are also increasingly adopting these weapons to reduce fatalities while maintaining public order. As a result, the industry is expected to grow at a CAGR of 7.50% during the forecast period of 2026-2035 to attain a value of USD 20.71 Billion by 2035. Additionally, advancements in non-lethal weapon technology, such as improved stun guns and chemical agents, make them more appealing for various applications. Regulatory pressures favouring humane policing tactics also encourage the adoption of non-lethal alternatives.
According to the ACLED Conflict Index, over 165,273 political violence events were recorded worldwide between July 2023 and June 2024, reflecting a 15% increase from the previous year and a staggering 64% increase since July 2020. This surge in violence underscores the urgent need for effective crowd control measures. As political unrest becomes more prevalent, law enforcement agencies are increasingly turning to non-lethal weapons to manage situations without escalating to lethal force, driving non-lethal weapons demand.
Industry reports indicate that the number of non-state conflicts rose from 76 in 2021 to 82 in 2022. This increase highlights a growing trend of localised violence and unrest, prompting law enforcement agencies and security forces to seek effective solutions for crowd management and conflict resolution. Non-lethal weapons, which can incapacitate individuals without causing permanent harm, are becoming essential tools for maintaining order in these volatile environments.
In 2023, about 97% of all political violence occurred in just 50 countries ranked as having extreme or high levels of conflict. This concentration indicates that specific regions are experiencing significant unrest, creating a targeted non-lethal weapons market. The countries experiencing the highest levels of conflict include Palestine, Myanmar, Syria, Mexico, Nigeria, Colombia, Brazil, Sudan, Cameroon, and Pakistan. As governments and law enforcement agencies in these countries seek to address civil unrest effectively while reducing casualties, the demand for advanced non-lethal weaponry is expected to grow significantly.
Read more about this report - REQUEST FREE SAMPLE COPY IN PDF
| Non-Lethal Weapons Market Report Summary | Description | Value |
| Base Year | USD Billion | 2025 |
| Historical Period | USD Billion | 2019-2025 |
| Forecast Period | USD Billion | 2026-2035 |
| Market Size 2025 | USD Billion | 10.05 |
| Market Size 2035 | USD Billion | 20.71 |
| CAGR 2019-2025 | Percentage | XX% |
| CAGR 2026-2035 | Percentage | 7.50% |
| CAGR 2026-2035 - Market by Region | Asia Pacific | 8.6% |
| CAGR 2026-2035 - Market by Country | China | 8.3% |
| CAGR 2026-2035 - Market by Country | Canada | 7.2% |
| CAGR 2026-2035 - Market by End User | Military | 8.4% |
| CAGR 2026-2035 - Market by Technology | Electromagnetic Non-Lethal Weapons | 8.5% |
| Market Share by Country 2025 | India | 3.8% |
Non-lethal weapons are described as weapons, devices, and munitions, that are explicitly devised and primarily employed to immediately weaken targeted material or people while minimising casualties and damage to property. Non-lethal weapons like pepper sprays, water weapons, tasers, and stun guns are becoming increasingly popular among law-enforcement agencies as a more humane alternative to firearms in riot control operations.
The growth of the non-lethal weapons market can be linked to the increasing global internal conflicts and political unrest. Countries such as the United States, France, and India have seen widespread protests triggered by changes in government policies, creating a need for law enforcement to manage crowds without resorting to lethal force. This has driven the demand for non-lethal weapons like tear gas, rubber bullets, and stun grenades, which are seen as effective in dispersing large groups while minimising fatalities.
For instance, during the 2024 protests in France over pension reforms, law enforcement heavily relied on tear gas and water cannons to disperse protestors. Similarly, in the United States, police departments used tasers and rubber bullets in response to civil unrest related to controversial legislative changes. These real-world examples underscore the increasing reliance on such tools to handle large crowds and maintain public order, resulting in increased non-lethal weapons market value. In addition to protest control, non-lethal weapons are becoming vital in military peacekeeping operations. In 2024, the United Nations’ peacekeeping forces used non-lethal weapons in conflict zones such as South Sudan and the Central African Republic.
Increased demand for crowd control, technological advancements in directed energy weapons, and growing use in military operations and peacekeeping are the key trends propelling the market growth.
HERO Defence Systems LLC partnered with MICHE Handbags to launch a new line of handbags with integrated non-lethal self-defense tools. This collaboration aims to enhance women safety. The handbags feature concealed compartments for HERO's award-winning devices, such as the AIIRO and HERO 2020, which use non-lethal methods to incapacitate potential threats without causing permanent harm.
Amid rising antisemitism and security concerns, Jewish communities in the U.S. are increasingly adopting the Byrna launcher, a non-lethal self-defense weapon to empower individuals and families during challenging times. This trend has accelerated the non-lethal weapons market demand.
Arcflash Labs launched GR-1 "Anvil", the world's first commercially available handheld railgun. This semi-automatic Gauss rifle can fire ferromagnetic projectiles at speeds exceeding 200 feet per second, making it a non-lethal weapon for law enforcement and security applications. Such introductions aids in non-lethal weapons market development.
The UC Board of Regents approved the allocation of three drones, 3,000 rounds of pepper bullets, and eight munition launchers to the UCLA Police Department for de-escalation, crowd control, and law enforcement purposes. This allocation aims to provide UCLA police with non-lethal alternatives to standard firearms, enabling them to manage situations effectively without resorting to deadly force.
Global civil unrest has been on the rise, with incidents of protests and riots increasing by 244% between 2011 and 2019, according to a report by the Armed Conflict Location & Event Data Project (ACLED). As a result, law enforcement agencies are investing heavily in non-lethal crowd control solutions, such as tear gas, rubber bullets, and water cannons to disperse crowds. Governments such as the United States and France have deployed rubber bullets, tear gas, and pepper spray in large-scale demonstrations. In 2020, the U.S. Department of Justice allocated USD 41 million towards acquiring non-lethal equipment for riot control in response to increased civil protests. This trend in the non-lethal weapons market has led to substantial investments in developing more advanced and less harmful crowd control weapons, such as stun grenades.
The non-lethal weapons sector is witnessing significant technological innovations, particularly in materials and delivery systems. New technologies such as directed energy weapons and advanced acoustic weapons are being developed to incapacitate targets without causing permanent harm. For instance, the High Energy Laser Mobile Demonstrator (HEL MD), showcased by the U.S. military in 2024, uses directed energy to disable drones and vehicles, providing a non-lethal option for countering aerial threats. The U.S. Department of Defense also invested in directed energy weapons (DEWs) as part of their non-lethal arsenal, allocating over USD 300 million in research and development funding for DEWs in 2021. The Active Denial System (ADS), a microwave-based weapon designed to disperse crowds by emitting a directed energy beam, has been successfully tested by the U.S. military and NATO forces. According to a 2022 report by the Congressional Research Service, DEWs are expected to reduce collateral damage in military operations significantly. The ADS, for example, has been deployed by U.S. forces in Afghanistan to prevent perimeter breaches, illustrating non-lethal weapons market expansion in real-world conflict scenarios.
There is an increasing reliance on non-lethal weapons by law enforcement agencies as part of evolving policing strategies that prioritize de-escalation and public safety. Tools such as tasers and pepper sprays are becoming standard equipment for police forces aiming to reduce fatalities during confrontations. In 2024, the Axon Body 3, equipped with a taser and body camera, has been adopted by numerous police departments to provide real-time data during encounters while ensuring accountability. This trend not only addresses public safety concerns but also helps mitigate backlash against police actions.
One key market opportunity lies in law enforcement's increasing focus on public safety amidst unrest. As per industry reports, civil unrest is increasing as 101 countries experienced an increase in unrest in just one quarter of 2022, largely due to inflation and economic pressure. Due to this, the need for effective non-lethal solutions is growing rapidly, leading to non-lethal weapons demand growth. In 2024, civil unrest and political violence witnessed a 15% increase globally. In response, the U.S. Department of Homeland Security allocated USD 45 million in 2024 for advanced non-lethal weapons to manage riot control. Moreover, in 2024, law enforcement used Less Lethal Munitions (LLM) like foam baton rounds and tear gas to disperse crowds while attempting to reduce serious injuries. This trend highlights the necessity for solutions that can effectively address public disturbances while respecting human rights.
Non-lethal weapons are increasingly used in international peacekeeping missions, with the United Nations peacekeeping forces incorporating them to maintain order while reducing civilian casualties. A report by the United Nations Institute for Disarmament Research (UNIDIR) notes that non-lethal weapons, such as rubber bullets and stun grenades, were used in over 50% of the missions between 2015 and 2020 to de-escalate situations without resorting to deadly force. As per non-lethal weapons market overview, the U.S. military has also seen a rise in the deployment of non-lethal weapons as it invested USD 100 million in 2020 to equip soldiers in conflict zones like Iraq and Syria. Non-lethal options like bean bag rounds, flash-bang grenades, and electric tasers are increasingly vital in urban warfare, where avoiding civilian casualties is a priority.
One significant restraint in the market is ethical and legal challenges tied to the product’s use. For instance, improper deployment of rubber bullets and tear gas has caused severe injuries and fatalities during protests. Amnesty International reported that between May and August 2020, during the U.S. Black Lives Matter protests, at least 115 people sustained serious eye injuries due to rubber bullets, raising public concerns about their safety and appropriateness in crowd control scenarios. Similarly, in Hong Kong, the improper use of tear gas in 2019 protests resulted in over 2,000 injuries, prompting international human rights organisations to call for stricter regulation, impacting the overall non-leather weapons demand forecast.
Additionally, the lack of standardised guidelines across countries exacerbates the challenge. A UN report highlighted that 60% of countries using non-lethal weapons lack sufficient regulatory frameworks, making it difficult to monitor and control their proper usage. Furthermore, public backlash and reputational damage to governments or agencies deploying such technologies can hinder broader market acceptance.
The flourishing research activities in manufacturing practices to incorporate advanced technologies in non-lethal weapons are augmenting the market growth. New technologies such as high-power microwave weapons capable of disabling unprotected electronic systems, advanced portable lasers for use against sensors, and directed energy munitions, among others, are being deployed by the military forces to blind sensors on unidentified aircrafts. Furthermore, advances in non-lethal technologies offer promising non-lethal weapons market opportunities to control rising conflicts in the world.
Non-lethal weapons are also increasingly being used to safeguard high-profile individuals, including film stars, political leaders, and other significant figures. These electrical devices encompass tasers, stun guns, stun batons, electrified sheets, and electrified nets, which are employed to manage crowds without endangering lives. Advanced technologies, such as laser interdiction systems and tasers featuring charge metering techniques that assess and regulate electric charges to incapacitate targets, are playing a crucial role in the expansion of this sector. Additionally, the involvement of market participants and supportive government initiatives, including financial investments, are propelling the growth of the non-lethal weapons market.
“Non-Lethal Weapons Market Report and Forecast 2026-2035” offers a detailed analysis of the market based on the following segments:
Market Breakup by End User
Market Breakup by Product Type
Market Breakup by Technology
Market Breakup by Region


Read more about this report - REQUEST FREE SAMPLE COPY IN PDF
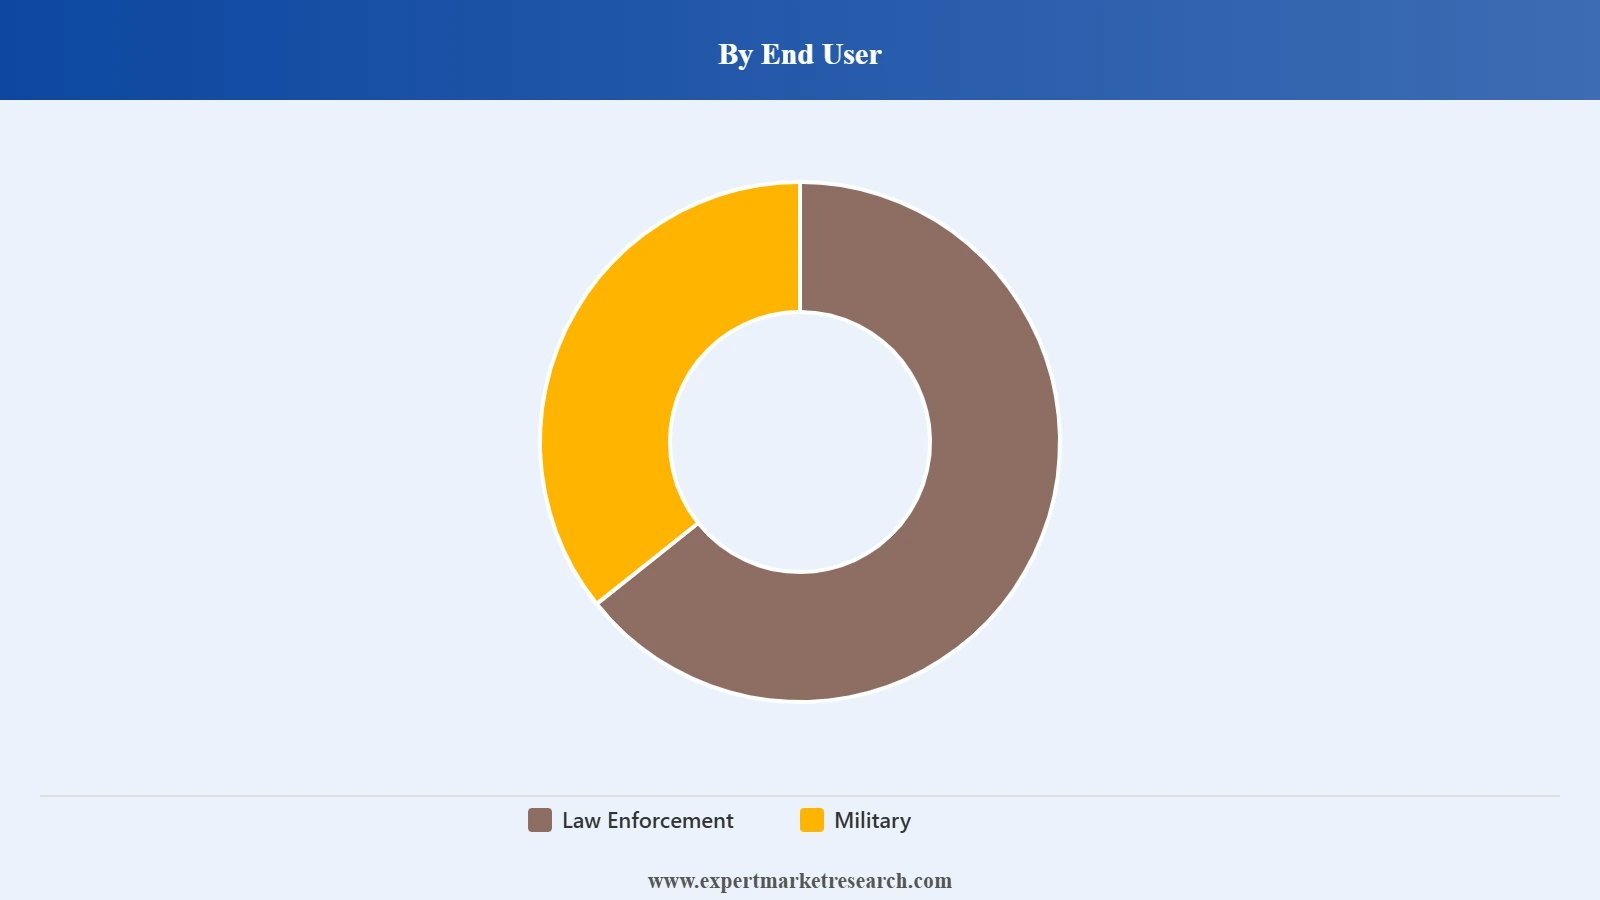
Market Insights by End User
Law enforcement agencies are one of the largest end-users of non-lethal weapons, driven by the increasing demand for crowd control and public safety tools. As civil unrest continues to rise globally, with more than 90% of Palestine population exposed to conflicts, police forces are turning to non-lethal alternatives like tasers, pepper spray, and rubber bullets to reduce fatalities while managing protests. For example, in 2024, the U.S. Department of Homeland Security allocated USD 45 million for advanced non-lethal weapons. Taser use by police is also widespread, with Axon Enterprise providing non-lethal options to over 18,000 law enforcement agencies globally.
Read more about this report - REQUEST FREE SAMPLE COPY IN PDF
As per the non-lethal weapons industry analysis, military adoption of non-lethal weapons is also growing, especially for peacekeeping and urban warfare. These technologies offer militaries the ability to neutralise threats without causing harm to human life, which is critical in operations involving civilian populations. In 2021, the U.S. Department of Defense (DoD) invested over USD 300 million in research and development for non-lethal directed energy weapons (DEWs). Additionally, NATO forces are deploying microwave-based Active Denial Systems (ADS) for perimeter defense and crowd dispersal, showcasing the shift toward non-lethal technologies for global military use.
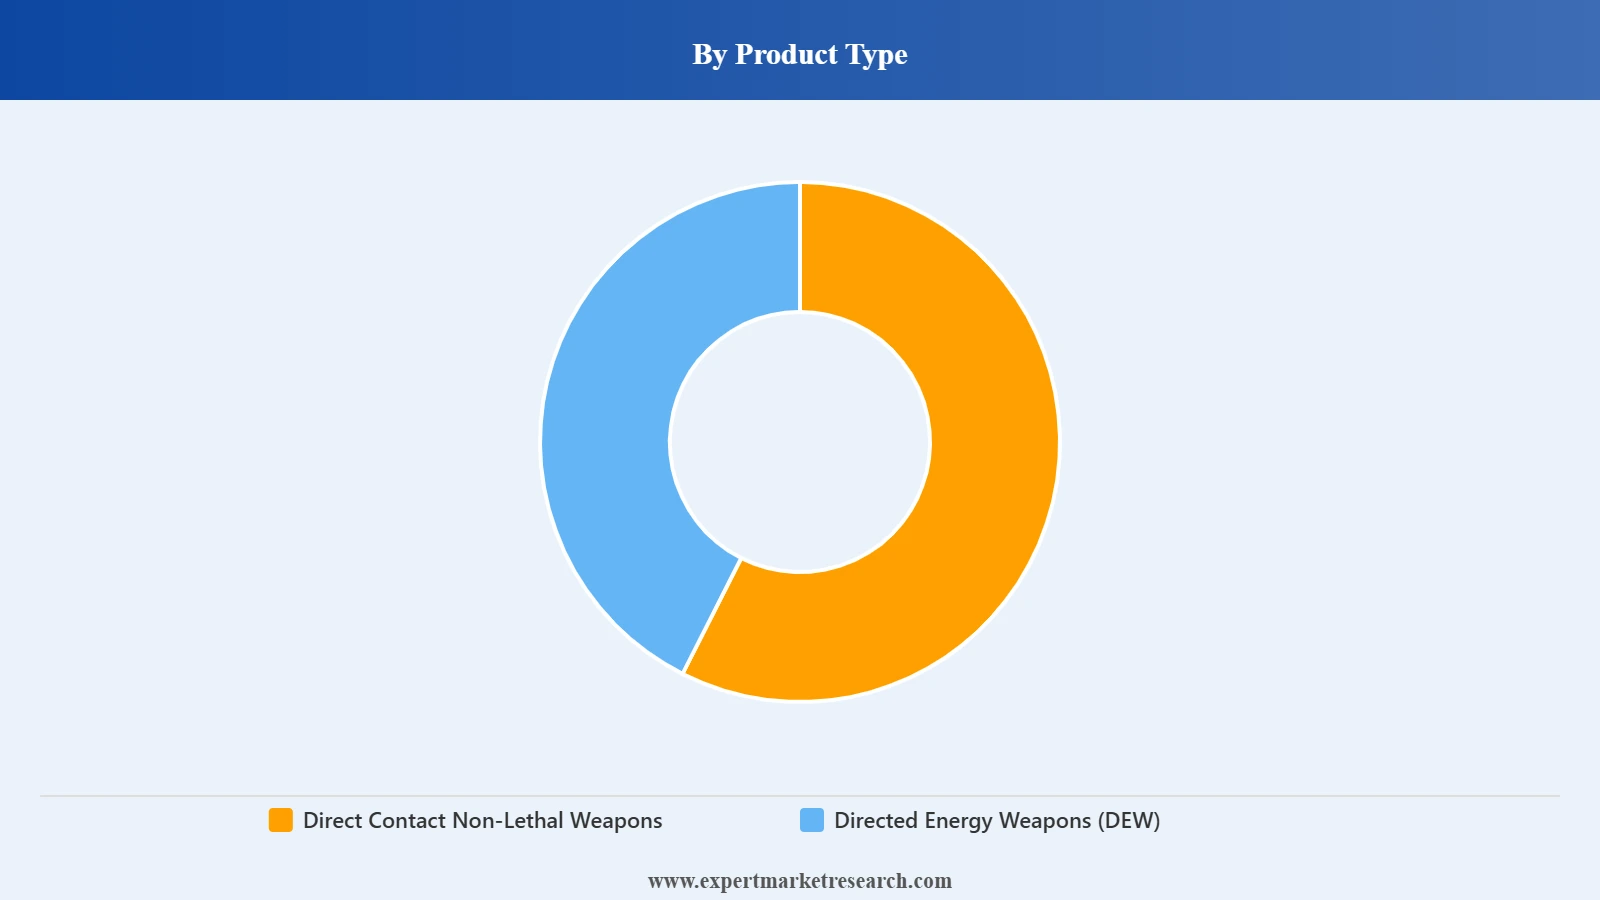
Market Insights by Product Type
Direct contact weapons such as tasers, rubber bullets, and stun guns remain integral to law enforcement and self-defense. In 2024, the use of tasers and stun guns continues to expand globally, with over 17,000 law enforcement agencies worldwide relying on these tools. Additionally, the U.S. Department of Homeland Security allocated USD 45 million in 2024 for non-lethal riot control technologies, further driving demand for direct contact weapons.
Read more about this report - REQUEST FREE SAMPLE COPY IN PDF
However, directed energy weapons (DEWs) are gaining a substantial non-lethal weapons market share due to use in military applications for non-lethal crowd control and electronic disruption. In 2024, the European Union allocated EUR 250 million to develop laser systems for counter-drone and missile defense. China also tested high-power lasers for space and cyber warfare and invested over USD 200 million in R&D. Similarly, India explored non-lethal DEWs for border security and funded USD 75 million in laser systems. NATO also expanded its use of the Active Denial System (ADS) for crowd control in conflict zones, demonstrating the growing confidence in non-lethal DEWs. Apart from defence applications, DEWs are being increasingly used in commercial sector for facility and VIP protection.
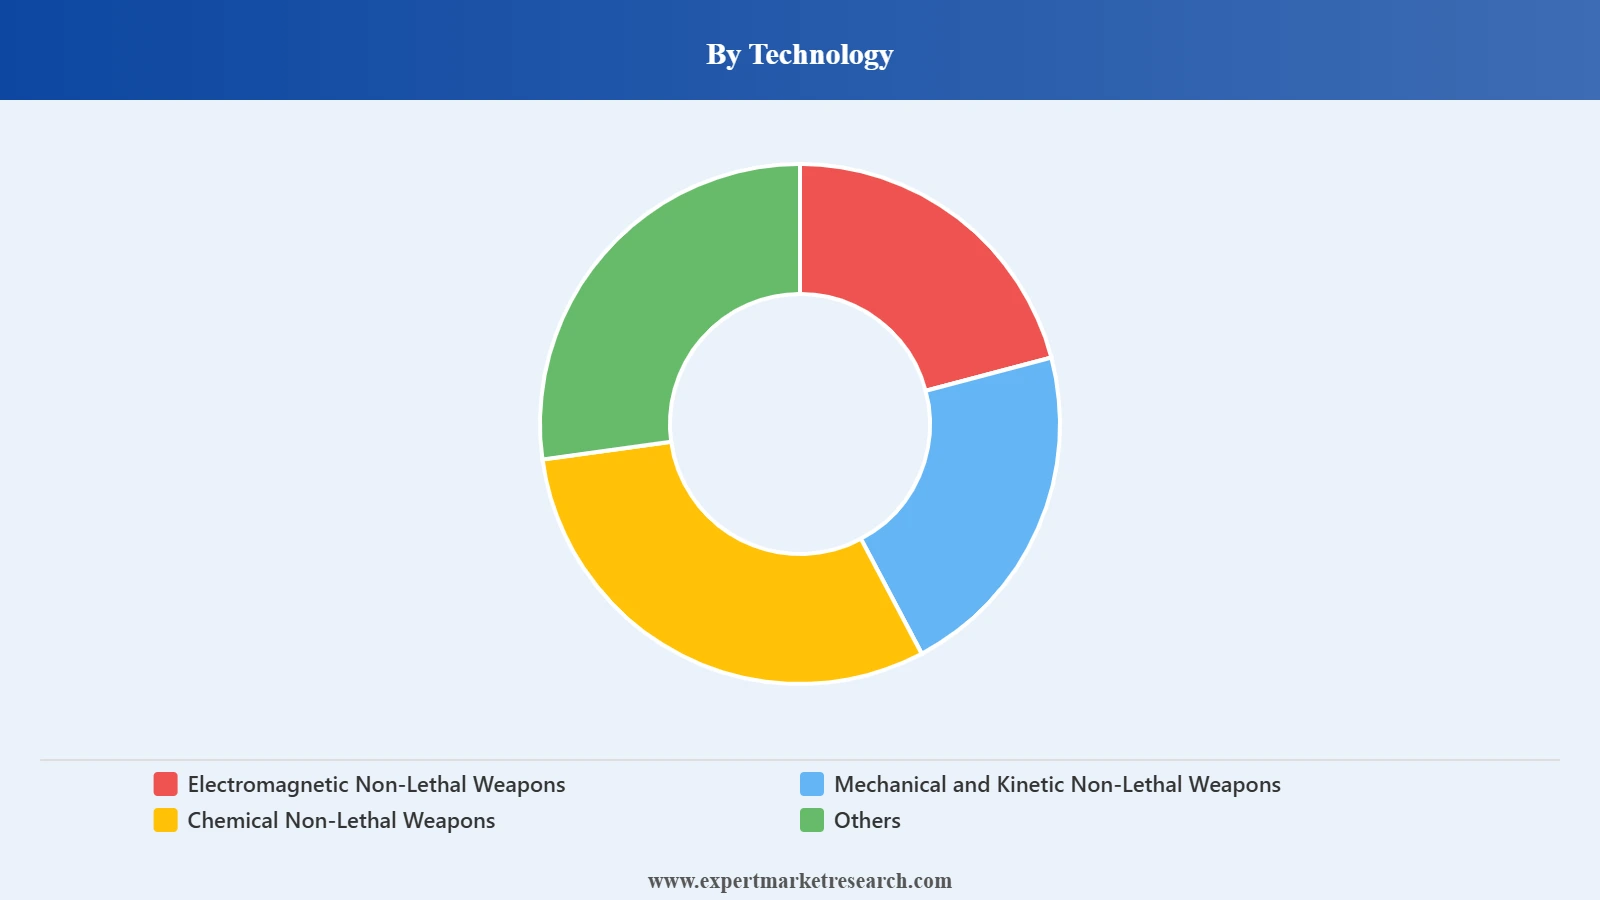
Market Insights by Technology
Electromagnetic weapons, such as Active Denial Systems (ADS), are becoming an essential part of non-lethal defense. These systems use directed energy to cause an intense burning sensation on the skin without causing permanent injury, making them ideal for crowd control. According to non-lethal weapons market analysis, the ADS has been deployed by both NATO and U.S. forces in conflict zones, showcasing its growing role in non-lethal military applications.
Read more about this report - REQUEST FREE SAMPLE COPY IN PDF
Mechanical and kinetic non-lethal weapons include rubber bullets, bean bag rounds, and batons. These weapons are widely used by law enforcement for crowd control and riot suppression. For example, rubber bullets were extensively deployed in the 2020 U.S. protests, and their use continues to rise in 2024 despite ongoing controversy over their potential to cause serious injury. The French police also expanded their non-lethal arsenal with advanced rubber bullet systems for riot control in 2024.
According to non-lethal weapons market report, chemical non-lethal weapons, such as tear gas and pepper spray, continue to be widely used across the globe for crowd control and personal defense. Despite concerns over their misuse, these weapons remain a popular choice for dispersing large groups due to their ability to quickly incapacitate targets without causing long-term harm. In 2024, several countries, including the U.S., increased their stock of tear gas and pepper spray for managing protests and civil unrest. The use of chemical weapons was also prominent in the 2019-2020 Hong Kong protests, where over 16,000 rounds of tear gas were deployed.
North America Non-Lethal Weapons Market Trends
North America dominates the market, primarily due to the significant demand from the United States' law enforcement and military sectors. In 2024, the U.S. Department of Homeland Security allocated USD 45 million specifically for non-lethal weapons, highlighting their application in crowd control and riot management. U.S. law enforcement agencies extensively use tasers, pepper spray, and rubber bullets, while the U.S. Department of Defense is making substantial investments in directed energy weapons (DEWs) for non-lethal purposes. Canada is also increasing its deployment of non-lethal weapons in law enforcement, particularly for managing protests and civil unrest.
Asia Pacific Non-Lethal Weapons Market Drivers
In the Asia Pacific region, there is a rising demand for non-lethal weapons, especially in countries such as India, China, and South Korea, which are grappling with internal security issues and significant public demonstrations. In India, non-lethal options like tear gas and rubber bullets are commonly employed for crowd control, particularly in regions such as Jammu and Kashmir. In 2024, India's defense forces began integrating non-lethal technologies inspired by local mythology for border patrols, signaling a move towards indigenous solutions. Meanwhile, China has focused on non-lethal technologies to uphold public order, particularly in managing protests and maintaining control in areas like Hong Kong.
Europe Non-Lethal Weapons Market Opportunities
Europe is experiencing a notable increase in the adoption of non-lethal weapons for law enforcement and peacekeeping operations, particularly as a response to escalating civil disturbances. Nations such as France and Germany are enhancing their deployment of rubber bullets and tear gas. In 2024, France modernised its non-lethal capabilities by introducing advanced rubber bullet systems aimed at riot management. Furthermore, NATO forces in Europe are incorporating directed energy weapons (DEWs) for crowd control during peacekeeping efforts. The emphasis on human rights within Europe has sparked ongoing discussions regarding the ethical implications of these technologies; however, they are deemed crucial for managing protests and averting further escalation.
Read more about this report - REQUEST FREE SAMPLE COPY IN PDF
Latin America Non-Lethal Weapons Market Growth
In Latin America, there is an increasing demand for non-lethal weapons, primarily driven by political turmoil and civil unrest in nations such as Brazil, Chile, and Venezuela. Law enforcement agencies in these countries routinely employ non-lethal options like tear gas, water cannons, and rubber bullets to handle large protests. In 2024, Brazil broadened its application of non-lethal technologies for public demonstration management, however, Chile has faced global scrutiny for its excessive use of rubber bullets due to cases of significant injuries. Despite, the concerns, the persistent political instability in the region continues to drive the need for more effective and safer crowd control measures.
Middle East and Africa Non-Lethal Weapons Market Dynamics
Nations such as Israel and Saudi Arabia are expanding the use of sophisticated non-lethal technologies for crowd management and urban conflict resolution. In 2024, Israel's military integrated the Active Denial System (ADS) into its strategies. Saudi Arabia invested over USD 50 million in the development of advanced non-lethal tools, including directed energy systems and tear gas alternatives, aimed at securing urban areas and controlling civil unrest. In South Africa, law enforcement relies on non-lethal measures such as rubber bullets and tear gas during economic protests. As per industry reports, country’s government spending on crowd control equipment reached USD 30 million in 2024.
Start-ups operating within the non-lethal weapons sector are concentrating on cutting-edge technologies that emphasise safety and efficacy while reducing long-term consequences. These enterprises are creating advanced weaponry equipped with integrated sensors and data analytics to ensure precise control and minimise collateral damage. Notable examples include companies developing drone-based non-lethal systems and directed energy weapons, such as high-intensity sound or electromagnetic devices intended for crowd management. Furthermore, there is an emphasis on producing less-lethal ammunition, including rubber bullets designed to incapacitate individuals without inflicting serious injuries. Notable start-ups that are working towards creating a positive non-lethal weapons market outlook are:
Axon Enterprise, founded in 1993 and headquartered in Arizona, United States, is renowned for its well-known Taser product line. While historically focused on law enforcement applications, Axon has recently broadened its reach into consumer markets with offerings such as the Taser Pulse. Axon's Taser products are used by more than 18,000 law enforcement agencies worldwide, making the company a leader in non-lethal weapons market landscape.
Byrna Technologies, established in 2018 and based in Massachusetts, United States, manufacturers non-lethal, CO2-powered handheld weapons. The company's flagship product, the Byrna HD, garnered significant attention during the civil unrest of 2020, resulting in a notable increase in sales. Byrna achieved USD 2 million in merchandise sales in a single evening following a prominent feature by Sean Hannity. The company targets the self-defense, crowd control, and law enforcement sectors, fostering a community of over 10,000 users.
The primary emphasis of market players in the non-lethal weapons sector is on innovation and technological progress to improve product effectiveness and safety. Companies such as Taser International are advancing the development of sophisticated electroshock devices, while AeroVironment is providing drones that carry non-lethal payloads for purposes of surveillance and crowd control. Furthermore, there is a significant focus on adhering to regulatory standards that promote humane practices in law enforcement. For example, FN Herstal offers less-lethal ammunition that complies with rigorous safety regulations. Other essential strategies include diversifying product offerings and forming partnerships with law enforcement agencies to cater to changing non-lethal weapons market dynamics and trends.
Axon Enterprise, Inc. was founded in 1993 and is headquartered in Arizona, United States. It is widely known for its TASER devices, which administer electric shocks to incapacitate individuals while avoiding permanent injury. It also provides body-worn cameras and a digital evidence management system known as Evidence.com to enhance accountability within law enforcement agencies.
Amtec Less Lethal Systems Inc. was founded in 1991 and is headquartered in Maryland, United States. It develops rubber projectiles and chemical agents intended for crowd control and tactical applications. It serves law enforcement agencies that seek effective non-lethal engagement options.
Genasys Inc. was founded in 2000 and is headquartered in California, United States. It focuses on mass notification systems and non-lethal communication technologies, including the LRAD (Long Range Acoustic Device), capable of delivering clear messages over extensive distances. Their solutions are used for emergency notifications and crowd management.
Combined Systems, Inc. was founded in 1981 and is headquartered in Pennysylvania, United States. It produces a wide array of less-lethal munitions, such as smoke grenades, tear gas, and impact munitions. Their offerings are extensively employed by military and law enforcement organisations for crowd control, riot management, and tactical operations.
*Please note that this is only a partial list; the complete list of key players is available in the full report. Additionally, the list of key players can be customized to better suit your needs.*
Other non-lethal weapons market players include Nonlethal Technologies, Inc, among others.
Upto 15% Off
USD
$2499 $2249
$3999 $3599
$4999 $4249
$5999 $5099


*While we strive to always give you current and accurate information, the numbers depicted on the website are indicative and may differ from the actual numbers in the main report. At Expert Market Research, we aim to bring you the latest insights and trends in the market. Using our analyses and forecasts, stakeholders can understand the market dynamics, navigate challenges, and capitalize on opportunities to make data-driven strategic decisions.*
In 2025, the market reached an approximate value of USD 10.05 Billion.
The market is assessed to grow at a CAGR of 7.50% between 2026 and 2035.
The market is estimated to witness healthy growth in the forecast period of 2026-2035 to reach a value of around USD 20.71 Billion by 2035.
The major drivers of the market include the rising deployment of non-lethal devices to control intra country disputes, growing civil unrest all over the world, and increasing investments in military equipment across regions.
Key trends aiding market expansion include the technical advancements in non-lethal weapons, growing use of the product in military applications, and increased demand for harmless crowd control solutions.
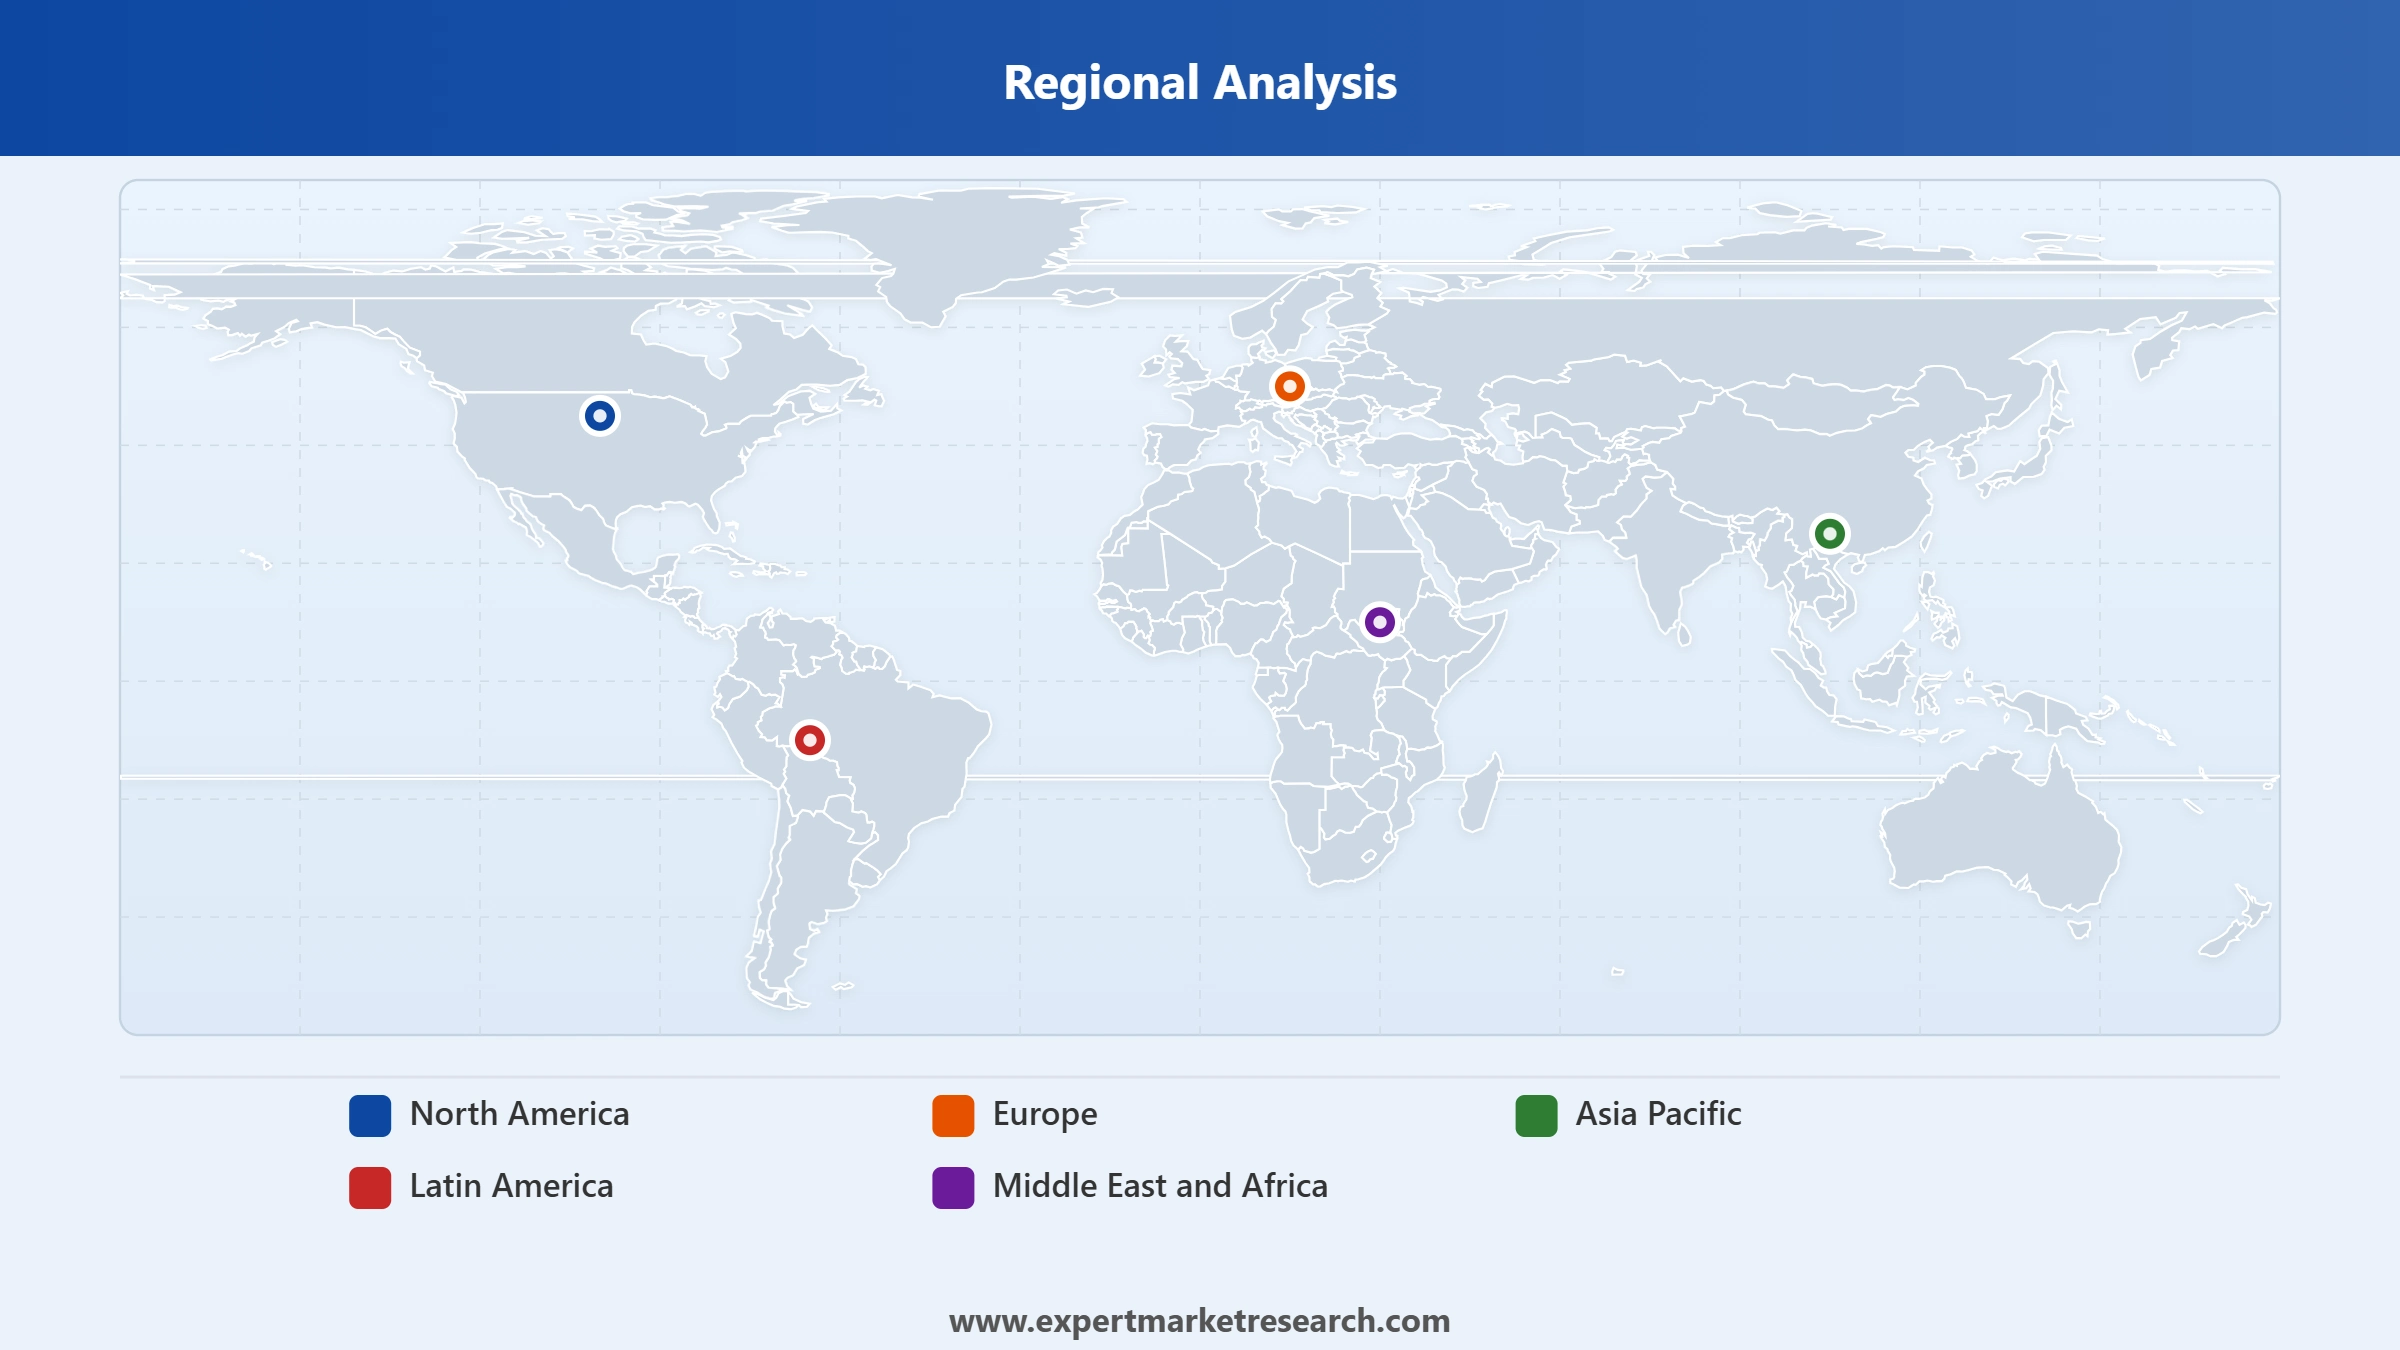
The major regional markets for non-lethal weapons are North America, Latin America, the Asia Pacific, Europe, and the Middle East and Africa.
The major end users of non-lethal weapons are law enforcement and military.
The different product types of non-lethal weapons include direct contact non-lethal weapons and directed energy weapons (DEW).
The significant technologies in non-lethal weapons are electromagnetic non-lethal weapons, mechanical and kinetic non-lethal weapons, and chemical non-lethal weapons, among others.
The major players in the industry are Axon Enterprise, Inc., Genasys Inc., Combined Systems, Inc., Amtec Less Lethal Systems Inc., and Nonlethal Technologies, Inc., among others.
Explore our key highlights of the report and gain a concise overview of key findings, trends, and actionable insights that will empower your strategic decisions.
| REPORT FEATURES | DETAILS |
| Base Year | 2025 |
| Historical Period | 2019-2025 |
| Forecast Period | 2026-2035 |
| Scope of the Report |
Historical and Forecast Trends, Industry Drivers and Constraints, Historical and Forecast Market Analysis by Segment:
|
| Breakup by End User |
|
| Breakup by Product Type |
|
| Breakup by Technology |
|
| Breakup by Region |
|
| Market Dynamics |
|
| Competitive Landscape |
|
| Companies Covered |
|
| Report Price and Purchase Option | Explore our purchase options that are best suited to your resources and industry needs. |
| Delivery Format | Delivered as an attached PDF and Excel through email, with an option of receiving an editable PPT, according to the purchase option. |
Datasheet
One User
USD 2,499
USD 2,249
tax inclusive*
Single User License
One User
USD 3,999
USD 3,599
tax inclusive*
Five User License
Five User
USD 4,999
USD 4,249
tax inclusive*
Corporate License
Unlimited Users
USD 5,999
USD 5,099
tax inclusive*
*Please note that the prices mentioned below are starting prices for each bundle type. Kindly contact our team for further details.*
Flash Bundle
Small Business Bundle
Growth Bundle
Enterprise Bundle
*Please note that the prices mentioned below are starting prices for each bundle type. Kindly contact our team for further details.*
Flash Bundle
Number of Reports: 3
20%
tax inclusive*
Small Business Bundle
Number of Reports: 5
25%
tax inclusive*
Growth Bundle
Number of Reports: 8
30%
tax inclusive*
Enterprise Bundle
Number of Reports: 10
35%
tax inclusive*
How To Order

Select License Type
Choose the right license for your needs and access rights.

Click on ‘Buy Now’
Add the report to your cart with one click and proceed to register.

Select Mode of Payment
Choose a payment option for a secure checkout. You will be redirected accordingly.
Strategic Solutions for Informed Decision-Making
Gain insights to stay ahead and seize opportunities.

Get insights & trends for a competitive edge.

Track prices with detailed trend reports.

Analyse trade data for supply chain insights.

Leverage cost reports for smart savings

Enhance supply chain with partnerships.

Connect For More Information
Our expert team of analysts will offer full support and resolve any queries regarding the report, before and after the purchase.
Our expert team of analysts will offer full support and resolve any queries regarding the report, before and after the purchase.
We employ meticulous research methods, blending advanced analytics and expert insights to deliver accurate, actionable industry intelligence, staying ahead of competitors.
Our skilled analysts offer unparalleled competitive advantage with detailed insights on current and emerging markets, ensuring your strategic edge.
We offer an in-depth yet simplified presentation of industry insights and analysis to meet your specific requirements effectively.


