

Consumer Insights
Uncover trends and behaviors shaping consumer choices today
Procurement Insights
Optimize your sourcing strategy with key market data
Industry Stats
Stay ahead with the latest trends and market analysis.
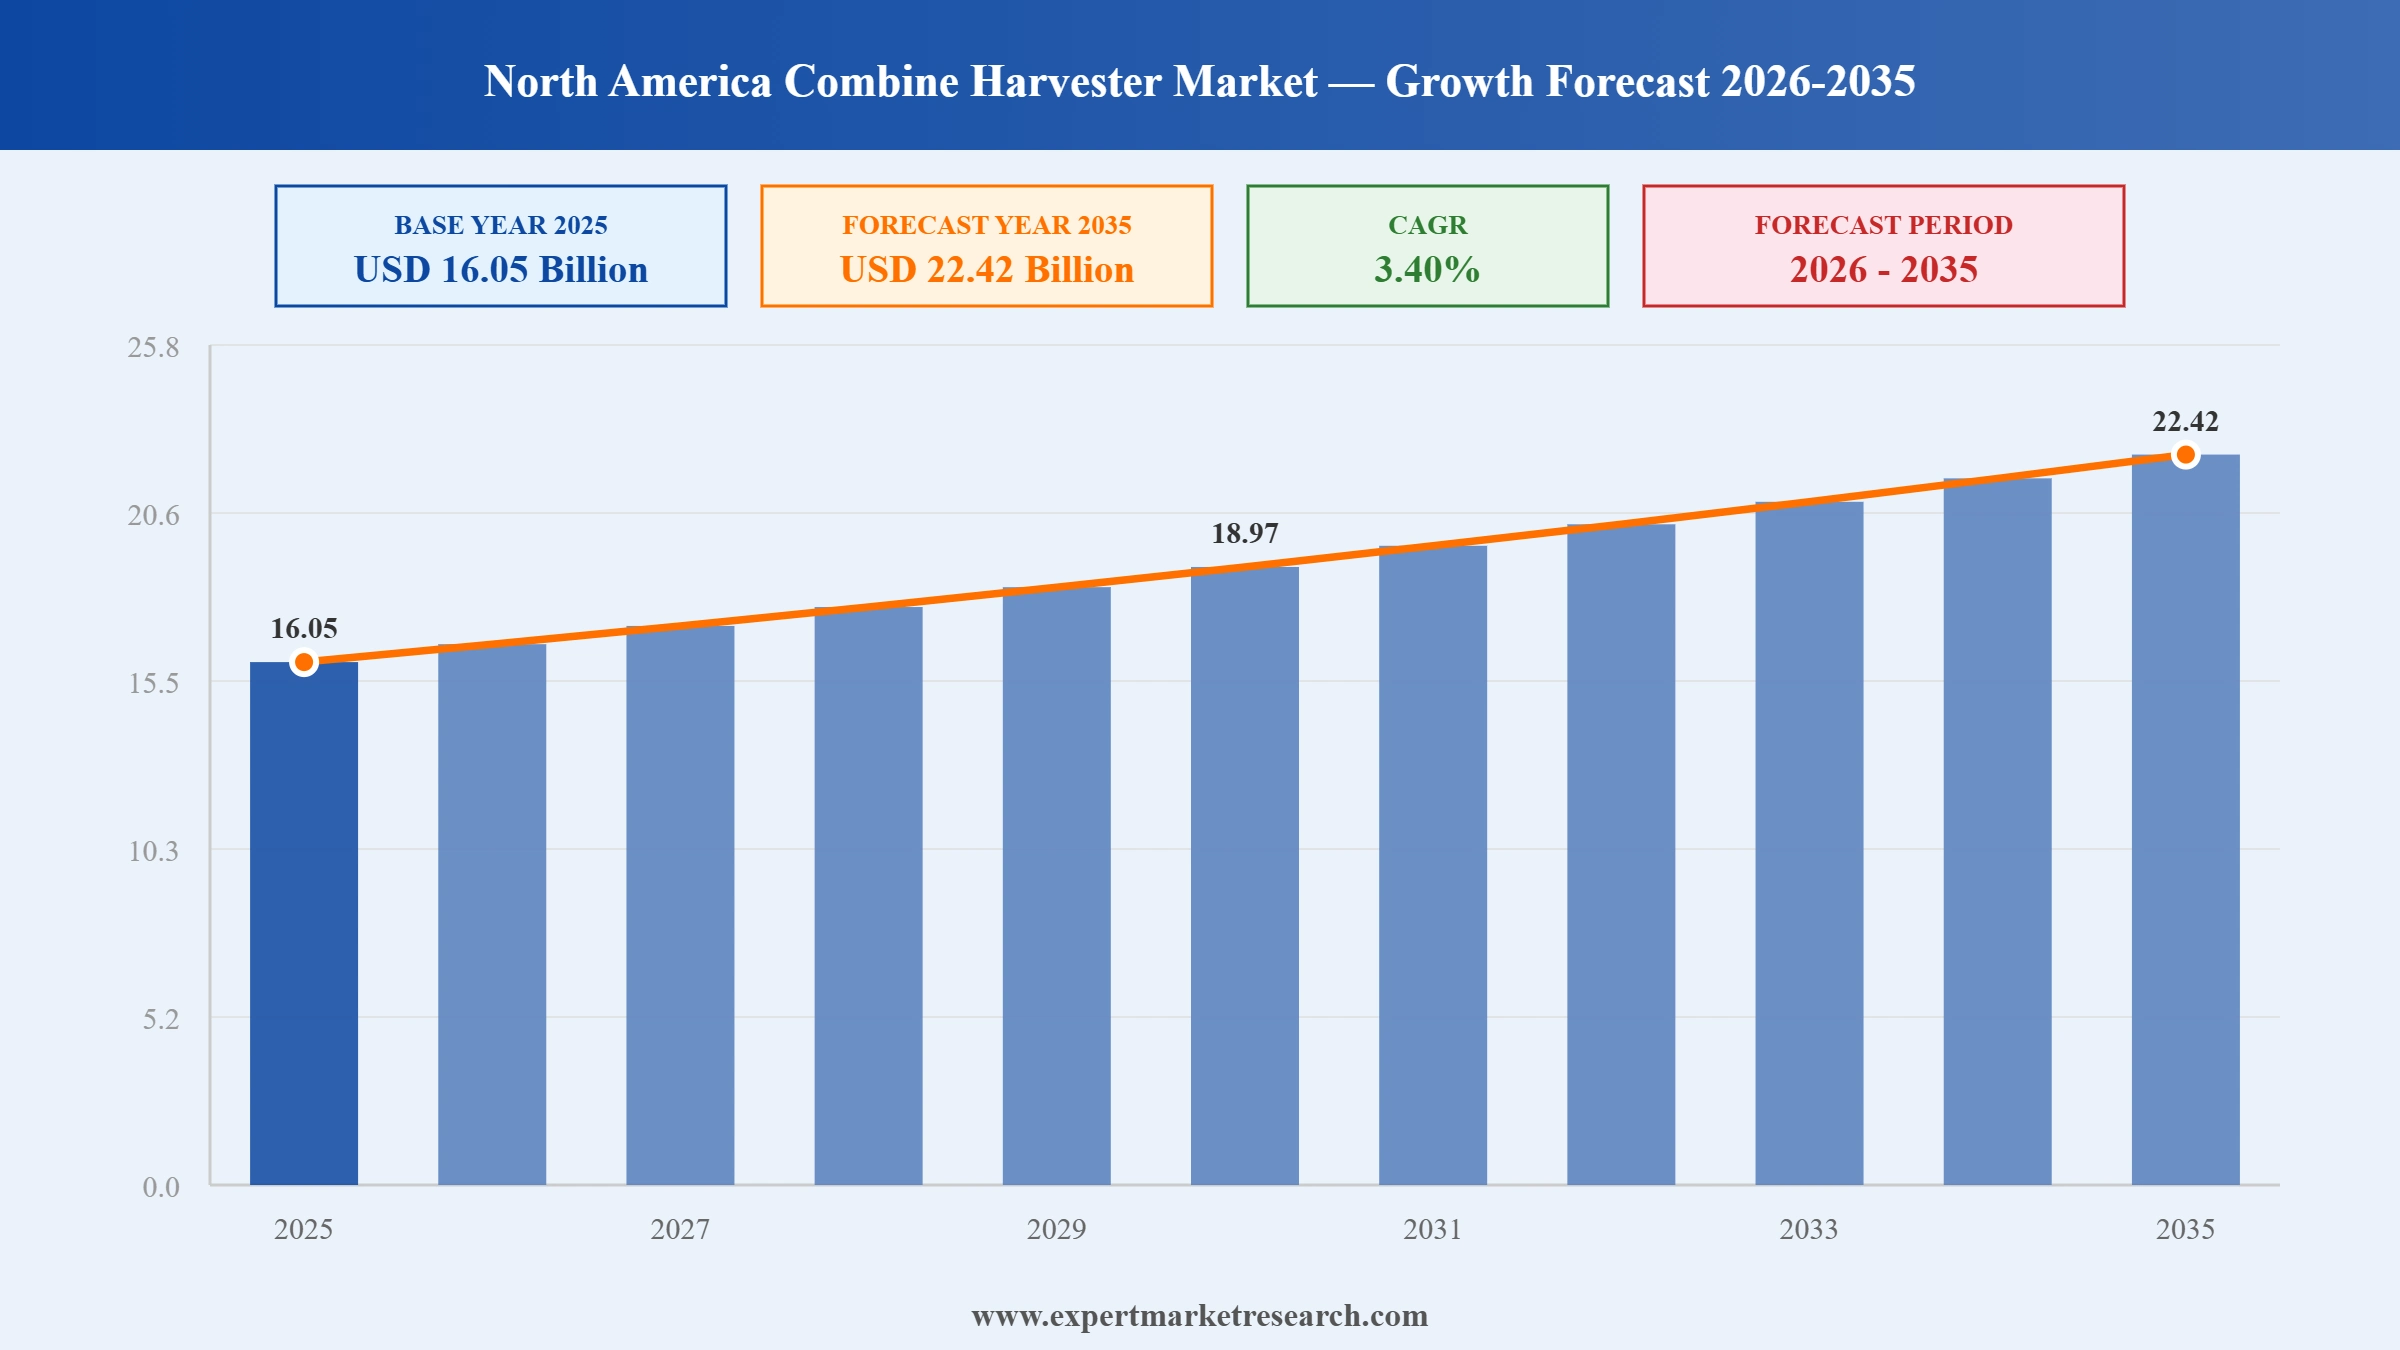
The North America combine harvester market reached around USD 16.05 Billion in 2025. The market is projected to grow at a CAGR of 3.40% between 2026 and 2035 to reach nearly USD 22.42 Billion by 2035.
In 2023, the agricultural sector in the United States generated an output valued at $203.5 billion, representing approximately 0.7% of the nation's GDP.
The estimated number of farms in the United States for 2021 stands at 2,012,050.
The World Bank reports that Canada possesses 1,824 tractors for every 1,000 farmers, placing it ahead of the United States, which has 1,586 tractors per 1,000 farmers.
Read more about this report - REQUEST FREE SAMPLE COPY IN PDF
| North America Combine Harvester Market Report Summary | Description | Value |
| Base Year | USD Billion | 2025 |
| Historical Period | USD Billion | 2019-2025 |
| Forecast Period | USD Billion | 2026-2035 |
| Market Size 2025 | USD Billion | 16.05 |
| Market Size 2035 | USD Billion | 22.42 |
| CAGR 2019-2025 | Percentage | XX% |
| CAGR 2026-2035 | Percentage | 3.40% |
| CAGR 2026-2035 - Market by Country | Canada | 3.8% |
| CAGR 2026-2035 - Market by Type | Self-propelled | 4.0% |
| CAGR 2026-2035 - Market by Type of Movement | Crawler Type | 3.9% |
| 2025 Market Share by Country | Canada | 8.2% |
In 2021, the average size of farms in the United States was recorded at 445 acres, a slight increase from 444 acres in the prior year. By 2022, the nation boasted over 1.9 million farms, which collectively utilised 880.1 million acres of land, representing 39% of the total land area in the U.S. Texas holds the position of having the largest share of agricultural land in the country, comprising 14.07% of the total farmland, equivalent to 126 million acres.
The adoption of combine harvesters has significantly increased, driven by the growth in farm sizes and heightened agricultural activities. These machines are adept at efficiently harvesting a variety of crops, thereby lowering labour costs and saving time. Their adaptability and high efficiency meet the demands of contemporary agriculture, allowing farmers to operate larger fields with increased convenience.
Employment in U.S. agriculture has experienced a significant decrease of 35% since 1969. Furthermore, the total number of agricultural workers is anticipated to decline by 2% from 2023 to 2033 in the United States. The growing adoption of combine harvesters is largely a response to the labour shortage faced by farms. These sophisticated machines automate the harvesting process, thereby lessening the dependence on manual labour and alleviating workforce issues. By enhancing efficiency and reducing labour requirements, combine harvesters enable farmers to cultivate larger areas and ensure prompt harvesting of crops, even in the context of a shrinking labour pool.
Increasing farm sizes, adoption of cutting-edge technologies, improvement of rural infrastructure, and shortage of labour in the agricultural sector are the major trends impacting the North America combine harvester market expansion
John Deere, a prominent American company specialising in the production of agricultural machinery, heavy equipment, and forestry machinery, unveiled the new S7 Series of combines. This range of harvesters is engineered to enhance efficiency, improve harvest quality, and prioritise operator comfort.
New Holland, a leading global manufacturer of a comprehensive range of agricultural machinery, introduced its latest CR11 combine across North America. The CR11 combine offers markedly enhanced productivity, achieving nearly zero grain loss, increased throughput, and greater automation, all contributing to a reduction in the overall cost of harvesting.
Case IH, a manufacturer based in Wisconsin, unveiled its newest model of combine harvester. The AF11 combine harvester features two notable improvements including enhanced grain capacity and a faster dumping speed.
The incorporation of cutting-edge technologies, including precision agriculture, automation, and data analytics, significantly enhances the efficiency and productivity of combine harvesters. Modern features such as GPS guidance systems, yield mapping, and automated configurations render these advanced combines increasingly attractive to farmers.
The demand for enhanced agricultural productivity and yield necessitates the development of sophisticated harvesting machinery. Advanced combine harvesters with superior features enable farmers to attain improved outcomes and satisfy the rising food requirements.
The enhancement of rural infrastructure and development is crucial for increasing the accessibility and efficiency of agricultural operations, particularly through the integration of modern combine harvesters. Improved rural infrastructure, such as well-maintained roads, reliable electricity supply, and efficient irrigation systems, plays a vital role in facilitating the movement of agricultural machinery and produce.
The shortage of skilled labour in the agricultural sector has become a significant challenge for farmers and agricultural businesses. This scarcity of qualified workers can be attributed to various factors, including an ageing workforce, urban migration, and the declining interest of younger generations in pursuing careers in agriculture, consequently leading to the demand for modern agricultural machinery, including combine harvesters.
The increasing size of farms and agricultural enterprises is fuelling the demand for combine harvesters that offer high capacity and efficiency. As agricultural operations expand, the necessity for machinery capable of managing larger harvest volumes effectively becomes more pronounced.


Read more about this report - REQUEST FREE SAMPLE COPY IN PDF
The market for combine harvesters in North America is being driven by the growing adoption of advanced precision agriculture technologies. Sophisticated systems such as GPS and real-time data analytics are improving harvesting efficiency and crop management, enabling farmers to maximise yields and minimise waste, indicative of a transition towards more data-centric agricultural practices.
Additionally, there is an increasing inclination towards automation in combine harvesters, with a rising number of models equipped with automated controls and autonomous driving features. This development responds to labour shortages, enhances operational efficiency, and diminishes human error, thereby rendering contemporary harvesting operations more efficient and economically viable.
North America Combine Harvester Market Report and Forecast 2026-2035 offers a detailed analysis of the market based on the following segments:
Market Breakup by Type
Market Breakup by Type of Movement
Market Breakup by Country
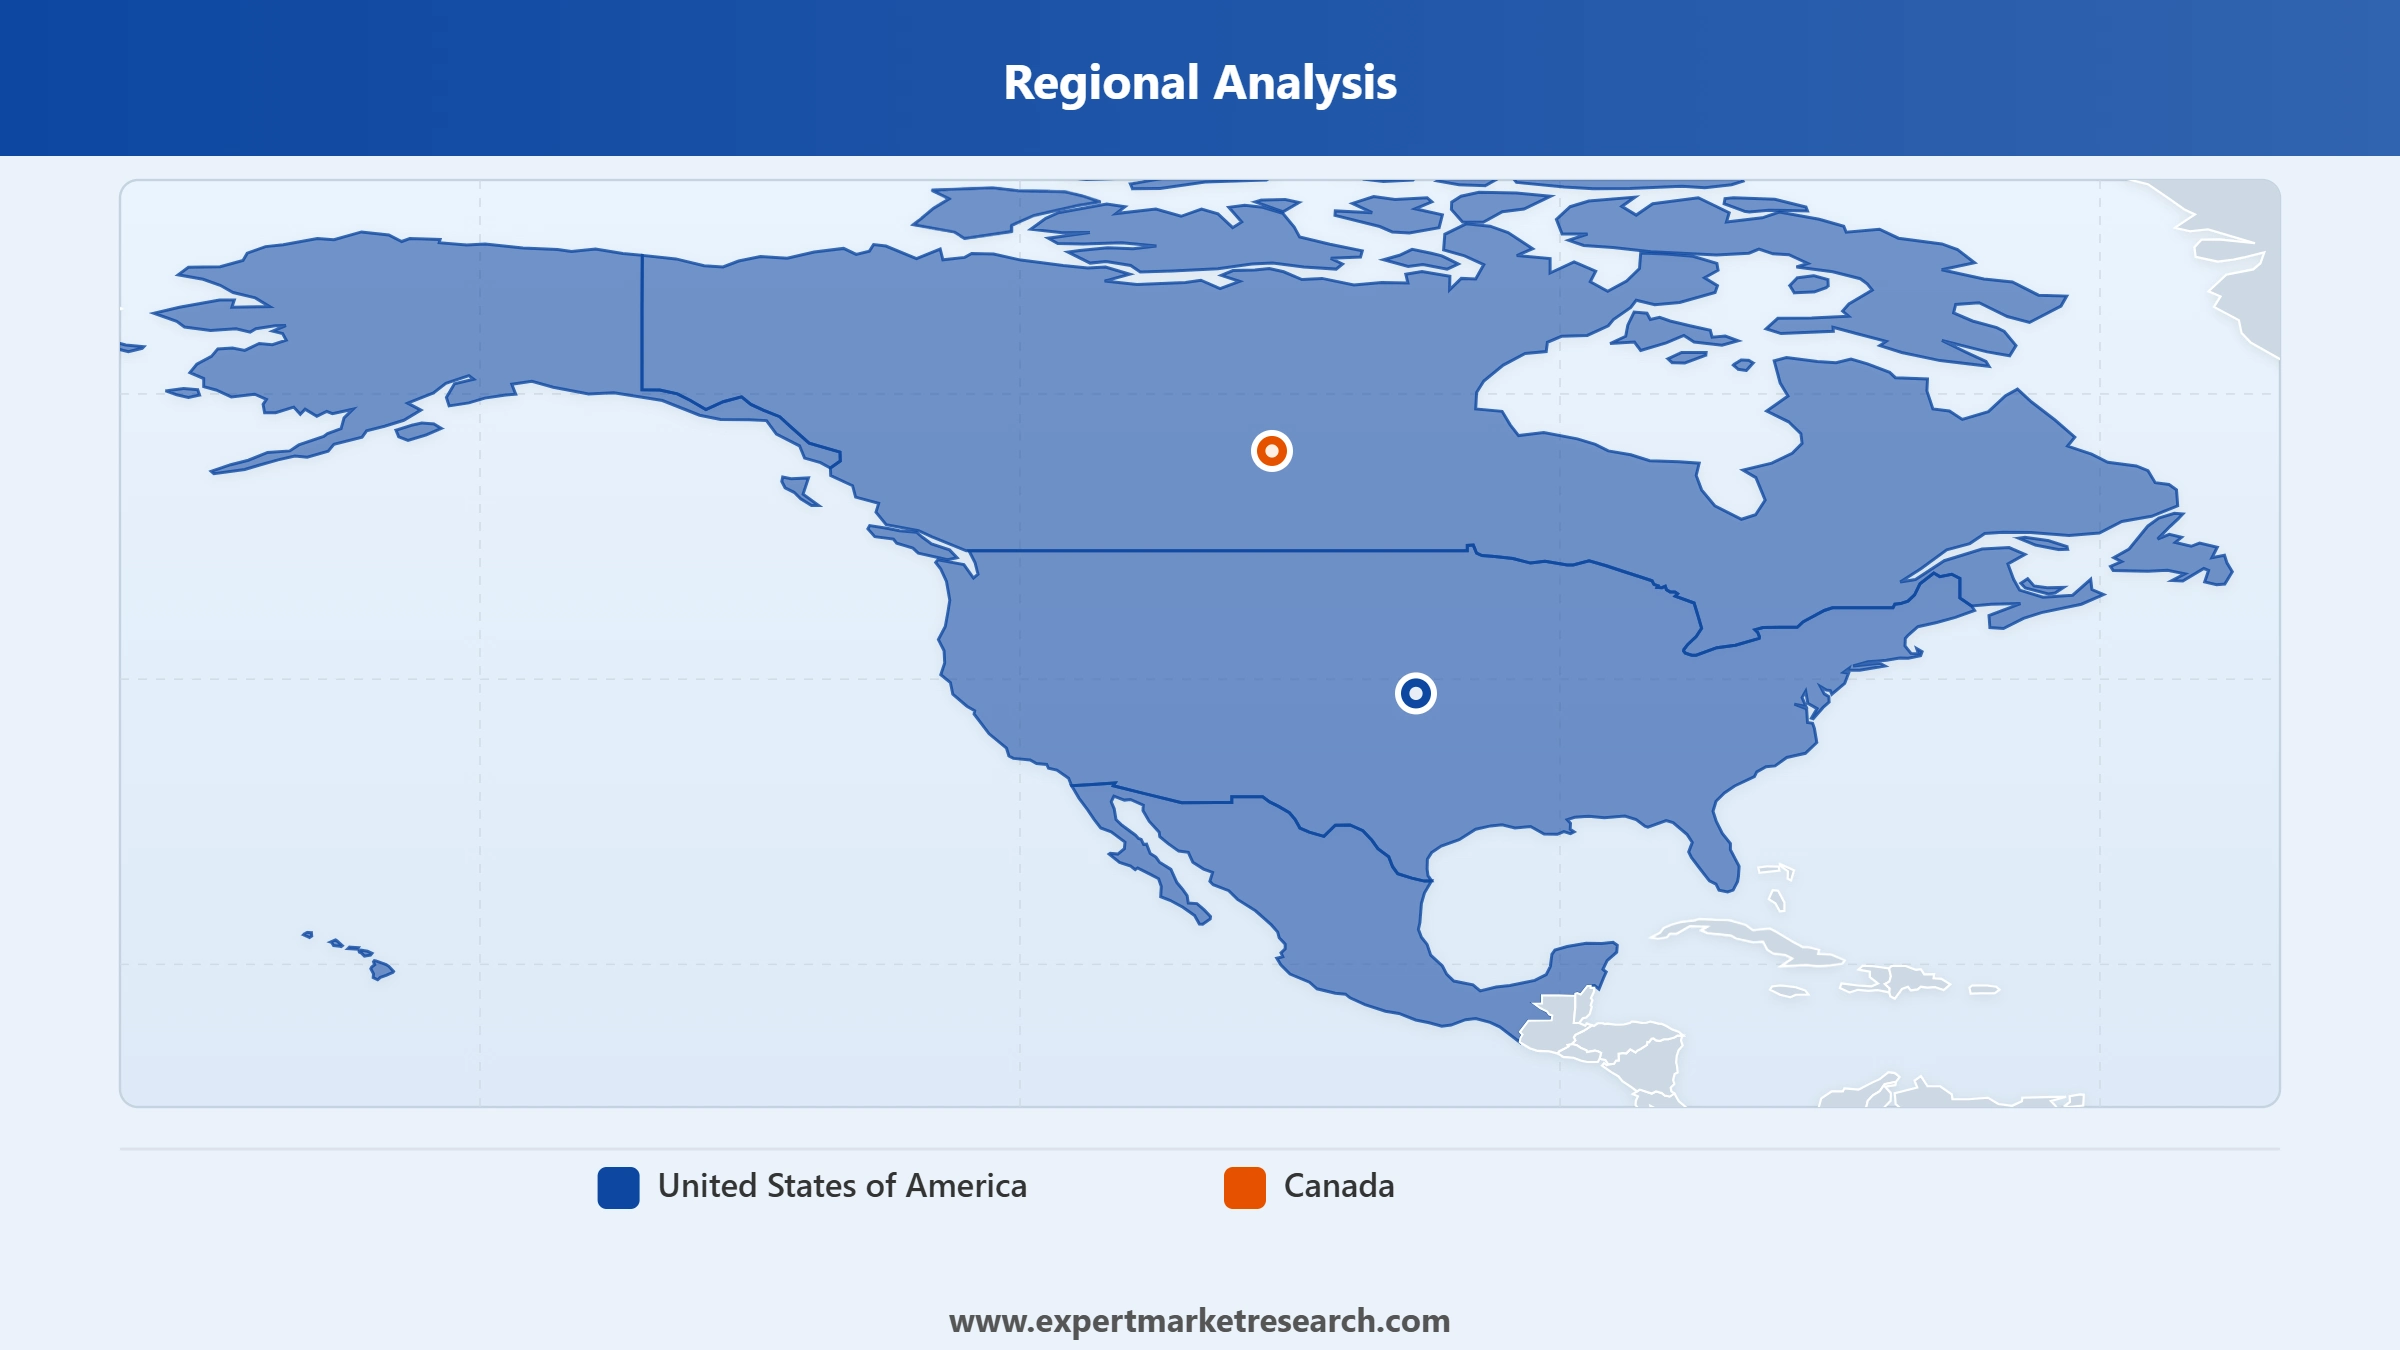
Based on country, the market is segmented into Canada and the United States. Canada is projected to grow at a CAGR of 3.8% during the forecast period of 2026-2035 amid growing labour shortages and the rising adoption of advanced technologies in the agricultural sector.
Read more about this report - REQUEST FREE SAMPLE COPY IN PDF
Major players are focusing on the manufacturing of technologically equipped combine harvesters to gain a competitive edge in the market.
Established in 1890 and based in Osaka, Japan, Kubota offers a diverse array of products and technologies to address challenges related to food, water, and environmental sustainability. Kubota Corporation, along with its subsidiaries, produces and markets a variety of machinery and other industrial and consumer goods across Asia, North America, Europe, and beyond.
YANMAR HOLDINGS CO., LTD. was established in 1912 and is based in Kita-ku, Japan. The company specialises in the production and sale of engines that serve various purposes, such as powering seagoing vessels, recreational boats, construction machinery, agricultural tools, and generator sets.
Established in 2012 and headquartered in the United Kingdom, CNH is a premier provider of equipment and services dedicated to the sustainable advancement of agriculture and construction professionals. The company offers strategic guidance, research and development expertise, and investments that facilitate the success of its primary brands.
Deere & Company was established in 1837 and is headquartered in Illinois, United States. The company specialises in the production of agricultural machinery, heavy equipment, forestry machinery, diesel engines, drivetrains for heavy equipment, and lawn care equipment.
*Please note that this is only a partial list; the complete list of key players is available in the full report. Additionally, the list of key players can be customized to better suit your needs.*
Other major players in the market are Iseki & Co., Ltd., AGCO Corp., CLAAS KGaA mbH, and SDF Group, among others.
Upto 15% Off
USD
$3999 $3599
$2499 $2249
$4999 $4249
$5999 $5099


*While we strive to always give you current and accurate information, the numbers depicted on the website are indicative and may differ from the actual numbers in the main report. At Expert Market Research, we aim to bring you the latest insights and trends in the market. Using our analyses and forecasts, stakeholders can understand the market dynamics, navigate challenges, and capitalize on opportunities to make data-driven strategic decisions.*
In 2025, the market attained a value of nearly USD 16.05 Billion.
The market is assessed to grow at a CAGR of 3.40% between 2026 and 2035.
The market is estimated to witness a healthy growth in the forecast period of 2026-2035 to reach about USD 22.42 Billion by 2035.
The market is being driven by the increasing size of farms and agricultural enterprises and the rising development of rural infrastructure.
The key trends aiding the market expansion include the adoption of cutting-edge agricultural technologies and the rising shortage of labour in the agricultural sector.
The major types of combine harvester in the market are self-propelled, tractor-pulled combine, and PTO-powered combine.
The major countries considered in the market are the United States of America and Canada.
The major players in the market are Kubota Corporation, Yanmar Holdings Co., Ltd., Yanmar Holdings Co., Ltd., Deere & Company, Iseki & Co., Ltd., AGCO Corp., CLAAS KGaA mbH, and SDF Group, among others.
Explore our key highlights of the report and gain a concise overview of key findings, trends, and actionable insights that will empower your strategic decisions.
| REPORT FEATURES | DETAILS |
| Base Year | 2025 |
| Historical Period | 2019-2025 |
| Forecast Period | 2026-2035 |
| Scope of the Report |
Historical and Forecast Trends, Industry Drivers and Constraints, Historical and Forecast Market Analysis by Segment:
|
| Breakup by Type |
|
| Breakup by Type of Movement |
|
| Breakup by Region |
|
| Market Dynamics |
|
| Competitive Landscape |
|
| Companies Covered |
|
Single User License
One User
USD 3,999
USD 3,599
tax inclusive*
Datasheet
One User
USD 2,499
USD 2,249
tax inclusive*
Five User License
Five User
USD 4,999
USD 4,249
tax inclusive*
Corporate License
Unlimited Users
USD 5,999
USD 5,099
tax inclusive*
*Please note that the prices mentioned below are starting prices for each bundle type. Kindly contact our team for further details.*
Flash Bundle
Small Business Bundle
Growth Bundle
Enterprise Bundle
*Please note that the prices mentioned below are starting prices for each bundle type. Kindly contact our team for further details.*
Flash Bundle
Number of Reports: 3
20%
tax inclusive*
Small Business Bundle
Number of Reports: 5
25%
tax inclusive*
Growth Bundle
Number of Reports: 8
30%
tax inclusive*
Enterprise Bundle
Number of Reports: 10
35%
tax inclusive*
How To Order

Select License Type
Choose the right license for your needs and access rights.

Click on ‘Buy Now’
Add the report to your cart with one click and proceed to register.

Select Mode of Payment
Choose a payment option for a secure checkout. You will be redirected accordingly.
Strategic Solutions for Informed Decision-Making
Gain insights to stay ahead and seize opportunities.

Get insights & trends for a competitive edge.

Track prices with detailed trend reports.

Analyse trade data for supply chain insights.

Leverage cost reports for smart savings

Enhance supply chain with partnerships.

Connect For More Information
Our expert team of analysts will offer full support and resolve any queries regarding the report, before and after the purchase.
Our expert team of analysts will offer full support and resolve any queries regarding the report, before and after the purchase.
We employ meticulous research methods, blending advanced analytics and expert insights to deliver accurate, actionable industry intelligence, staying ahead of competitors.
Our skilled analysts offer unparalleled competitive advantage with detailed insights on current and emerging markets, ensuring your strategic edge.
We offer an in-depth yet simplified presentation of industry insights and analysis to meet your specific requirements effectively.


