Reports

Sale

North America Occupancy Sensor Market

North America Occupancy Sensor Market Size, Share, Trends: By Network Connectivity: Wired, Wireless; By Technology: Ultrasonic, Passive Infrared, Microwave; By Operation: Indoor, Outdoor; By Building Type: Residential, Commercial; By Application: HVAC, Lighting Control, Others; Regional Analysis; Competitive Landscape; 2024-2032

North America Occupancy Sensor Market Outlook

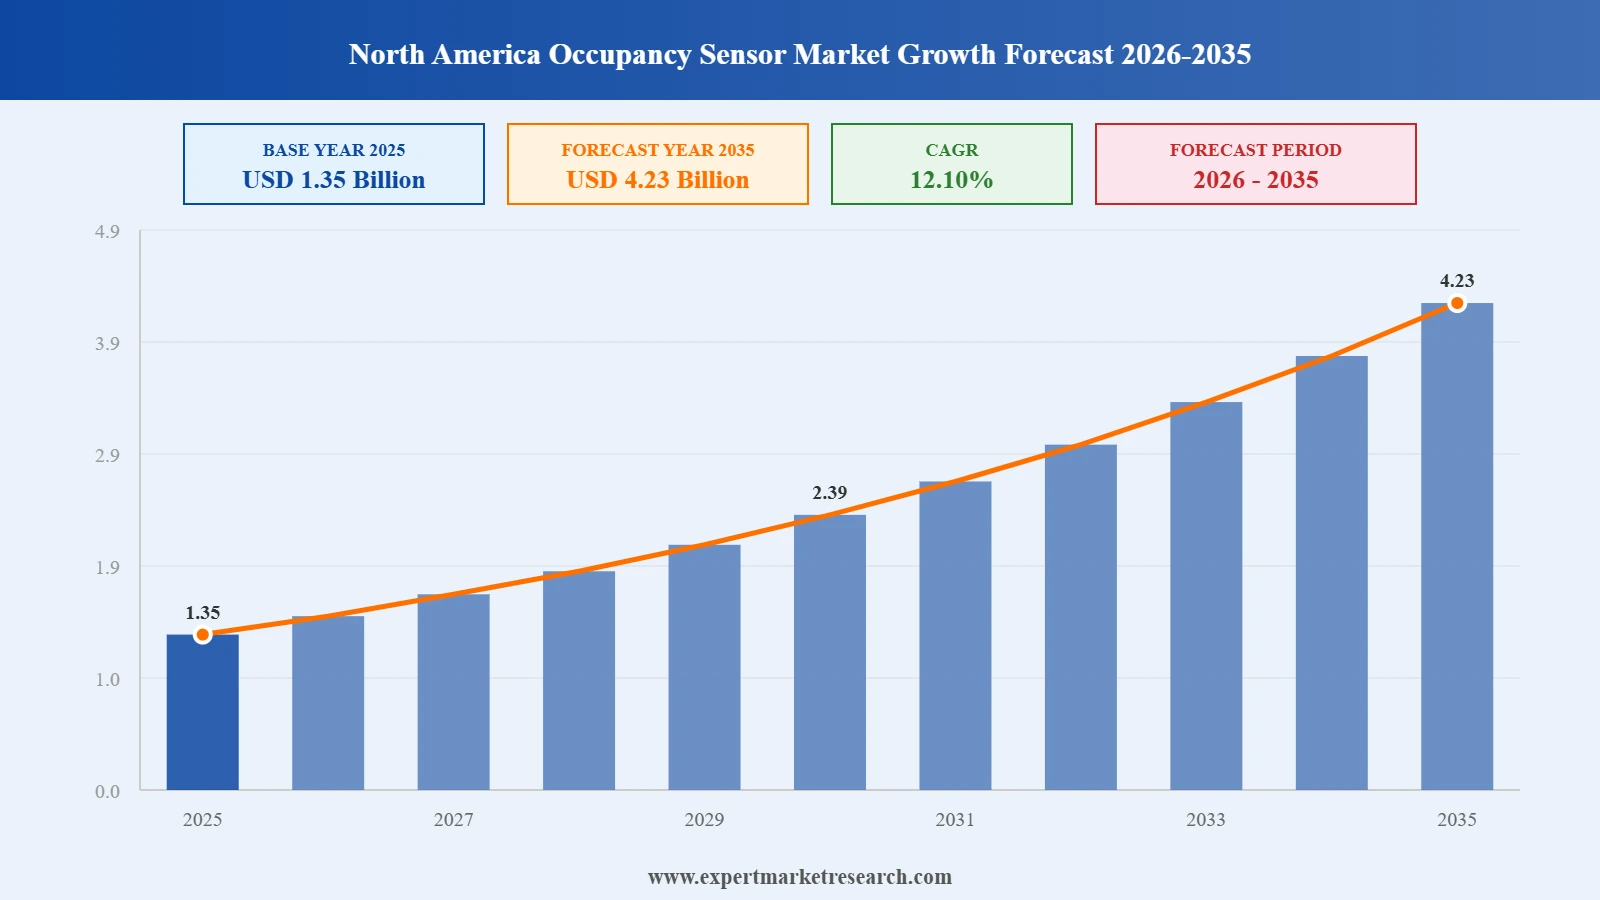
The North America occupancy sensor market size reached USD 1.2 billion in 2023. The market is expected to grow at a CAGR of 12.10% between 2024 and 2032, reaching almost USD 3.41 billion by 2032.


Key Takeaways:

  • Smart speakers dominate the smart home landscape, boasting a usage rate of 35.6% among all smart home devices.
  • As of 2020, roughly one-third of American adults have adopted smart home security products. Projections indicate that by 2025, the average North American household will be equipped with approximately 20 interconnected devices.
  • Nearly 67% of U.S. households incorporate some form of smart home technology. The integration of smart home solutions has the potential to slash global energy expenses by up to 10%.
  • Recent survey data reveals that in 2024, an estimated 69.91 million households in the U.S. actively utilise smart home devices, marking a 10.2% increase from the 63.43 million households reported in 2023.


North America, particularly the United States, dominates the occupancy sensor market due to robust growth in the construction industry, coupled with a focus on innovation. This region witnessed the launch of cutting-edge occupancy sensors like image processing occupancy sensors (IPOS) and intelligent occupancy sensors (IOS), driving market expansion. However, recent incidents, such as malfunctioning passenger-side airbag occupant sensors in Audi vehicles, have posed challenges to market growth. Despite this, the demand for smart lighting solutions, fuelled by rising house prices and increased affordability of homeownership, remains strong while driving the North America occupancy sensor market.


The adoption of smart home technology is on the rise, driven by factors like the "cool factor" and energy-saving benefits. Global players like Loxone have entered the North American market, further shaping its landscape. Occupancy sensors, vital for energy conservation and building code compliance, leverage technologies like infrared, ultrasonic, and microwave to detect occupancy and adjust lighting accordingly. They find applications in residential, commercial, and industrial spaces, driving market growth.


Advancements in technology and the development of smart cities further boost the occupancy sensor market. The highly organised and regulated value chain in North America, particularly the United States, is conducive to market growth. With technological advancements and the increasing demand for HVAC systems, the USA market is poised for significant growth in the coming years leading to the North America occupancy sensor market development.


North America Occupancy Sensor Market


Market Segmentation

North America Occupancy Sensor Market Report and Forecast 2024-2032 offers a detailed analysis of the market based on the following segments:


Market Breakup by Network Connectivity

  • Wired
  • Wireless
    • Wi-Fi
    • Zigbee
    • EnOcean
    • Others


Market Breakup by Technology

  • Ultrasonic
  • Passive Infrared
  • Microwave


Market Breakup by Operation

  • Indoor
  • Outdoor


Market Breakup by Building Type

  • Residential
  • Commercial


Market Breakup by Application

  • HVAC
  • Lighting Control
  • Security and Surveillance
  • Others


Market Breakup by Country

  • United States of America
  • Canada


Competitive Landscape

Key players in the occupancy sensor in North America design, develop and provide products and services to support the end-users.


  • Schneider Electric SE
  • Eaton Corp. Plc
  • Honeywell International Inc.
  • Johnson Controls International Plc
  • General Electric Co.
  • Texas Instruments Incorporated
  • Analog Devices, Inc.
  • Legrand S.A.
  • Dwyer Instruments, LLC
  • Hubbell Inc.  
  • Others


Key Highlights of the Report

REPORT FEATURES DETAILS
Base Year 2023
Historical Period 2018-2023
Forecast Period 2024-2032
Scope of the Report

Historical and Forecast Trends, Industry Drivers and Constraints, Historical and Forecast Market Analysis by Segment:

  • Network Connectivity
  • Technology
  • Operation
  • Building Type
  • Application
  • Region
Breakup by Network Connectivity
  • Wired
  • Wireless
Breakup by Technology
  • Ultrasonic
  • Passive Infrared
  • Microwave
Breakup by Operation
  • Indoor
  • Outdoor
Breakup by Building Type
  • Residential
  • Commercial
Breakup by Application
  • HVAC
  • Lighting Control
  • Security and Surveillance
  • Others
Breakup by Region
  • United States of America 
  • Canada
Market Dynamics
  • SWOT Analysis
  • Porter's Five Forces Analysis
  • Key Indicators for Demand
  • Key Indicators for Price
Competitive Landscape
  • Market Structure
  • Company Profiles
    • Company Overview
    • Product Portfolio
    • Demographic Reach and Achievements
    • Certifications
Companies Covered
  • Schneider Electric SE
  • Eaton Corp. Plc
  • Honeywell International Inc.
  • Johnson Controls International Plc
  • General Electric Co.
  • Texas Instruments Incorporated
  • Analog Devices, Inc.
  • Legrand S.A.
  • Dwyer Instruments, LLC
  • Hubbell Inc.  
  • Others


*At Expert Market Research, we strive to always give you current and accurate information. The numbers depicted in the description are indicative and may differ from the actual numbers in the final EMR report.

1    Preface
2    Report Coverage – Key Segmentation and Scope
3    Report Description

    3.1    Market Definition and Outlook
    3.2    Properties and Applications
    3.3    Market Analysis
    3.4    Key Players
4    Key Assumptions
5    Executive Summary

    5.1    Overview
    5.2    Key Drivers    
    5.3    Key Developments
    5.4    Competitive Structure
    5.5    Key Industrial Trends
6    Market Snapshot
7    Opportunities and Challenges in the Market
8    Global Occupancy Sensor Market Overview

    8.1    Key Industry Highlights
    8.2    Global Occupancy Sensor Historical Market (2018-2023) 
    8.3    Global Occupancy Sensor Market Forecast (2024-2032)
    8.4    Global Occupancy Sensor Market Share by Region
        8.4.1    North America
        8.4.2    Europe
        8.4.3    Asia Pacific
        8.4.4    Latin America
        8.4.5    Middle East and Africa
9    North America Occupancy Sensor Market Overview
    9.1    Key Industry Highlights
    9.2    North America Occupancy Sensor Historical Market (2018-2023) 
    9.3    North America Occupancy Sensor Market Forecast (2024-2032)
10    North America Occupancy Sensor Market by Network Connectivity
    10.1    Wired
        10.1.1    Historical Trend (2018-2023)
        10.1.2    Forecast Trend (2024-2032)
    10.2    Wireless
        10.2.1    Historical Trend (2018-2023)
        10.2.2    Forecast Trend (2024-2032)
        10.2.3    Breakup by Type
            10.2.3.1    Wi-Fi
            10.2.3.2    Zigbee
            10.2.3.3    EnOcean
            10.2.3.4    Others
11    North America Occupancy Sensor Market by Technology
    11.1    Ultrasonic
        11.1.1    Historical Trend (2018-2023)
        11.1.2    Forecast Trend (2024-2032)
    11.2    Passive Infrared
        11.2.1    Historical Trend (2018-2023)
        11.2.2    Forecast Trend (2024-2032)
    11.3    Microwave
        11.3.1    Historical Trend (2018-2023)
        11.3.2    Forecast Trend (2024-2032)
12    North America Occupancy Sensor Market by Operation
    12.1    Indoor 
        12.1.1    Historical Trend (2018-2023)
        12.1.2    Forecast Trend (2024-2032)
    12.2    Outdoor
        12.2.1    Historical Trend (2018-2023)
        12.2.2    Forecast Trend (2024-2032)
13    North America Occupancy Sensor Market by Building Type
    13.1    Residential
        13.1.1    Historical Trend (2018-2023)
        13.1.2    Forecast Trend (2024-2032)
    13.2    Commercial
        13.2.1    Historical Trend (2018-2023)
        13.2.2    Forecast Trend (2024-2032)
14    North America Occupancy Sensor Market by Application
    14.1    HVAC
        14.1.1    Historical Trend (2018-2023)
        14.1.2    Forecast Trend (2024-2032)
    14.2    Lighting Control
        14.2.1    Historical Trend (2018-2023)
        14.2.2    Forecast Trend (2024-2032)
    14.3    Security and Surveillance
        14.3.1    Historical Trend (2018-2023)
        14.3.2    Forecast Trend (2024-2032)
    14.4    Others
15    North America Occupancy Sensor Market by Country
    15.1    United States of America
        15.1.1    Historical Trend (2018-2023)
        15.1.2    Forecast Trend (2024-2032)
    15.2    Canada
        15.2.1    Historical Trend (2018-2023)
        15.2.2    Forecast Trend (2024-2032)
16    Market Dynamics
    16.1    SWOT Analysis
        16.1.1    Strengths
        16.1.2    Weaknesses
        16.1.3    Opportunities
        16.1.4    Threats
    16.2    Porter’s Five Forces Analysis
        16.2.1    Supplier’s Power
        16.2.2    Buyer’s Power
        16.2.3    Threat of New Entrants
        16.2.4    Degree of Rivalry
        16.2.5    Threat of Substitutes
    16.3    Key Indicators of Demand
    16.4    Key Indicators of Price
17    Value Chain Analysis
18    Price Analysis
19    Competitive Landscape

    19.1    Market Structure
    19.2    Company Profiles
        19.2.1    Schneider Electric SE  
            19.2.1.1    Company Overview
            19.2.1.2    Product Portfolio
            19.2.1.3    Demographic Reach and Achievements
            19.2.1.4    Certifications
        19.2.2    Eaton Corp. Plc   
            19.2.2.1    Company Overview
            19.2.2.2    Product Portfolio
            19.2.2.3    Demographic Reach and Achievements
            19.2.2.4    Certifications
        19.2.3    Honeywell International Inc.  
            19.2.3.1    Company Overview
            19.2.3.2    Product Portfolio
            19.2.3.3    Demographic Reach and Achievements
            19.2.3.4    Certifications
        19.2.4    Johnson Controls International Plc  
            19.2.4.1    Company Overview
            19.2.4.2    Product Portfolio
            19.2.4.3    Demographic Reach and Achievements
            19.2.4.4    Certifications
        19.2.5    General Electric Co.   
            19.2.5.1    Company Overview
            19.2.5.2    Product Portfolio
            19.2.5.3    Demographic Reach and Achievements
            19.2.5.4    Certifications
        19.2.6    Texas Instruments Incorporated  
            19.2.6.1    Company Overview
            19.2.6.2    Product Portfolio
            19.2.6.3    Demographic Reach and Achievements
            19.2.6.4    Certifications
        19.2.7    Analog Devices, Inc.  
            19.2.7.1    Company Overview
            19.2.7.2    Product Portfolio
            19.2.7.3    Demographic Reach and Achievements
            19.2.7.4    Certifications
        19.2.8    Legrand S.A.  
            19.2.8.1    Company Overview
            19.2.8.2    Product Portfolio
            19.2.8.3    Demographic Reach and Achievements
            19.2.8.4    Certifications
        19.2.9    Dwyer Instruments, LLC  
            19.2.9.1    Company Overview
            19.2.9.2    Product Portfolio
            19.2.9.3    Demographic Reach and Achievements
            19.2.9.4    Certifications
        19.2.10    Hubbell Inc.  
            19.2.10.1    Company Overview
            19.2.10.2    Product Portfolio
            19.2.10.3    Demographic Reach and Achievements
            19.2.10.4    Certifications
        19.2.11    Others 
20    Key Trends and Developments in the Market


List of Key Figures and Tables

1.    Global Occupancy Sensor Market: Key Industry Highlights, 2018 and 2032
2.    North America Occupancy Sensor Market: Key Industry Highlights, 2018 and 2032
3.    North America Occupancy Sensor Historical Market: Breakup by Network Connectivity (USD Billion), 2018-2023
4.    North America Occupancy Sensor Market Forecast: Breakup by Network Connectivity (USD Billion), 2024-2032
5.    North America Occupancy Sensor Historical Market: Breakup by Technology (USD Billion), 2018-2023
6.    North America Occupancy Sensor Market Forecast: Breakup by Technology (USD Billion), 2024-2032
7.    North America Occupancy Sensor Historical Market: Breakup by Operation (USD Billion), 2018-2023
8.    North America Occupancy Sensor Market Forecast: Breakup by Operation (USD Billion), 2024-2032
9.    North America Occupancy Sensor Historical Market: Breakup by Building Type (USD Billion), 2018-2023
10.    North America Occupancy Sensor Market Forecast: Breakup by Building Type (USD Billion), 2024-2032
11.    North America Occupancy Sensor Historical Market: Breakup by Application (USD Billion), 2018-2023
12.    North America Occupancy Sensor Market Forecast: Breakup by Application (USD Billion), 2024-2032
13.    North America Occupancy Sensor Historical Market: Breakup by Country (USD Billion), 2018-2023
14.    North America Occupancy Sensor Market Forecast: Breakup by Country (USD Billion), 2024-2032
15.    North America Occupancy Sensor Market Structure

Key Questions Answered in the Report

The market is estimated to be valued at USD 1.2 billion in 2023.

The market is projected to grow at a CAGR of 12.10% between 2024 and 2032.

The occupancy sensor market is expected to reach USD 3.41 billion in 2032.

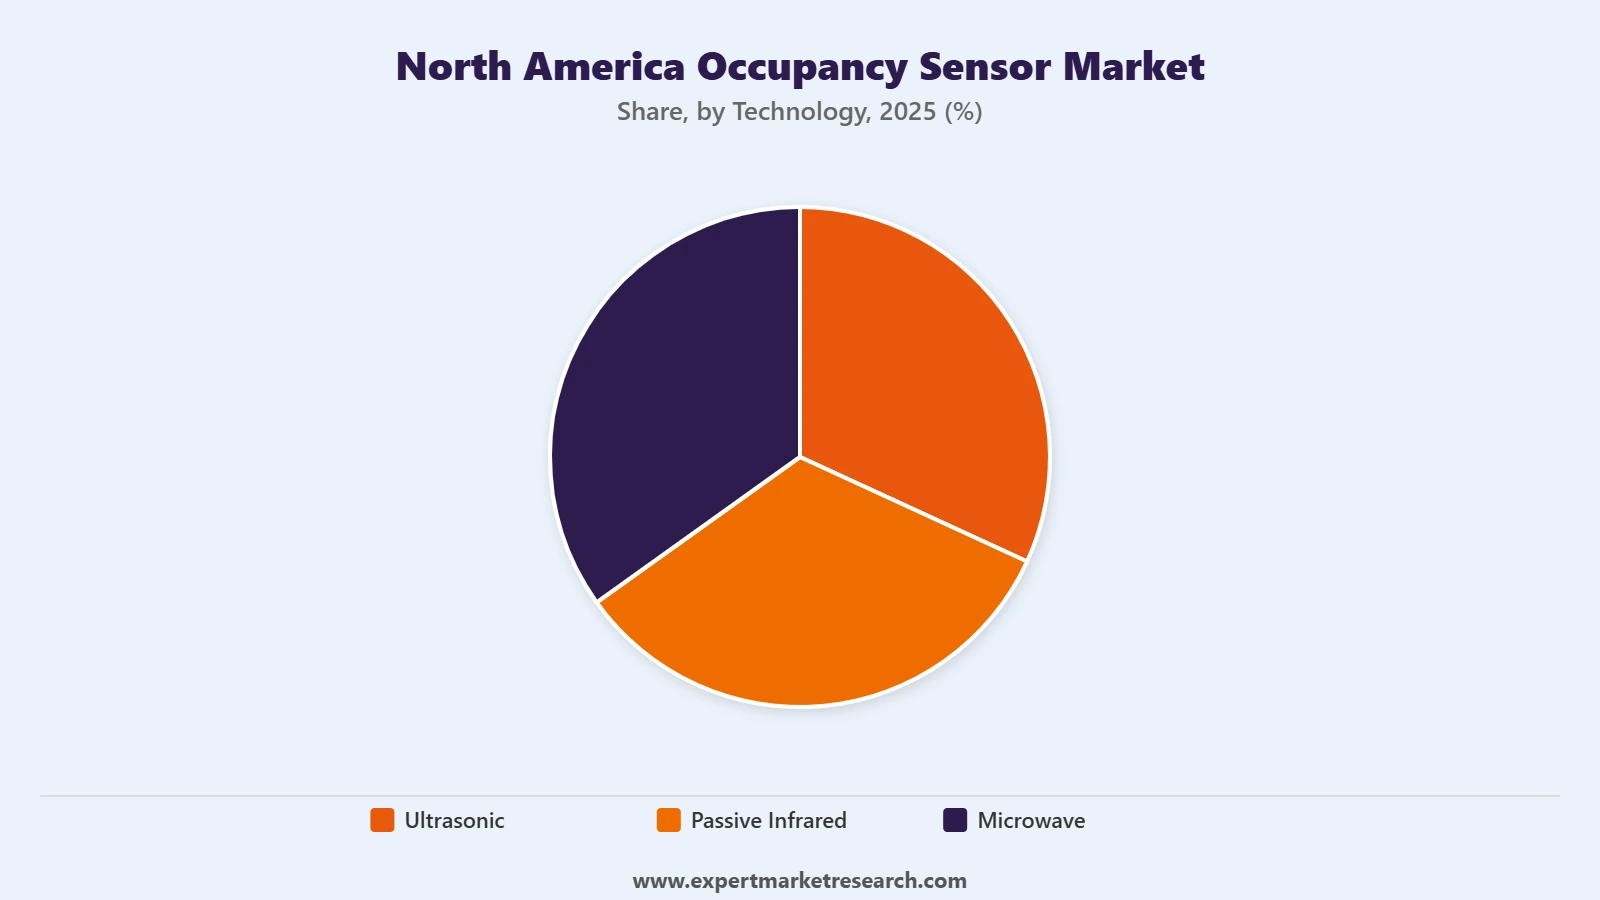
The market is categorised according to its technology, which includes ultrasonic, passive infrared, and microwave.

The key market players are Schneider Electric SE, Eaton Corp. Plc, Honeywell International Inc., Johnson Controls International Plc, General Electric Co., Texas Instruments Incorporated, Analog Devices, Inc., Legrand S.A., Dwyer Instruments, LLC, Hubbell Inc., and others.

The market is driven by factors that include rising adoption of smart home technologies, advancements in technology and the development of smart cities, among others.

The major applications includes HVAC, lighting control, security and surveillance and others.

Occupancy sensing technologies encompass a range of options, with the most prevalent being passive infrared, microwave, ultrasonic, and video image processing.

Some of the largest sensor manufacturers globally include Honeywell International Inc., Sony Corporation, BorgWarner Inc., Emerson Electric Co., among others.

In OCC mode, the light activates automatically upon detecting motion and deactivates when motion ceases. In VAC mode, the light is manually activated and will automatically deactivate when motion is no longer detected.

Purchase Full Report

Mini Report

$ 2199     $1999
  • Selected Sections, One User
  • Printing Not Allowed
  • Email Delivery in PDF
  • Free Limited Customisation
  • Post Sales Analyst Support
  • 50% Discount on Next Update

Single User License

$ 3299     $2999
  • All Sections, One User
  • One Print Allowed
  • Email Delivery in PDF
  • Free Limited Customisation
  • Post Sales Analyst Support
  • 50% Discount on Next Update
most popular

Five User License

$ 4399     $3999
  • All Sections, Five Users
  • Five Prints Allowed
  • Email Delivery in PDF
  • Free Limited Customisation
  • Post Sales Analyst Support
  • 50% Discount on Next Update

Corporate License

$ 5499     $4999
  • All Sections, Unlimited Users
  • Unlimited Prints Allowed
  • Email Delivery in PDF + Excel
  • Free Limited Customisation
  • Post Sales Analyst Support
  • 50% Discount on Next Update

Any Question? Speak With An Analyst

Contact Analyst

View A Sample

Request Sample

Did You Miss Anything, Ask Now

Request Customisation
Why Expert Market Research?

Right People

We are technically excellent, strategic, practical, experienced and efficient; our analysts are hand-picked based on having the right attributes to work successfully and execute projects based on your expectations.

Right Methodology

We leverage our cutting-edge technology, our access to trusted databases, and our knowledge of the current models used in the market to deliver you research solutions that are tailored to your needs and put you ahead of the curve.

Right Price

We deliver in-depth and superior quality research in prices that are reasonable, unmatchable, and shows our understanding of your resource structure. We, additionally, offer attractive discounts on our upcoming reports.

Right Support

Our team of expert analysts are at your beck and call to deliver you optimum results that are customised to meet your precise needs within the specified timeframe and help you form a better understanding of the industry.

NEWSLETTER