

Consumer Insights
Uncover trends and behaviors shaping consumer choices today
Procurement Insights
Optimize your sourcing strategy with key market data
Industry Stats
Stay ahead with the latest trends and market analysis.
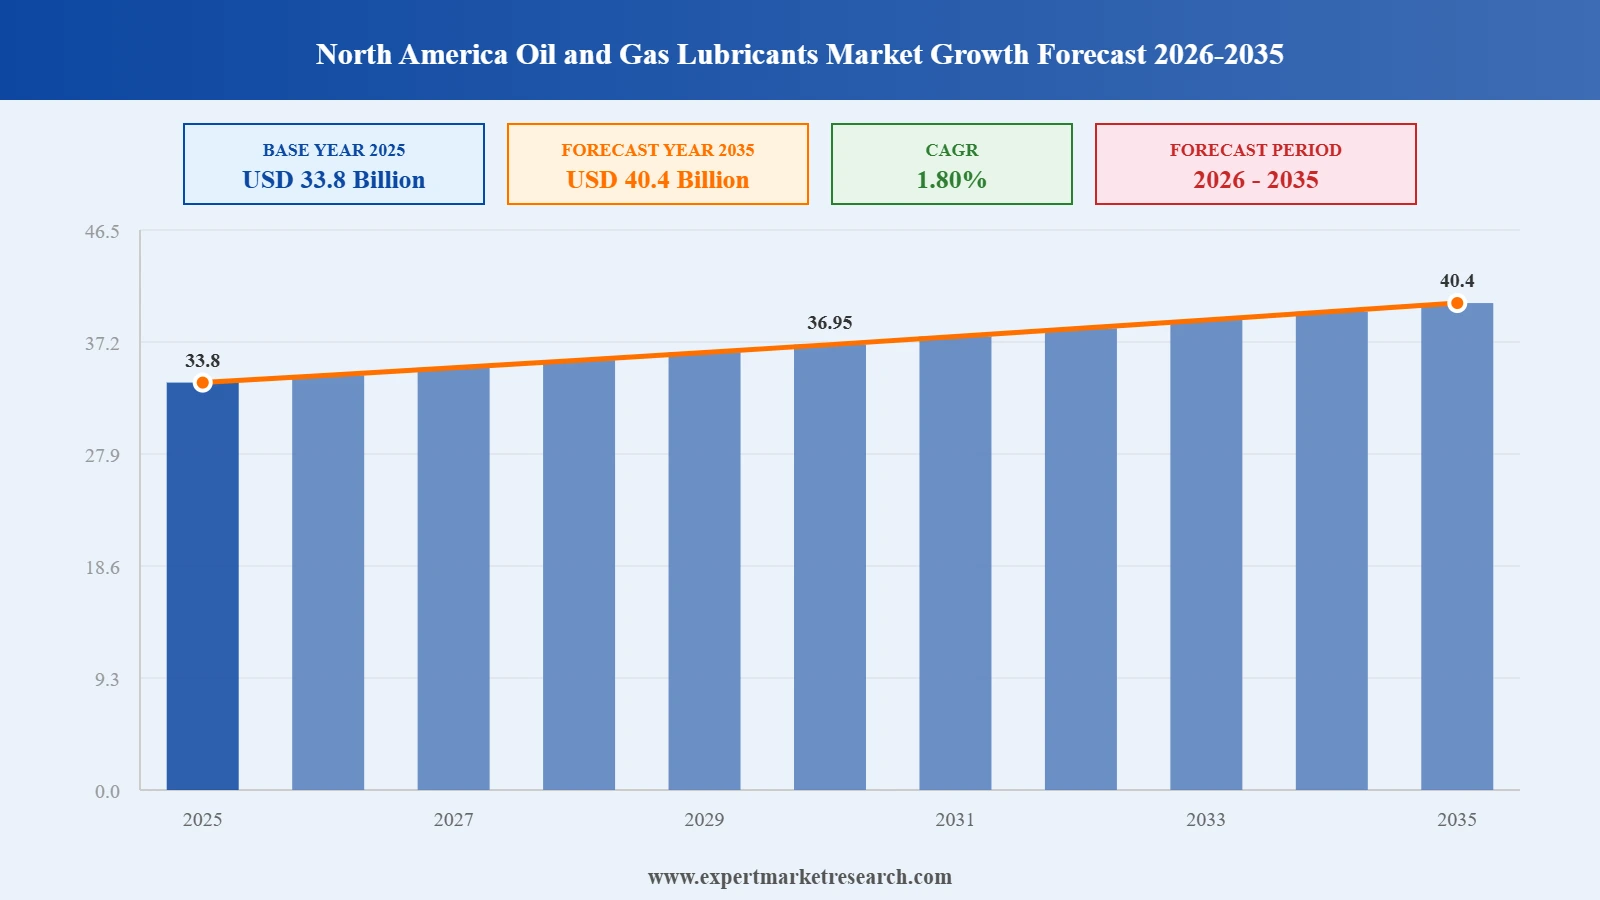
The North America oil and gas lubricants market size reached USD 33.80 Billion in 2025. The market is expected to grow at a CAGR of 1.80% between 2026 and 2035, reaching almost USD 40.40 Billion by 2035.
Read more about this report - REQUEST FREE SAMPLE COPY IN PDF
North America’s demand for lubricants is expected to surge, primarily driven by the automotive and industrial sectors, which collectively hold a substantial 90% market share. However, growth in the automotive sector may face constraints due to evolving emission regulations and the rise of electric vehicles. Nevertheless, aerospace and marine applications present lucrative opportunities, attracting leading manufacturers and presenting growth opportunities for the oil and gas lubricants market in North America.
Intense competition has spurred strategic asset divestments and investments in upstream operations. Premium lubricants are forecasted to steer market expansion, with companies forging alliances and investing in product innovation to bolster their market presence. High-value engine oils and synthetic formulations are anticipated to witness increased demand owing to evolving standards and regulations. Aviation and marine segments, though smaller, are expected to grow robustly due to their high-profit margins.
The lubricant industry is experiencing a shift towards bio-based products, driven by environmental regulations and consumer awareness, particularly in North America. The rise of electric vehicles may impact aftermarket lubricant sales, prompting manufacturers to explore OEM components and services for new growth avenues. Consumer emphasis on vehicle performance and the introduction of premium products are fuelling lubricant consumption.
Read more about this report - REQUEST FREE SAMPLE COPY IN PDF
The North America oil and gas lubricants market is expected to witness revival, buoyed by growing interest in unconventional reserves and technological advancements enhancing well production rates. However, volatile crude oil prices pose a challenge, albeit offset by opportunities in offshore exploration and the shale revolution in North America, which has transformed the region's energy landscape through technological innovations in drilling and fracking.
North America Oil and Gas Lubricants Market Report and Forecast 2026-2035 offers a detailed analysis of the market based on the following segments:
Market Breakup by Product Type
Market Breakup by Location
Market Breakup by Sector
Market Breakup by Region
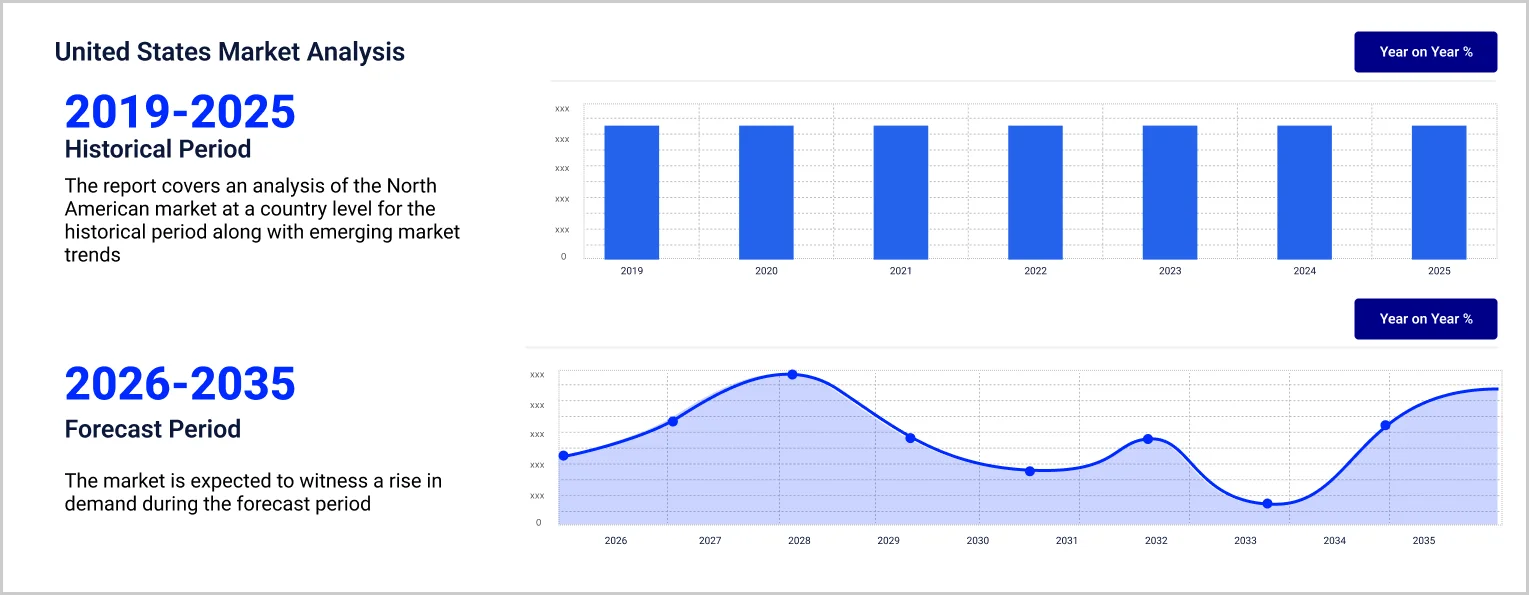
Read more about this report - REQUEST FREE SAMPLE COPY IN PDF
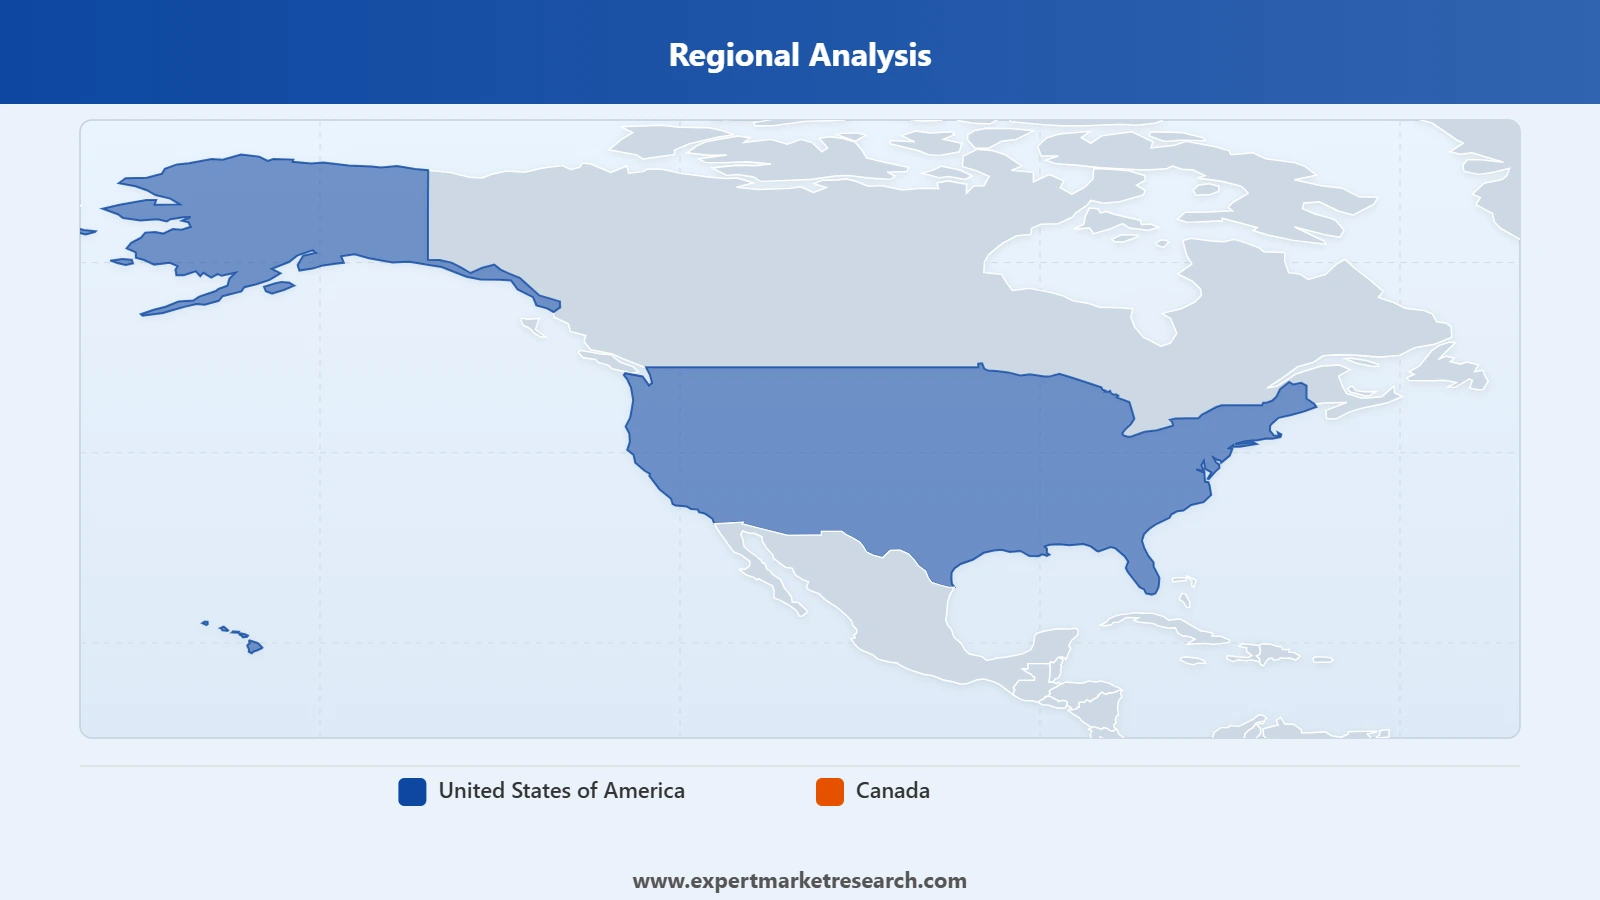
United States
The United States accounts for the dominant share of regional demand, driven by shale production in the Permian Basin, Eagle Ford, Bakken, and Appalachian plays, where hydraulic fracturing fleets and drilling rigs consume high volumes of engine oils and hydraulic fluids. Deepwater Gulf of Mexico operations, regulated by the Bureau of Safety and Environmental Enforcement, generate demand for high-specification and environmentally acceptable products. Gulf Coast refining and petrochemical capacity supports downstream turbine and compressor oil consumption, while expanding LNG export terminals and interstate pipeline compression add midstream demand.
Canada
Canada's demand profile is distinctive because of the Alberta oil sands, where mining operations run haul trucks, shovels, and draglines that are among the most lubricant-intensive equipment in the industry. Extreme cold in Alberta, Saskatchewan, and northern operating areas requires low-temperature and synthetic formulations with reliable cold-start performance. Unconventional gas development in the Montney and Duvernay, offshore production off Newfoundland and Labrador, and pipeline infrastructure regulated by the Canada Energy Regulator round out demand. The country also hosts significant domestic supply through the Petro-Canada Lubricants business now owned by HF Sinclair.
Read more about this report - REQUEST FREE SAMPLE COPY IN PDF
Competition in North America oil and gas lubricants is unusual in that the largest suppliers also operate in the industry they serve, giving integrated majors an advantage in base oil integration and existing operator relationships, while specialists compete on technical service and extreme-duty formulations. Because a gearbox failure on a rig or platform costs far more than the lubricant itself, purchasing turns on OEM approvals, field support, and oil analysis programmes rather than price per litre. The key players are analysed below on their product portfolios, technical service capability, and sector positioning.
Exposure to the drilling cycle is the central challenge. Lubricant volumes track rig counts and completion activity, so crude and natural gas price swings translate quickly into demand volatility, making capacity planning and inventory management difficult for suppliers. Operating conditions add technical difficulty, with products required to perform across Arctic Canadian temperatures, Gulf of Mexico humidity, and abrasive, high-load environments.
Extended drain intervals and efficiency gains act as restraints on volume growth, which the 1.80% CAGR reflects. Higher performing synthetics reduce the quantity of lubricant consumed per unit of equipment operating time, while operational efficiency in shale drilling means more output from fewer rig days. Base oil price volatility and long OEM approval cycles further constrain supplier flexibility.
Premiumisation and environmental formulations present the clearest opportunities. Value growth is available through synthetic and specialty products, condition monitoring and oil analysis services, and reliability contracts that shift suppliers from commodity sales toward service relationships. Environmentally Acceptable Lubricants for offshore work, LNG export infrastructure, and Canadian oil sands mining equipment offer additional avenues.


Upto 15% Off
USD
$2499 $2249
$3999 $3599
$4999 $4249
$5999 $5099


*While we strive to always give you current and accurate information, the numbers depicted on the website are indicative and may differ from the actual numbers in the main report. At Expert Market Research, we aim to bring you the latest insights and trends in the market. Using our analyses and forecasts, stakeholders can understand the market dynamics, navigate challenges, and capitalize on opportunities to make data-driven strategic decisions.*
The market is estimated to be valued at USD 33.80 Billion in 2025.
The market is projected to grow at a CAGR of 1.80% between 2026 and 2035.
The oil and gas lubricants market is expected to reach USD 40.40 Billion in 2035.
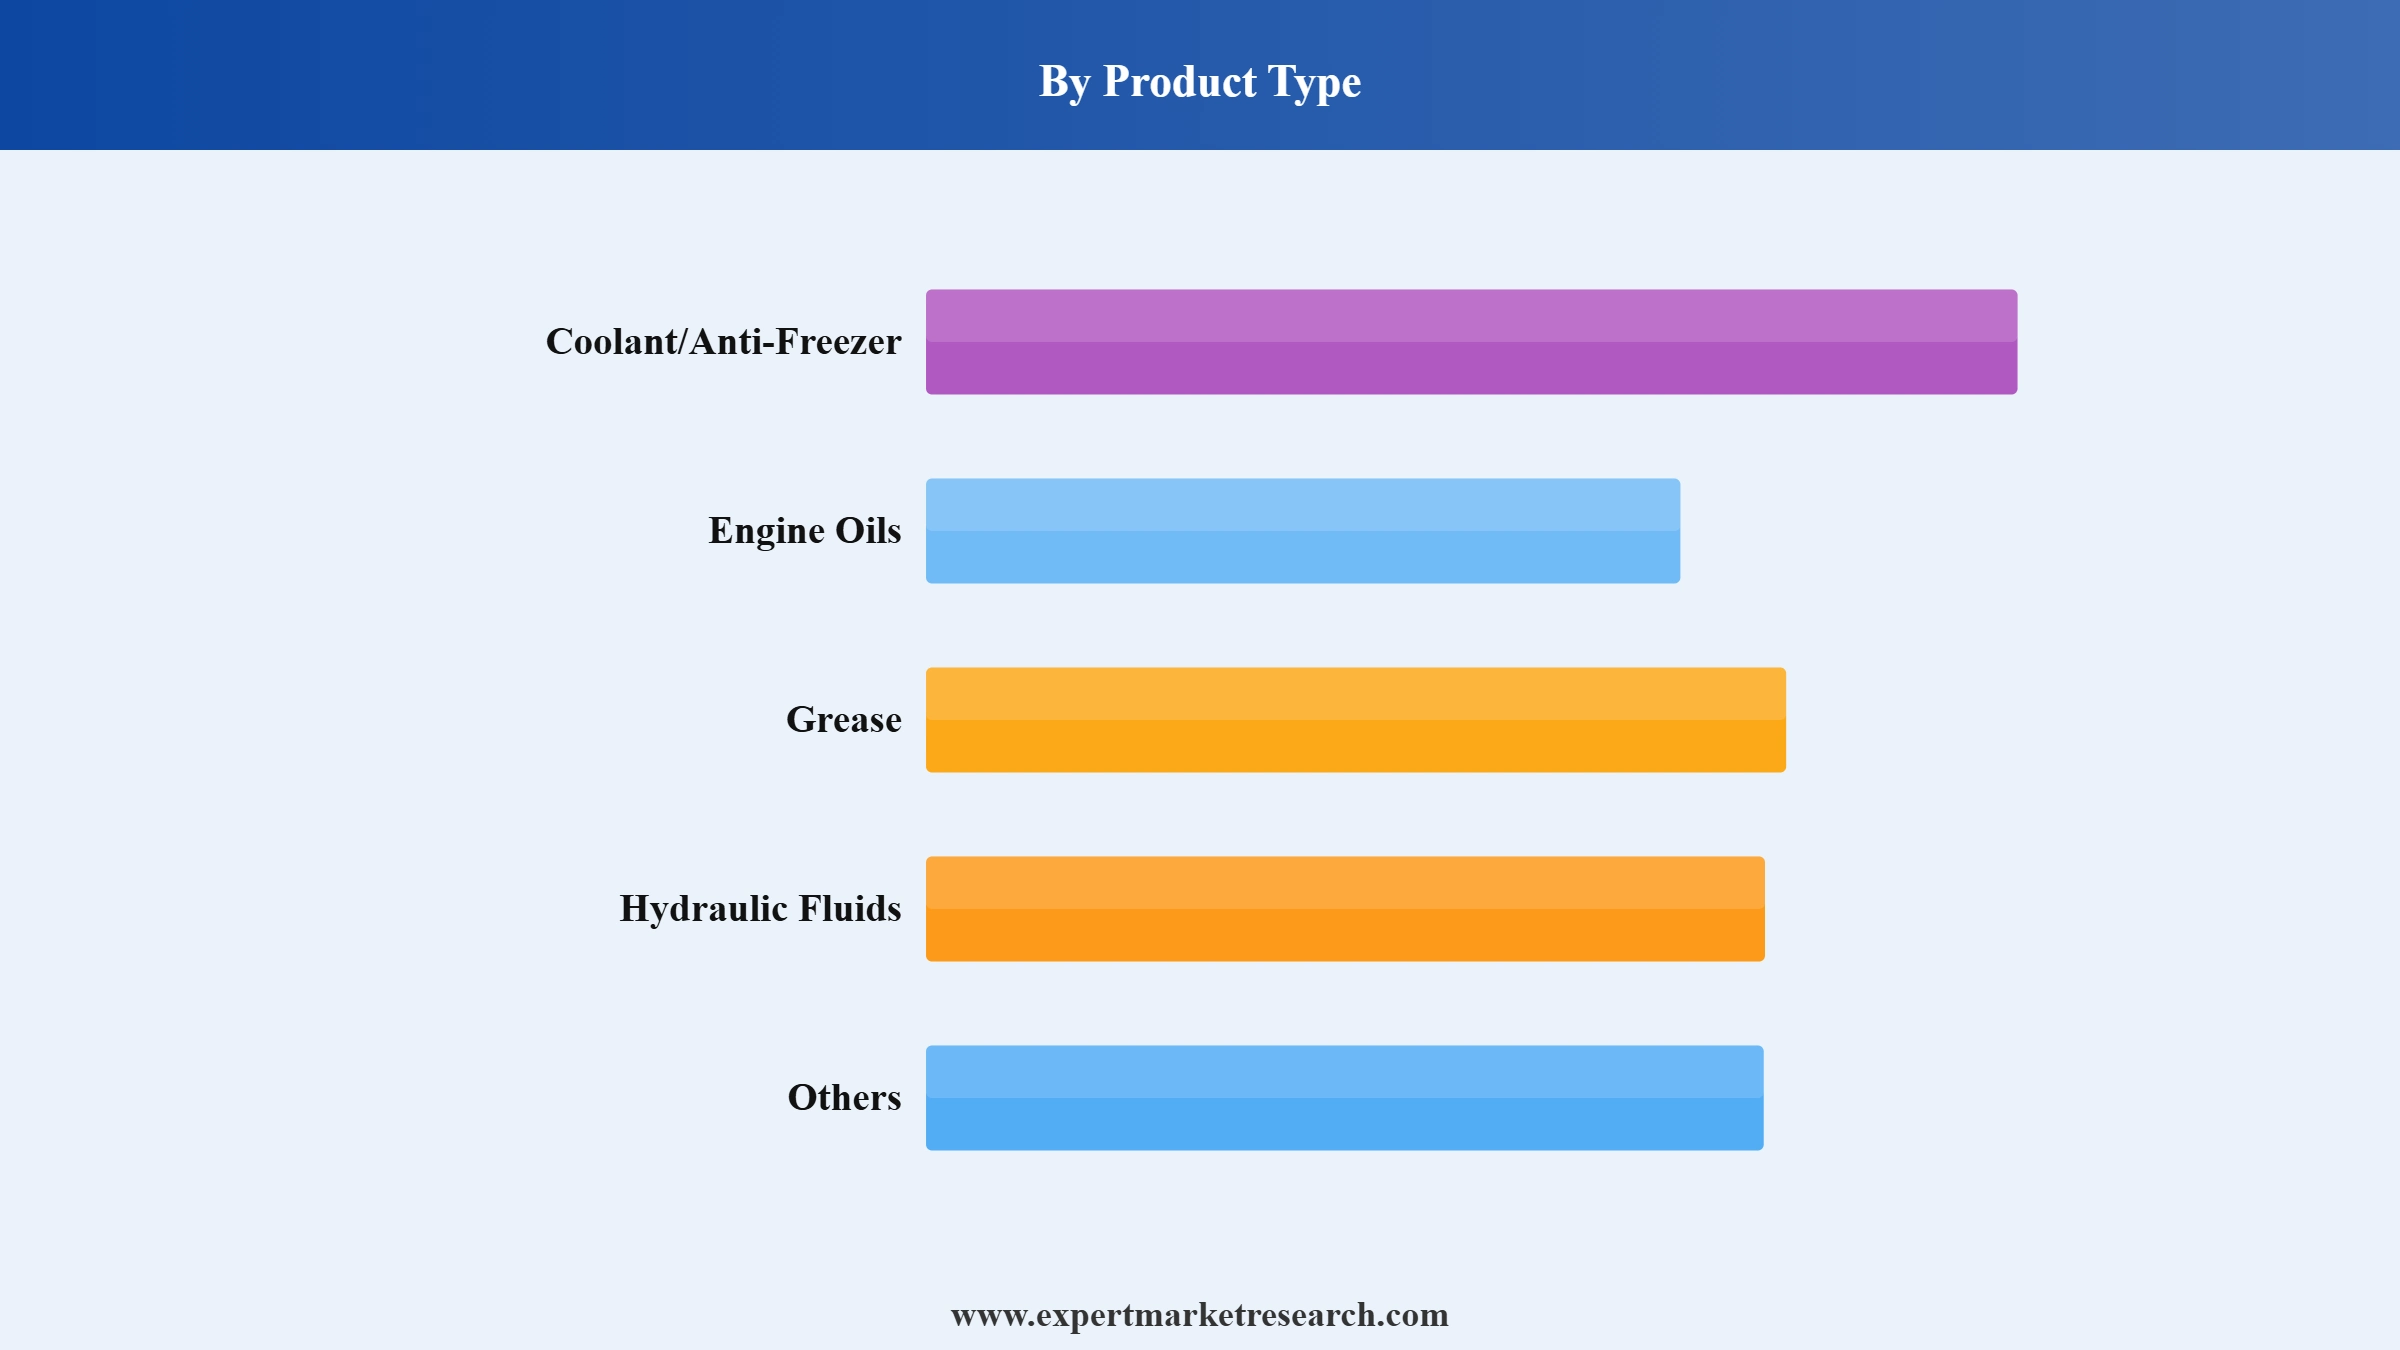
The market is categorised according to its product type, which includes coolant/anti-freezer, engine oils, grease, hydraulic fluids and others.
The key market players are BP Plc (Castrol), Shell Plc, TotalEnergies SE, Exxon Mobil Corporation, 3M Co., Lubrication Engineers, Inc., Kluber Lubrication Munchen GmbH & Co. KG, HF Sinclair Corp. (Petro-Canada Lubricants LLC), Schlumberger N.V., Valvoline Inc., and others.
The market is driven by factors that include rising demand from the automotive and industrial sectors, aerospace industry and increasing product innovations in the market, among others.
The market is categorised according to its sector, which includes upstream, midstream, and downstream.
The United States stands as the global leader in the lubricants market. As of 2025, the market volume in the U.S. reached an estimated 6.85 million metric tons, slightly surpassing China's volume of 6.75 million metric tons.
Explore our key highlights of the report and gain a concise overview of key findings, trends, and actionable insights that will empower your strategic decisions.
| REPORT FEATURES | DETAILS |
| Base Year | 2025 |
| Historical Period | 2019-2025 |
| Forecast Period | 2026-2035 |
| Scope of the Report |
Historical and Forecast Trends, Industry Drivers and Constraints, Historical and Forecast Market Analysis by Segment:
|
| Breakup by Product Type |
|
| Breakup by Location |
|
| Breakup by Sector |
|
| Breakup by Region |
|
| Market Dynamics |
|
| Competitive Landscape |
|
| Companies Covered |
|
Datasheet
One User
USD 2,499
USD 2,249
tax inclusive*
Single User License
One User
USD 3,999
USD 3,599
tax inclusive*
Five User License
Five User
USD 4,999
USD 4,249
tax inclusive*
Corporate License
Unlimited Users
USD 5,999
USD 5,099
tax inclusive*
*Please note that the prices mentioned below are starting prices for each bundle type. Kindly contact our team for further details.*
Flash Bundle
Small Business Bundle
Growth Bundle
Enterprise Bundle
*Please note that the prices mentioned below are starting prices for each bundle type. Kindly contact our team for further details.*
Flash Bundle
Number of Reports: 3
20%
tax inclusive*
Small Business Bundle
Number of Reports: 5
25%
tax inclusive*
Growth Bundle
Number of Reports: 8
30%
tax inclusive*
Enterprise Bundle
Number of Reports: 10
35%
tax inclusive*
How To Order

Select License Type
Choose the right license for your needs and access rights.

Click on ‘Buy Now’
Add the report to your cart with one click and proceed to register.

Select Mode of Payment
Choose a payment option for a secure checkout. You will be redirected accordingly.
Strategic Solutions for Informed Decision-Making
Gain insights to stay ahead and seize opportunities.

Get insights & trends for a competitive edge.

Track prices with detailed trend reports.

Analyse trade data for supply chain insights.

Leverage cost reports for smart savings

Enhance supply chain with partnerships.

Connect For More Information
Our expert team of analysts will offer full support and resolve any queries regarding the report, before and after the purchase.
Our expert team of analysts will offer full support and resolve any queries regarding the report, before and after the purchase.
We employ meticulous research methods, blending advanced analytics and expert insights to deliver accurate, actionable industry intelligence, staying ahead of competitors.
Our skilled analysts offer unparalleled competitive advantage with detailed insights on current and emerging markets, ensuring your strategic edge.
We offer an in-depth yet simplified presentation of industry insights and analysis to meet your specific requirements effectively.




