

Consumer Insights
Uncover trends and behaviors shaping consumer choices today
Procurement Insights
Optimize your sourcing strategy with key market data
Industry Stats
Stay ahead with the latest trends and market analysis.
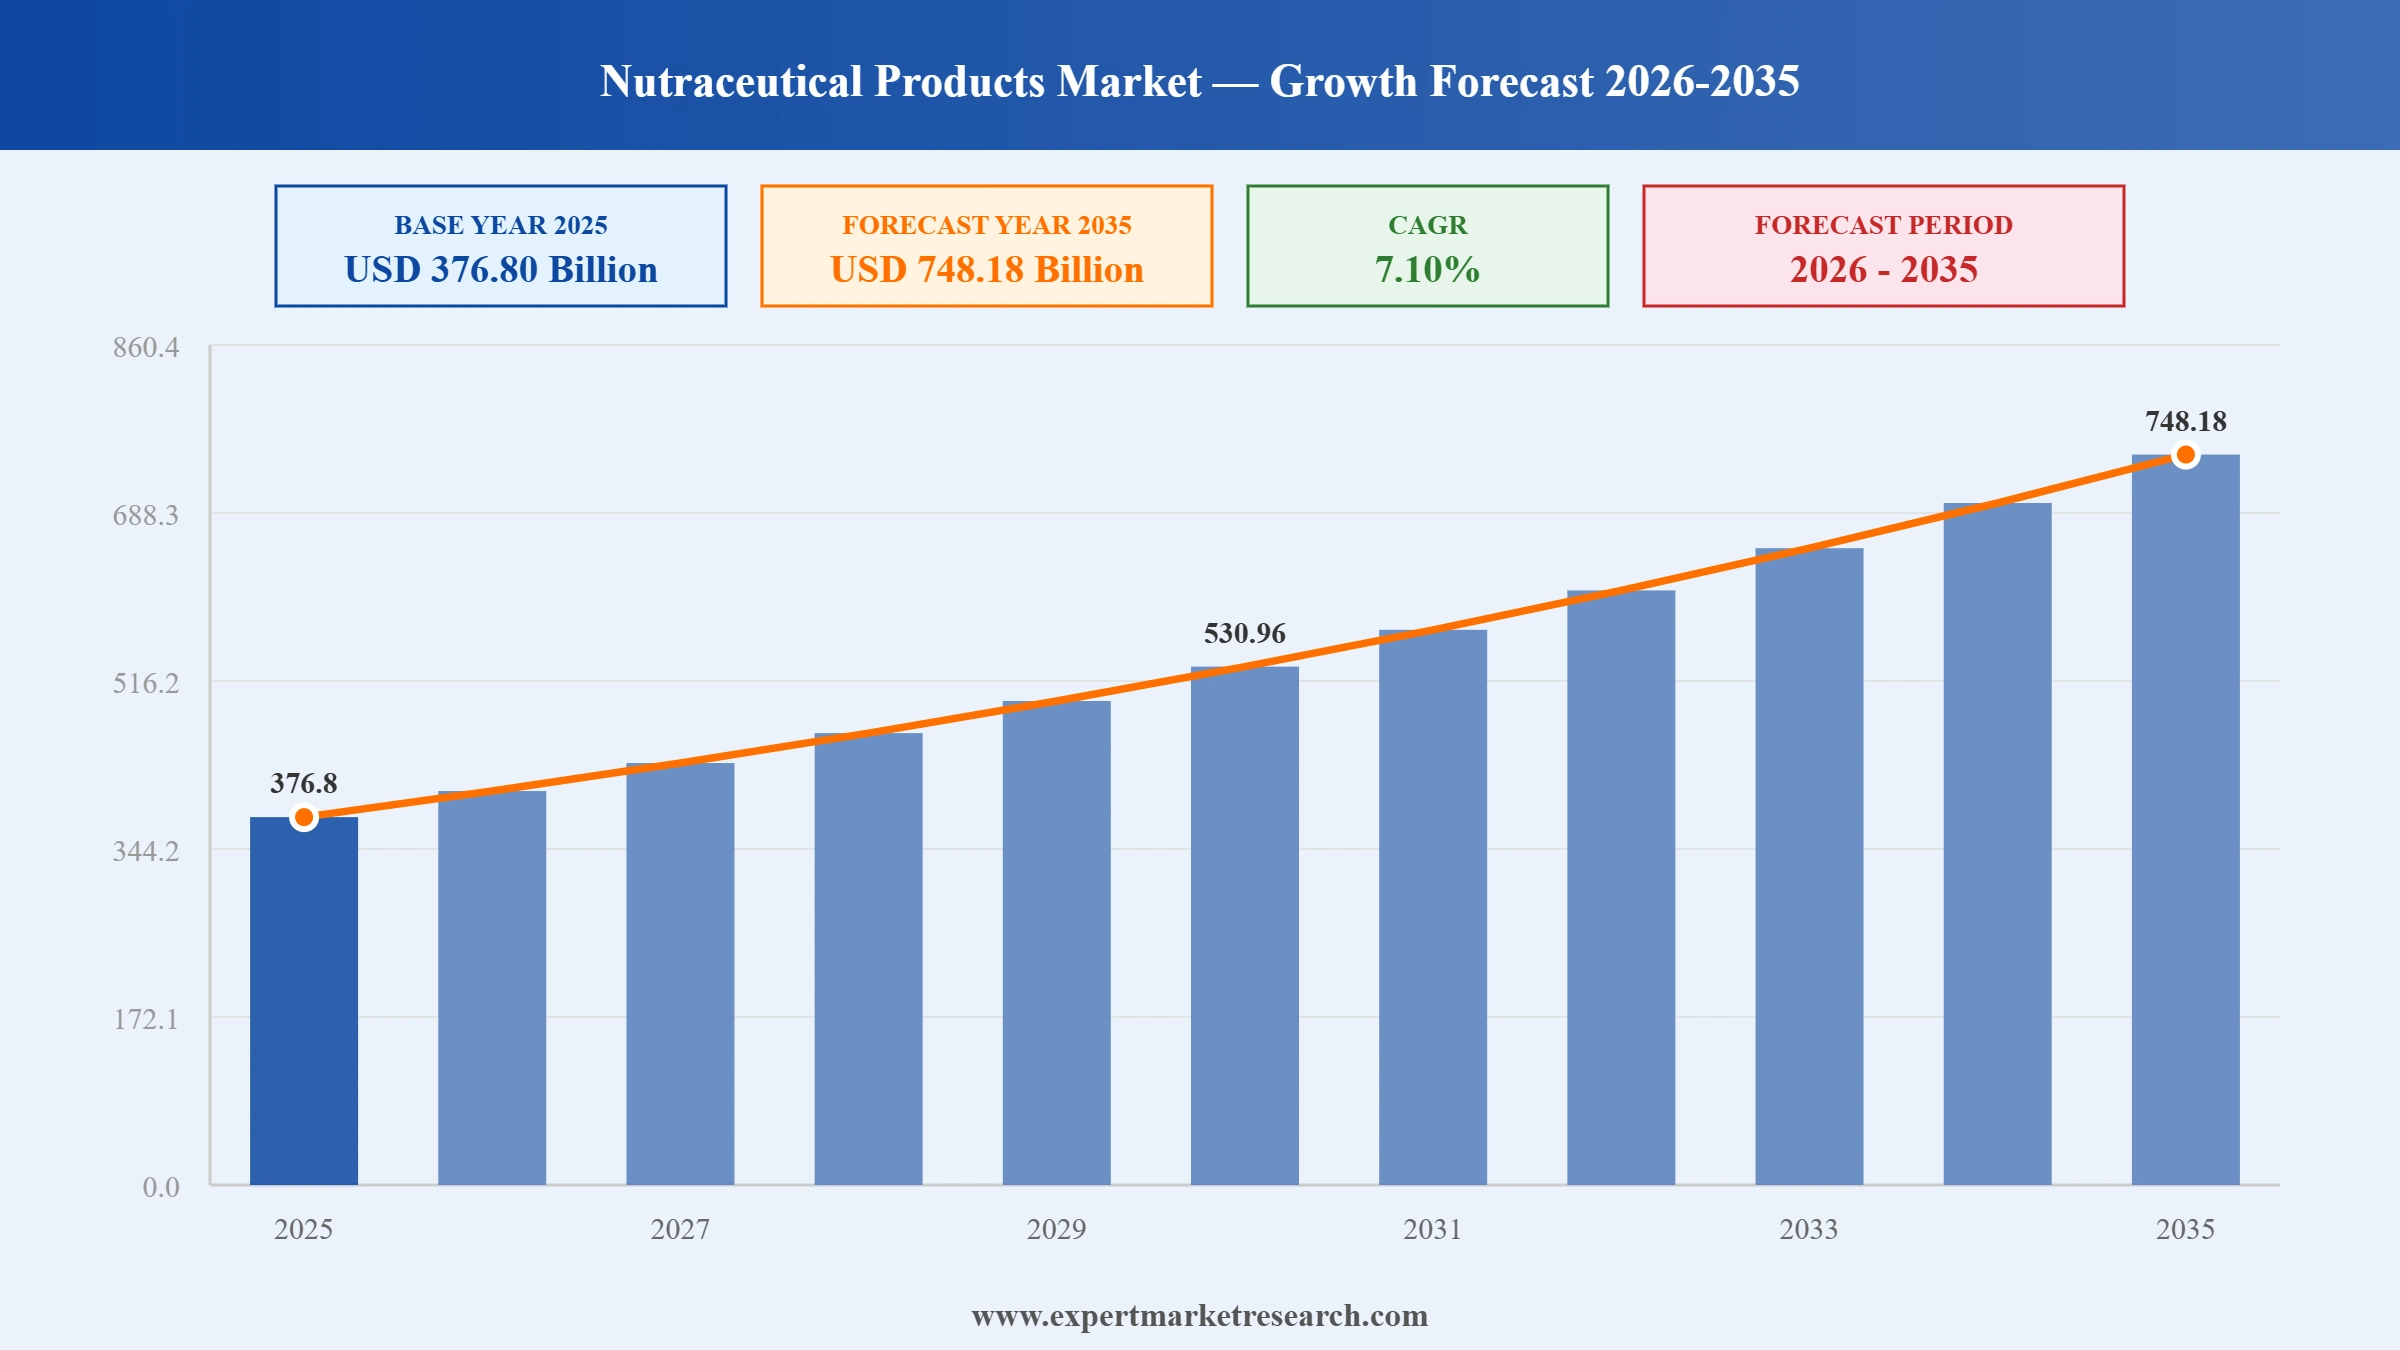
The nutraceutical products market was valued at USD 376.80 Billion in 2025. It is poised to grow at a CAGR of 7.10% during the forecast period of 2026-2035, and reach USD 748.18 Billion by 2035. The market growth is driven by the increasing consumer preference for preventive healthcare, functional foods, and dietary supplements. The rising adoption of personalized nutrition, clean-label formulations, and scientifically backed nutraceutical products is expected to support market expansion.
Read more about this report - REQUEST FREE SAMPLE COPY IN PDF
Nutraceutical products continue to gain prominence as consumers increasingly prioritize preventive healthcare, wellness, and nutrition-focused lifestyles. The growing awareness of the benefits of functional foods, beverages, and dietary supplements is driving product innovation and expanding adoption across diverse consumer groups. The market was valued at USD 376.80 Billion in 2025 and is experiencing steady growth, supported by rising health consciousness, increasing demand for personalized nutrition, and advancements in ingredient development. Expanding distribution channels, evolving consumer preferences, and greater emphasis on immunity, digestive health, and overall well-being are further contributing to market expansion worldwide.
Market Breakup by Type
Increasing consumer emphasis on preventive healthcare and long-term wellness is driving demand for nutrition-focused products that support overall health management. Continuous innovation in functional formulations, coupled with growing awareness of lifestyle-related conditions, is fostering sustained market development across diverse consumer demographics.
Market Breakup by Ingredient
Scientific advancements in nutritional ingredients and bioactive compounds are enhancing product efficacy and expanding application potential. The growing investment in research and development, along with increasing demand for evidence-based health solutions, is enabling manufacturers to introduce differentiated offerings that address specific wellness and nutritional requirements.
Market Breakup by Distribution Channel
The market is benefiting from the expansion of organized retail infrastructure and evolving consumer purchasing preferences. The greater product accessibility, improved brand visibility, and the growing influence of health-focused retail environments are strengthening market reach and facilitating broader adoption of nutraceutical solutions.
Market Breakup by Region
Favorable demographic trends, rising disposable incomes, and increasing health awareness are supporting market growth across key geographic regions. Additionally, ongoing investments in nutritional innovation, supportive regulatory frameworks, and expanding consumer acceptance of functional health products are creating significant opportunities for industry expansion.


Read more about this report - REQUEST FREE SAMPLE COPY IN PDF
| Analysis Type | Factors | Example |
| Market Drivers | Rising demand for hydration-focused nutraceuticals driven by preventive healthcare awareness, wellness trends, and increasing climate-related health concerns. | In July 2025, Otsuka launched POCARI SWEAT in India, expanding hydration-focused nutraceutical beverage adoption and consumer trust. |
| Market Restraints | Regulatory complexity, inconsistent quality standards, and varying labeling requirements increase compliance costs and hinder international expansion. | Different regulatory frameworks across countries delay product approvals, increase operational costs, and limit market entry opportunities. |
| Market Opportunities | Growing consumer preference for clinically validated nutraceuticals encourages research investments, innovation, and evidence-based product development. | In January 2026, ClostraBio completed enrollment for a probiotic clinical study and expanded distribution through the Maypro partnership. |
The following section outlines the key factors influencing market growth, including major drivers, restraints, and emerging opportunities.
Rising Demand for Hydration-Focused Nutraceuticals to Accelerate the Market Value
The growing awareness of preventive healthcare and hydration-driven wellness is a key driver of the market. In July 2025, Otsuka Pharmaceutical Co., Ltd. launched POCARI SWEAT in India, highlighting rising demand for electrolyte-balanced nutraceutical beverages amid increasing heat stress and climate-related health concerns. The launch reflects shifting consumer preferences toward scientifically formulated products that support daily hydration, physical activity, and heat resilience. Expanding retail availability and localized production strategies further strengthen accessibility and adoption. Such innovations and geographic expansions continue to reinforce consumer trust, supporting sustained market growth worldwide.
Regulatory Complexity and Product Quality Variability Limit Market Expansion
The market faces challenges due to varying regulatory frameworks, inconsistent quality standards, and differences in labeling requirements across countries. These factors create barriers for manufacturers seeking international expansion, increase compliance costs, and may reduce consumer confidence in product efficacy and safety. In addition, the absence of harmonized regulations for nutraceutical ingredients and health claims can delay product approvals and market entry. As a result, these challenges may restrict innovation, commercialization, and overall market growth.
Rising Demand for Clinically Supported Probiotics Strengthens Market Potential
The growing consumer preference for scientifically validated nutraceutical products is creating significant growth potential for the market. Increasing awareness of gut health, preventive healthcare, and evidence-based nutrition is encouraging manufacturers to invest in advanced research and product innovation. For instance, in January 2026, ClostraBio fully enrolled a placebo-controlled clinical study for its next-generation probiotic CLB101™ and expanded its commercial reach through a distribution partnership with Maypro. This development highlights the increasing emphasis on clinically supported nutraceutical ingredients, which is expected to enhance consumer trust, accelerate product adoption, and support long-term market expansion.
Growing Strategic Consolidation is Likely to Strengthen the Nutraceutical Distribution Networks and Improve the Market Growth
The strategic acquisitions are emerging as a key trend, enhancing market value by strengthening nutraceutical distribution and innovation capabilities. Companies are increasingly expanding regional footprints to access specialized expertise and diversified ingredient portfolios. For instance, in April 2025, Azelis strengthened its nutraceutical presence in Spain through the acquisition of Solchem Nature S.L., a well-established distributor with deep market reach and premium ingredient offerings. Such moves improve product accessibility, broaden customer bases, and support sustainable innovation. This consolidation-driven approach is expected to accelerate product development and contribute steadily to overall market growth.
Protein and Amino Acids Segment is Poised to Lead the Market by Type
By ingredient, the market is segmented into proteins and amino acids, probiotics, phytochemicals and plant extracts, fibers and specialty carbohydrates, omega-3 fatty acids, vitamins, prebiotics, carotenoids, minerals, and others. Among these, protein and amino acids are expected to lead due to their extensive use in sports nutrition, weight management, and medical nutrition applications. The growing consumer awareness regarding muscle health, physical performance, and balanced diets is a major growth driver for this segment. Its wide acceptance across diverse demographics and product formulations supports sustained demand and long-term market leadership.

Read more about this report - REQUEST FREE SAMPLE COPY IN PDF
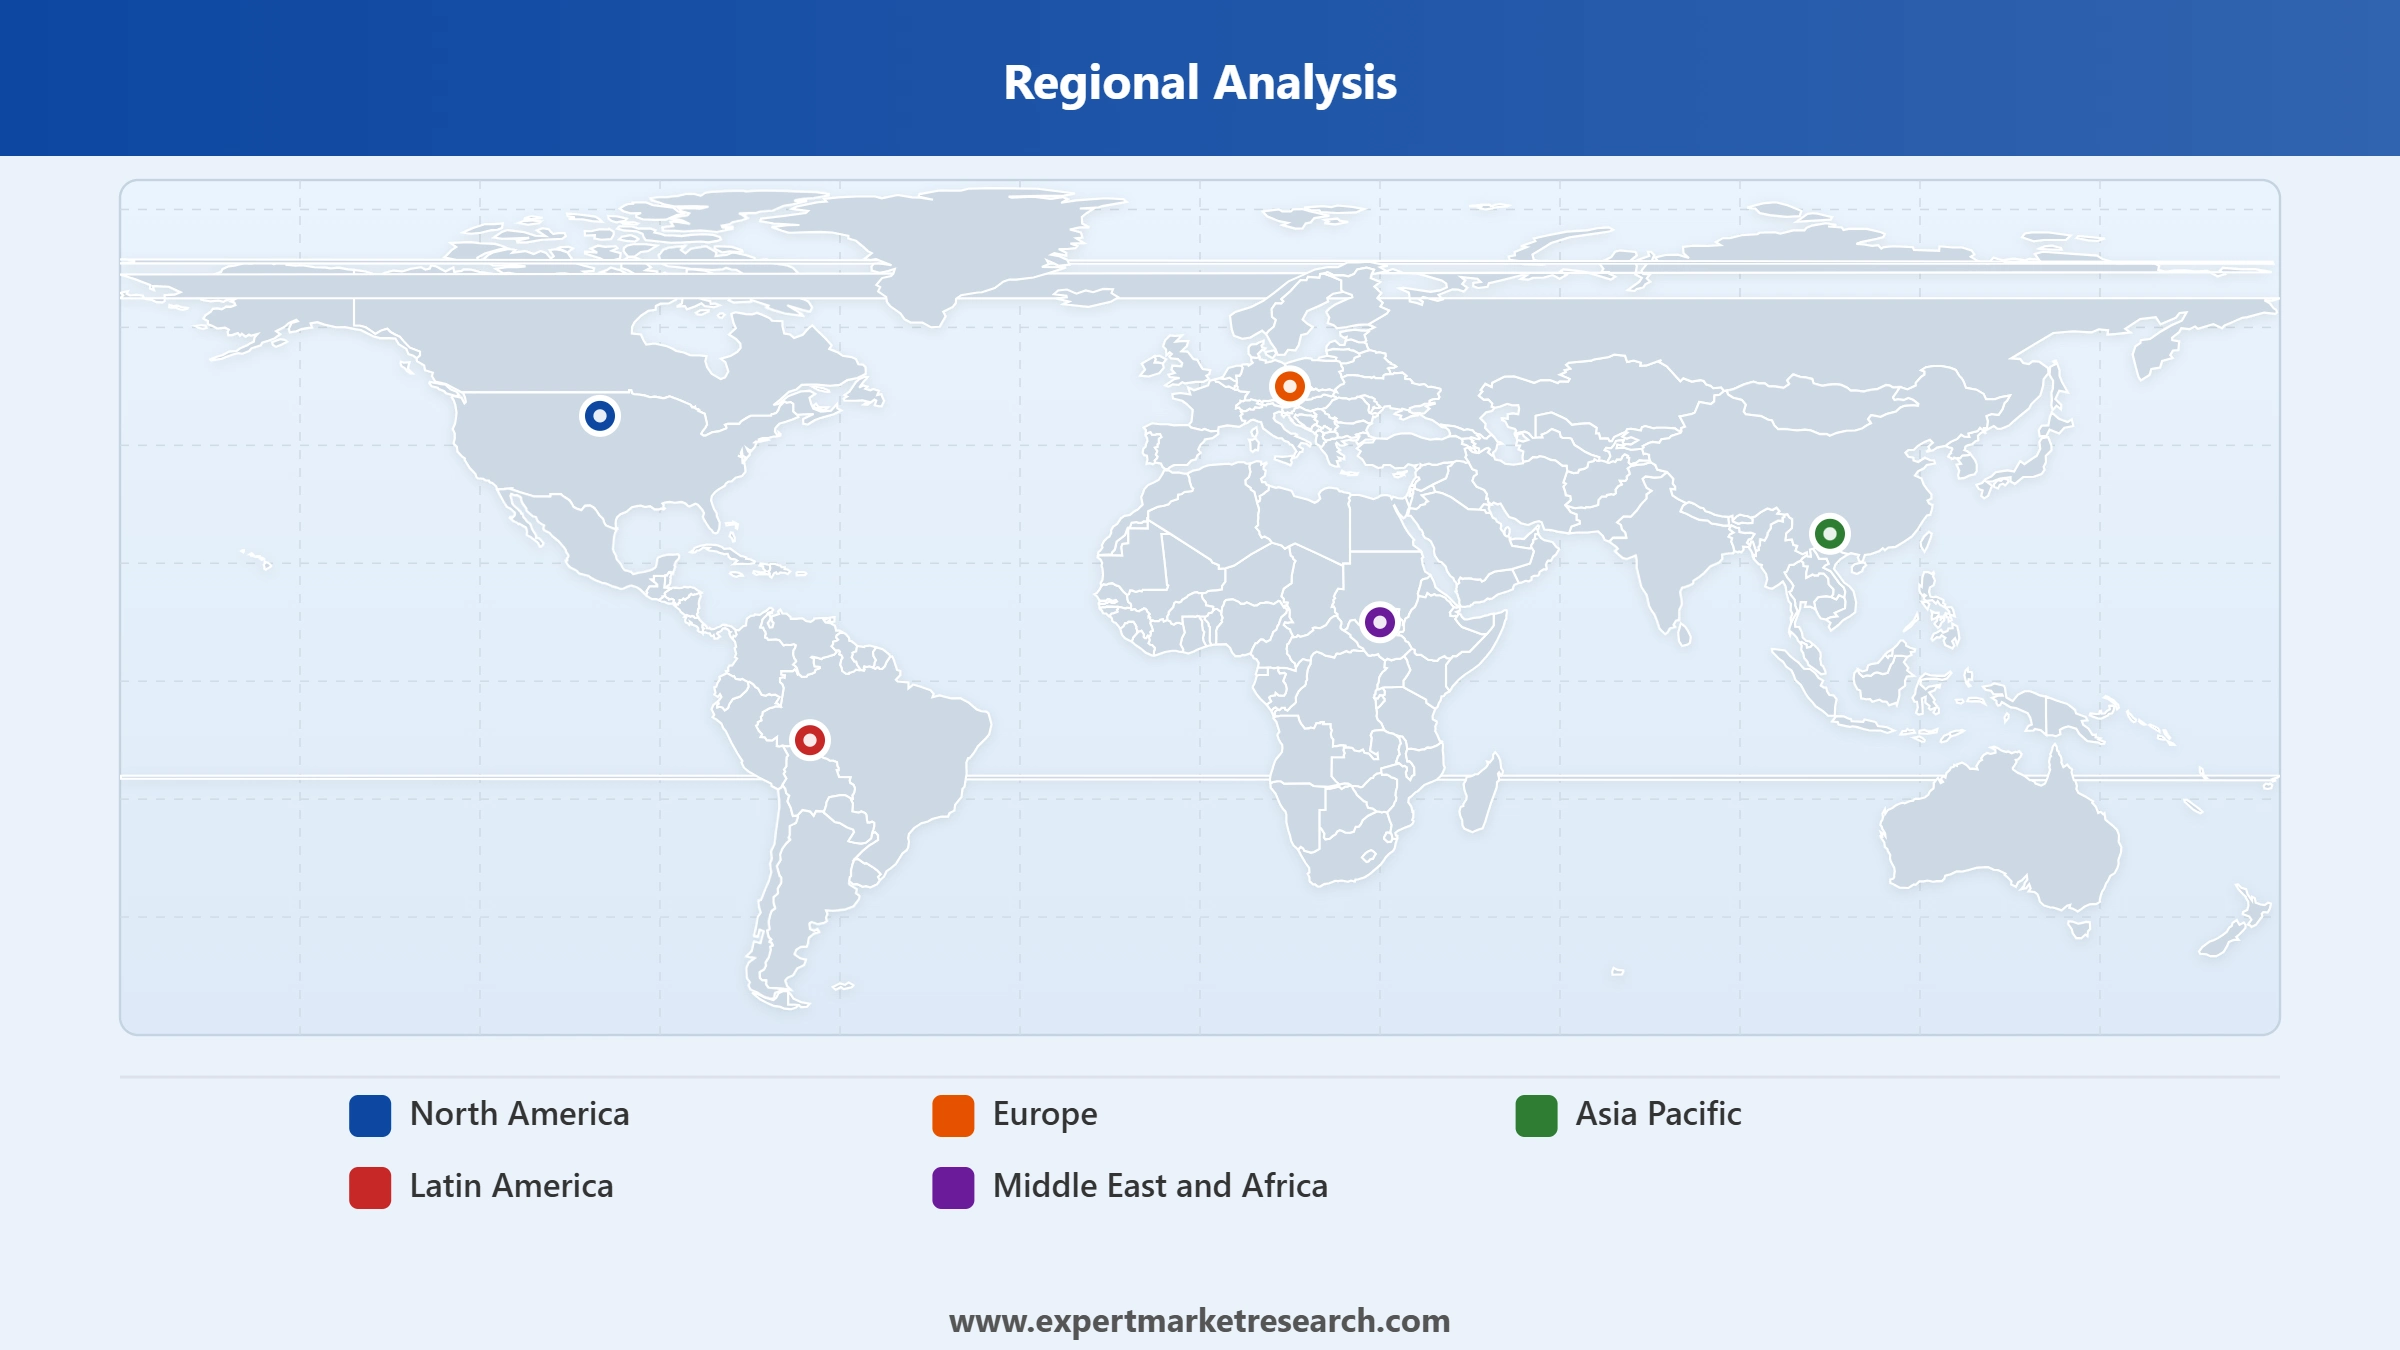
The regions included in the report are North America, Europe, Asia Pacific, Latin America, and Middle East and Africa. Among these, North America leads the market due to high consumer awareness of preventive healthcare, strong demand for functional foods and dietary supplements, advanced retail and e-commerce distribution networks, and continuous product innovation. The region also benefits from a well-established regulatory framework and significant investments in nutrition research and development. Growing consumer preference for health-focused products, combined with increasing adoption of personalized nutrition solutions, continues to strengthen North America's leading position in the market.
Read more about this report - REQUEST FREE SAMPLE COPY IN PDF
The key features of the market report comprise patent analysis, funding and investment analysis, and strategic initiatives by the leading players. The major companies in the market are as follows:
Amway Corporation is a leading participant in the market through its Nutrilite brand, which offers a broad portfolio of nutritional supplements and functional wellness products. Its product range includes Echinacea-Citrus Concentrate Plus, Kids Chewable Acerola C, Ginseng Cherry Plus, Concentrated Fruits and Vegetables, and Calcium, Vitamin D, and Vitamin K2 Gummies. By focusing on scientifically formulated vitamins, minerals, herbal supplements, and wellness nutrition, Amway strengthens its position in the growing nutraceutical sector and supports consumer demand for preventive health and nutritional supplementation.
Nestlé S.A. is actively involved in the market through its nutrition-focused business initiatives and science-based health solutions. The acquisition of CM&D Pharma expanded its portfolio of specialized nutritional products, including Fostrap, Recoclix, and Eviendep, developed for specific health conditions. Through its emphasis on medical nutrition and condition-specific dietary products, Nestlé combines nutritional science with healthcare innovation, reinforcing its presence in the nutraceutical industry and addressing the growing demand for targeted nutritional support.
Akums Drugs and Pharmaceuticals Limited is a prominent nutraceutical manufacturer offering comprehensive product development and contract manufacturing services. Its portfolio includes immunity builders, multivitamins, omega supplements, protein powders, probiotics, collagen products, sports nutrition formulations, and gummies. Supported by advanced manufacturing capabilities and regulatory-compliant formulations, the company enables brands to deliver high-quality nutraceutical products. Its focus on innovation, customized solutions, and diverse dosage forms strengthens its contribution to the expanding nutraceutical products market.
Associated Biotech Private Limited is a recognized nutraceutical manufacturing company specializing in dietary supplements, vitamins, minerals, protein powders, and herbal formulations. The company provides third-party manufacturing services and customized product solutions that meet industry quality and regulatory standards. With advanced manufacturing infrastructure and expertise in nutraceutical formulations, Associated Biotech supports brands in developing wellness-focused products, contributing to the growth of the market and the increasing consumer preference for preventive healthcare solutions.
Other key players in the market are Ve-Nutra Pharma, Zim Laboratories Limited, Otsuka Pharmaceutical Co., Ltd., Hexagon Nutrition Ltd., DSM-Firmenich AG, and Lifecare Neuro Products Limited.
*Please note that this is only a partial list; the complete list of key players is available in the full report. Additionally, the list of key players can be customized to better suit your needs.*
This report is developed through a robust mixed-methods research design combining:
Upto 15% Off
USD
$3299 $2969
$5499 $4949
$6999 $5949
$8199 $6969


*While we strive to always give you current and accurate information, the numbers depicted on the website are indicative and may differ from the actual numbers in the main report. At Expert Market Research, we aim to bring you the latest insights and trends in the market. Using our analyses and forecasts, stakeholders can understand the market dynamics, navigate challenges, and capitalize on opportunities to make data-driven strategic decisions.*
Explore our key highlights of the report and gain a concise overview of key findings, trends, and actionable insights that will empower your strategic decisions.
| REPORT FEATURES | DETAILS |
| Base Year | 2025 |
| Historical Period | 2019-2025 |
| Forecast Period | 2026-2035 |
| Scope of the Report |
Historical and Forecast Trends, Industry Drivers and Constraints, Historical and Forecast Market Analysis by Segment:
|
| Breakup by Type |
|
| Breakup by Ingredient |
|
| Breakup by Distribution Channel |
|
| Breakup by Region |
|
| Market Dynamics |
|
| Supplier Landscape |
|
| Companies Covered |
|
Datasheet
One User
USD 3,299
USD 2,969
tax inclusive*
Single User License
One User
USD 5,499
USD 4,949
tax inclusive*
Five User License
Five User
USD 6,999
USD 5,949
tax inclusive*
Corporate License
Unlimited Users
USD 8,199
USD 6,969
tax inclusive*
*Please note that the prices mentioned below are starting prices for each bundle type. Kindly contact our team for further details.*
Flash Bundle
Small Business Bundle
Growth Bundle
Enterprise Bundle
*Please note that the prices mentioned below are starting prices for each bundle type. Kindly contact our team for further details.*
Flash Bundle
Number of Reports: 3
20%
tax inclusive*
Small Business Bundle
Number of Reports: 5
25%
tax inclusive*
Growth Bundle
Number of Reports: 8
30%
tax inclusive*
Enterprise Bundle
Number of Reports: 10
35%
tax inclusive*
How To Order

Select License Type
Choose the right license for your needs and access rights.

Click on ‘Buy Now’
Add the report to your cart with one click and proceed to register.

Select Mode of Payment
Choose a payment option for a secure checkout. You will be redirected accordingly.
Strategic Solutions for Informed Decision-Making
Gain insights to stay ahead and seize opportunities.

Get insights & trends for a competitive edge.

Track prices with detailed trend reports.

Analyse trade data for supply chain insights.

Leverage cost reports for smart savings

Enhance supply chain with partnerships.

Connect For More Information
Our expert team of analysts will offer full support and resolve any queries regarding the report, before and after the purchase.
Our expert team of analysts will offer full support and resolve any queries regarding the report, before and after the purchase.
We employ meticulous research methods, blending advanced analytics and expert insights to deliver accurate, actionable industry intelligence, staying ahead of competitors.
Our skilled analysts offer unparalleled competitive advantage with detailed insights on current and emerging markets, ensuring your strategic edge.
We offer an in-depth yet simplified presentation of industry insights and analysis to meet your specific requirements effectively.


