

Consumer Insights
Uncover trends and behaviors shaping consumer choices today
Procurement Insights
Optimize your sourcing strategy with key market data
Industry Stats
Stay ahead with the latest trends and market analysis.
The global PDC drill bits market value was USD 4.78 Billion in 2025 and is projected to expand at a CAGR of 3.70% through 2035. The market is further expected to achieve USD 6.87 Billion by 2035. One of their main features are the PDC (polycrystalline diamond compact) bits which are able to provide high rate of penetration (ROP) together with high wear resistance in abrasive rock formations and low non-productive time. The outstanding performance of PDC bits in horizontal, directional and deep wells is the reason why they are the most important tools for extracting unconventional resources such as tight oil, shale gas and deepwater reservoirs.
The end-use efficiency is being further improved by the advancements that are made in the cutter design, matrix body construction, and thermal-stable diamond compacts. For instance, the Baker Hughes “Talon” family series of PDC drill bits features locally modified cutter design, optimized matrix-body construction, and thermally stable diamond compacts to enhance drilling efficiency and bit life. PDC drill bits are becoming more and more important as the global energy demand is getting higher and more unconventional drilling is being done, thus giving the possibility to operators to optimize cost, speed, and reliability in difficult environments, and thereby propelling the growth of the PDC drill bits market.
The demand is also supported by higher worldwide investments in upstream oil and gas exploration, the extension of deep-water and unconventional drilling programs, as well as a general move towards cost-effective, high-performance drilling tools. These are all trends that are being supported by increased CAPEX in the energy sectors and by the quicker adoption of advanced drilling technologies. For example, in July 2022, Halliburton's introduction of its Hedron PDC drill bit platform is a case in point of how the increase in global spending on the upstream sector is a driver of the demand for high-performance drilling tools. These bits use advanced cutter design and in bit sensing to deliver better durability and efficiency. Thus they are the ones that are most suitable for the growing deep water and unconventional drilling programs.
Compound Annual Growth Rate
3.7%
Value in USD Billion
2026-2035
Read more about this report - REQUEST FREE SAMPLE COPY IN PDF
Epiroc has revealed its new generation PCD drill bits made to withstand extreme wear and offer high accuracy. New bits are equipped with a diamond-protected cutting structure and a metal-reinforced body designed for high-precision drilling in abrasive ground conditions, thus they can be kept in use for a few times longer as compared with conventional carbide bits. The reduction of drilling time and the cutting down of bit-change frequency as well as of total drilling costs globally are some of the benefits that the company highlights to be achieved as a result of the launch.
Badr El Din Petroleum Company (BAPETCO) has recently introduced Egypt's first locally manufactured 17.5-inch drill bit, which represents a major milestone in the country's oil and gas drilling industry. The company also announced better results after testing a refurbished bit, emphasizing the advantages of cost saving, import reduction, creation of skilled jobs, and lessening of emissions. This innovation is just one part of a bigger trend towards local production and technological self-reliance. Such changes can boost the growth of PDC drill bit market by providing more sources of supply, lowering product prices and increasing usage in non-traditional drilling regions.
Baker Hughes won a major long-term multi-year contract from Petrobras to provide integrated well construction services at the Buzios field. The contract involves the provision of drilling services, drill bits, wireline, cementing and use of advanced field technologies for three rigs from 2025 onward. The award enhances the company's role in Brazil's deep water development and is a testament to its drilling expertise. This move indicates a potential increase in demand for high performance PDC drill bits required in large scale offshore and deep water drilling programs worldwide.
OMNI has introduced Malaysia's first domestically produced VDP PDC steel-body drill bits through a national vendor development program. The company also signed a MoU with Schlumberger to extend their collaboration to wellhead manufacturing, thereby making a significant step towards exporting Malaysian-made advanced drilling equipment to the global market. This decision will probably have a positive effect on the global PDC drill bits market by increasing high-performance, competitively priced drill bits supply and thus promoting advanced drilling tools usage in Asia and other parts of the world.
Improvements in diamond cutters and technology that can handle higher temperatures and a tougher matrix body material have been the main factors in boosting the performance of the bits, particularly those used in high-pressure and abrasives. These improvements make PDC bits able to operate in complex wells and in less time while managing to do it in a better way. The result is fewer failures and therefore fewer drillings for the same problems. Research and development efforts at various companies are pushing this trend to the next level continuously, thus bolstering the global PDC drill bits demand. One example is Baker Hughes, whose Talon and Dynamus series have moved the thermal stable cutter platform ahead by several notches. ReedHycalog, a business segment of NOV, continues producing newer and newer cutting edges suitable for deeper sections. Landrill Oil Tools and Rockpecker in Xi’an are not only installing thermal-resistant technologies for their customers, but they commit themselves also to the innovation of these in order to have longer runs and more reliability, thus supporting the greater global uptake.
The boom in the development of shale gas, tight oil, and deep-water resources has caused a significant base for the application of horizontal and directional wells, in which PDC bits provide higher penetration rates and less need for bit changes. This is what makes them more economically efficient than traditional roller cone bits. Schlumberger is taking on this change through its Axe series and high-speed directional bits made for long lateral wells. Baker Hughes is supplying PDC bits engineered for shale plays all over North America. NOV’s directional drilling technology complements PDC bits for extended reach wells. Landrill and Rockpecker are producing the bits for the oncoming unconventional work in Asia and Europe. This in turn, will help overall PDC drill bits market growth.
Oil and gas operators face a strong pressure of cutting down drilling costs and reducing non-productive times. PDC bits are the instruments that meet this requirement as their higher rate of penetration and longer run life are the reasons for fewer bit trips, less downtime, and better overall project economics. Baker Hughes is using its Dynamus PDC bits to demonstrate how they can be instrumental in lowering the total cost of ownership in deep and demanding wells. NOV’s SelectShift along with related bit technologies is the solution to trip frequency reduction. Furthermore, Landrill’s long life cutters are made with the intention of uplifting the performance level of cost-sensitive operators. Rockpecker’s customised PDC bits focus on extended drilling runs, thus showing how industry-wide cost reduction goals are facilitated by increased durability and boosting the growth of the global PDC drill bits market.
Rising upstream spending in North America, the Middle East and Africa, and Asia Pacific is increasing demand for quality drilling tools such as PDC bits. Large offshore and deep water projects are the sources of the most challenging requirements for bit technology that must be capable of managing high-pressure zones and complex lithologies. For example, Schlumberger supports the major offshore programs with the advanced PDC designs integration into their drilling systems. Baker Hughes has recently been very successful in securing multi-year drilling awards in Brazil that are inclusive of the supply of PDC bits. NOV is accommodating the increasing drilling activities in the Middle East by launching new bit solutions. Landrill is also broadening the offer of drilling-related products and services in Asian markets thus contributing to the strengthening of global demand of the PDC drill bits market.
PDC bits are being leveraged in many areas besides the typical oil and gas sector. The rising geothermal development, mineral exploration, and water well drilling are all activities that need the right tools to handle tough formations and high temperatures. This has been made possible with thermally stable PDC cutters. NOV’s ReedHycalog is the source of bits for geothermal and hard rock drilling. Schlumberger’s technologies help the exploration of geothermal in areas that are looking to develop clean energy supply. Rockpecker offers the right bit solutions for mining and civil engineering projects. Landrill is producing PDC tools that are used in non oilfield projects in Asia. Such diversification is opening up the global market further and lessening the dependence on the oil and gas activity cycles.
Read more about this report - REQUEST FREE SAMPLE COPY IN PDF
The EMR’s report titled “Global PDC Drill Bits Market Report and Forecast 2026-2035” offers a detailed analysis of the market based on the following segments:
Market Breakup by Type
Key Insight: Matrix body and steel body PDC bits are becoming popular by type in the global PDC drill bits market. This is because each design fulfills different and increasing drilling requirements. Matrix body bits are chosen for deep water, abrasive and high pressure formations, thus boosting the global PDC drill bits market opportunities. For instance, due to their erosion resistant structure, they can be used with long runs in harsh conditions. Steel body bits are gaining ground with an improved cutter placement and stronger alloys, which means that operators get a faster penetration and an easier repair for cost-sensitive projects. In addition, companies like Baker Hughes, NOV, Landrill, Rockpecker, and Schlumberger are currently offering both types. Thus, operators can match bit design with specific well challenges and get an overall drilling efficiency improvement.
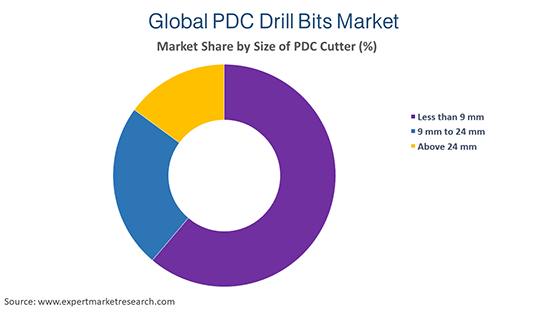
Market Breakup by Size of PDC Cutter
Key Insight: PDC cutter size preferences are becoming different for different companies as they are optimising bit behaviour for various drilling environments. Cutters less than 9 mm are increasingly being used in high-speed drilling and interbedded formations because they provide better stability and less vibration. The 9 to 24 mm segment remains the dominant choice since it balances durability and penetration rate for most shale, offshore and onshore wells. Above 24 mm cutters are becoming more popular in hard rock, geothermal and deep section drilling where large contact areas help to increase wear resistance. Prominent suppliers like Baker Hughes, NOV, Landrill and Rockpecker are proactively adjusting cutter sizes to meet these new demands and augment new PDC drill bits market dynamics.
Market Breakup by Number of Blades
Key Insight: Blade count trends reflect the need to balance stability, durability and drilling speed. Bits with fewer than six blades are gaining use in soft to medium formations where higher junk slot area and aggressive cutting structures support rapid penetration. Designs with six to ten blades remain the most widely used because they deliver stable performance across varied lithologies, including shale and deep water wells. Bits with more than ten blades are expanding in hard, abrasive or high pressure zones since their higher cutter density improves wear resistance and maintains toolface control. Leading suppliers continue to refine blade geometry to meet these specialised demands and boost the global PDC drill bits industry revenue.
Market Breakup by Application
Key Insight: Changes in demand for onshore and offshore PDC drill bits shape the design and procurement strategies of these tools globally. Onshore drilling remains the main driver of the volume as a result of extensive shale development, tight oil activity, and the steady demand for fast drilling in cost-sensitive fields. This is pushing the use of bits optimised for high penetration rates, long laterals and efficient bit runs. The offshore activity is getting more and more momentum with the deep water and ultra deep water projects expansion in Brazil, the Gulf of Mexico, and the Middle East. These wells call for high strength, erosion resistant PDC bits specially designed for high pressure formations and long intervals, thereby supporting a strong increase in premium offshore grade designs.
Market Breakup by Region
Key Insight: Regional demand for PDC drill bits reflects differing drilling priorities and investment cycles. North America is leading the market because of shale development and rapid adoption of high-performance bit technologies. Europe is showing a steady demand that is mainly driven by the re-development of the North Sea and geothermal projects, thus accelerating the global PDC drill bits market revenues. Asia Pacific is rapidly becoming a big player as India, China, and Southeast Asia increase both onshore and offshore drilling. Latin America is getting stronger with major deep water activity in Brazil and rising exploration in Argentina. The Middle East and Africa are still the main core growth markets where large upstream budgets and complex reservoirs drive continuous demand for advanced premium grade PDC bits.
Steel body bits dominate due to faster drilling and easy repair in shale
Steel body PDC bits remain dominant because operators in North American shale and Middle Eastern carbonates consistently prefer their higher rate of penetration and easier repairability. For instance, most of Baker Hughes’ rapid drilling programs in the United States are actively using steel body designs to cut long laterals efficiently. It is their ability to support an aggressive cutter layout that makes them the most suitable ones for high speed unconventional drilling environments, thereby bolstering the global PDC drill bits market share.
Matrix body PDC bits are anticipated to have the fastest CAGR due to the rise in deep-water and high-pressure developments in Brazil, the Gulf of Mexico, and Saudi Arabia. Such wells call for superlative erosion resistance and longer wear time. NOV’s ReedHycalog matrix bodies are getting more traction for the abrasive pre-salt formations while Schlumberger is reporting that the use of matrix bits in complex deep vertical sections is increasing, hence boosting their rapid growth globally.
Nine to twenty four millimeter cutters dominate for balanced durability and penetration performance
The 9 to 24 mm cutter size dominates because it is consistently chosen for the long lateral wells that define US shale, Canadian unconventional assets and Middle Eastern horizontal campaigns. Most of their high volume shale bit designs are being supplied by Baker Hughes, NOV, and Landrill within this cutter size as it is the one that balances durability with fast drilling. Thus it is the preferred size range for mainstream development wells that is boosting the global PDC drill bits demand forecast.
The growth of cutters above 24 mm is the fastest as the number of geothermal and deep hard rock projects in Europe, East Africa, and Indonesia is increasing. Large cutters offer higher wear resistance for granite, volcanic, and crystalline formations. Companies, like NOV and Rockpecker, have pointed to a rise in the number of large cutter bits being ordered for geothermal wells in Iceland and Kenya which has made this size segment the fastest growing one due to its being the most suitable for extreme rock conditions.
Six to ten blade designs dominate for stable drilling across varied global formations
Bits with six to ten blades dominate as they are commonly used for mid-range hardness formations which can be found in the Permian Basin, Canadian Montney, and Middle Eastern carbonate reservoirs. Most of their high-performance directional drilling bits are provided by Schlumberger and Baker Hughes within this blade count since it gives the best balance of stability and penetration for most of the commercial wells drilled worldwide.
Bits with over ten blades are becoming the fastest in growth due to the increasing demand for long interval deep-water sections in Brazil and West Africa, hence accelerating the PDC drill bits demand growth globally. Such areas require a high cutter density to keep toolface control and be able to resist a high level of wear. NOV’s multi-blade matrix bits and Rockpecker’s high blade count configurations have been the choices to a great extent for ultra deep offshore programs where stability is more important than aggressiveness.
Onshore drilling dominates through continual shale activity and high annual well counts
Onshore drilling is becoming dominant as a result of North America alone that is drilling thousands of unconventional wells every year and there is still a lot of activity going on in the major oil and gas shale plays in the United States, like the Permian Basin, Eagle Ford, and Bakken. PDC bits designed for fast shale drilling account for the bulk of global sales. Landrill and Baker Hughes have been supplying India, China, and the Middle East with large volumes of onshore optimized designs, thus reinforcing onshore as the largest revenue-generating segment and augmenting the global PDC drill bits market dynamics and trends.
Meanwhile, offshore is becoming the fastest gainer mainly due to the major multi-year deep-water investments in Brazil, Saudi Arabia, and Guyana. Petrobras, Aramco, and ExxonMobil are enlarging their drilling campaigns that need the use of high-strength PDC drill bits for long vertical and high-pressure intervals. Schlumberger and NOV are witnessing a rise in orders for offshore-grade matrix bits, which is making this the fastest-expanding segment as global deep-water spending is getting accelerated.


Read more about this report - REQUEST FREE SAMPLE COPY IN PDF
North America dominates the global market and is driven by intensive unconventional development and consistent drilling programs
North America is still the leading region mainly because it operates more unconventional wells of various types per year than the rest of the world combined. The ongoing development in the Permian Basin and Haynesville is a major factor that keeps the demand for steel body PDC bits with mid-sized cutters at a high level. For example, Baker Hughes, NOV and Rockpecker are making a substantial amount of money from long lateral shale wells, which is a major factor that keeps North America as the largest and most stable PDC drill bit market.
The PDC drill bits market in Asia Pacific is becoming the fastest-growing market as India, China, Indonesia, and Australia are increasing their exploration activities and deepening their well designs. India's ONGC and China's CNPC have significantly increased their usage of high-performance PDC bits for extended-reach and deep tight reservoirs. NOV and Landrill are witnessing a rapid increase in orders for matrix bits and large cutter sizes throughout the Asia Pacific region, which is mainly driven by the growth of domestic drilling and national energy security programs.
The global PDC drill bits market encompasses competitive companies, yet is a consolidated market wherein a few major players are responsible for innovation and investment activities. Global PDC drill bits market players are focussing on strategies that comprise the extension of their product portfolios, R&D investment for the development of advanced cutter technology and matrix body design, and the establishment of strategic partnerships for the market reach enhancement. These strategies, combined with the increasing global energy demand and the drilling of more deep wells, are stimulating the market to keep growing.
PDC drill bits companies, like Baker Hughes Company, are working on innovations like long-lasting PDC bits for deepwater and unconventional wells. NOV Inc devotes its attention to large-diameter bits and hybrid designs for difficult formations. Xi’am Landrill Oil Tools Co Ltd is committed to the production of the most affordable steel-body bits for the rising markets. Rockpecker Limited is focusing on the mining and geothermal segments, whereas Schlumberger Limited utilizes its global service network to deploy PDC bits in oilfields worldwide. Other manufacturers also broaden their reach through the regional supply chains and localized production.
Baker Hughes was founded in 1907 and currently has its headquarters in the United States. The company delivers a cutting edge PDC drill bits concept to suit the extreme standards of deep water, shale and ultra high pressure applications. Both the Talon as well as the Dynamus series embrace the features of enhanced cutter technology, extended life and strong stability that support challenging global drilling programs and complicated well architectures.
NOV was established 1841 and is headquartered in the United States. The company through its ReedHycalog business offers the best quality PDC drill bits that are highly engineered for abrasion resistance, directional control and long interval performance. NOV is vigorously involved in the process of continuous improvement of the cutter design and matrix body technology with the end PDC products being the most important instruments for the drilling of unconventional, offshore and geothermal wells globally.
Xi’am Landrill was established in 2008 and is located in Xi’an China. The company produces steel body and matrix body PDC bits and pays close attention to the implementation of customized cutter layouts that are appropriate for the formation of Asia and Middle East. Landrill offers bits for shale, deep vertical wells as well as geothermal projects and as a result, has become the most sought after among regional drilling markets.
Rockpecker was established in 2010 and has its headquarters in the United Kingdom. The company is mainly involved in the production of the best PDC drill bits that are structurally engineered and lithologically targeted for a specific type of rock, and the company’s product line includes both steel body and matrix body designs. The company’s bits are being used extensively in the drilling programs of Europe, Middle East and Africa where precision, durability and the improvement of the rate of penetration are the prerequisites for the most efficient operations.
*Please note that this is only a partial list; the complete list of key players is available in the full report. Additionally, the list of key players can be customized to better suit your needs.*
Other prominent players in the market include Schlumberger Limited, among others
To explore the full scope of Global PDC Drill Bits Market 2026-2035 and unlock detailed data on segmentation, regional demand, competitive landscape and future trends, download our sample report today or contact us for a personalized consultation. Gain actionable insights into PDC drill bits market trends 2026 and make informed investment decisions.
Upto 15% Off
USD
$2499 $2249
$3999 $3599
$4999 $4249
$5999 $5099


*While we strive to always give you current and accurate information, the numbers depicted on the website are indicative and may differ from the actual numbers in the main report. At Expert Market Research, we aim to bring you the latest insights and trends in the market. Using our analyses and forecasts, stakeholders can understand the market dynamics, navigate challenges, and capitalize on opportunities to make data-driven strategic decisions.*
In 2025, the market reached an approximate value of USD 4.78 Billion.
The market is projected to grow at a CAGR of 3.70% between 2026 and 2035.
Key strategies include continual innovation in cutter technology, development of matrix and steel body designs for varied formations, deeper collaboration between drilling service firms and operators, regional manufacturing to reduce cost and lead time, and expansion into geothermal, mining and deep water projects to diversify demand and strengthen market presence.
The increasing demand for oil and natural gas and increasing investments are the key market trends propelling the market's growth.
The major regions in the market are North America, Latin America, the Middle East and Africa, Europe, and the Asia Pacific.
The types of PDC drill bits in the market are matrix body and steel body.
The different sizes of PDC cutters in the market are less than 9 mm, 9 mm to 24 mm, and above 24 mm.
The various number of blades in the market are less than 6, 6-10, and above 10.
The major applications of the market are onshore and offshore.
The key players in the market include Baker Hughes Company, NOV Inc, Xi’am Landrill Oil Tools Co Ltd, Rockpecker Limited, and Schlumberger Limited, among others.
Key challenges include cutter wear in high temperature formations, performance limitations in extremely hard rock, rising demand for cost reduction despite deeper and more complex wells, supply chain delays for premium materials, and growing competition from regional manufacturers offering lower priced PDC bit alternatives.
Explore our key highlights of the report and gain a concise overview of key findings, trends, and actionable insights that will empower your strategic decisions.
| REPORT FEATURES | DETAILS |
| Base Year | 2025 |
| Historical Period | 2019-2025 |
| Forecast Period | 2026-2035 |
| Scope of the Report |
Historical and Forecast Trends, Industry Drivers and Constraints, Historical and Forecast Market Analysis by Segment:
|
| Breakup by Type |
|
| Breakup by Size of PDC Cutter |
|
| Breakup by Number of Blades |
|
| Breakup by Application |
|
| Breakup by Region |
|
| Market Dynamics |
|
| Competitive Landscape |
|
| Companies Covered |
|
| Report Price and Purchase Option | Explore our purchase options that are best suited to your resources and industry needs. |
| Delivery Format | Delivered as an attached PDF and Excel through email, with an option of receiving an editable PPT, according to the purchase option. |
Datasheet
One User
USD 2,499
USD 2,249
tax inclusive*
Single User License
One User
USD 3,999
USD 3,599
tax inclusive*
Five User License
Five User
USD 4,999
USD 4,249
tax inclusive*
Corporate License
Unlimited Users
USD 5,999
USD 5,099
tax inclusive*
*Please note that the prices mentioned below are starting prices for each bundle type. Kindly contact our team for further details.*
Flash Bundle
Small Business Bundle
Growth Bundle
Enterprise Bundle
*Please note that the prices mentioned below are starting prices for each bundle type. Kindly contact our team for further details.*
Flash Bundle
Number of Reports: 3
20%
tax inclusive*
Small Business Bundle
Number of Reports: 5
25%
tax inclusive*
Growth Bundle
Number of Reports: 8
30%
tax inclusive*
Enterprise Bundle
Number of Reports: 10
35%
tax inclusive*
How To Order

Select License Type
Choose the right license for your needs and access rights.

Click on ‘Buy Now’
Add the report to your cart with one click and proceed to register.

Select Mode of Payment
Choose a payment option for a secure checkout. You will be redirected accordingly.
Strategic Solutions for Informed Decision-Making
Gain insights to stay ahead and seize opportunities.

Get insights & trends for a competitive edge.

Track prices with detailed trend reports.

Analyse trade data for supply chain insights.

Leverage cost reports for smart savings

Enhance supply chain with partnerships.

Connect For More Information
Our expert team of analysts will offer full support and resolve any queries regarding the report, before and after the purchase.
Our expert team of analysts will offer full support and resolve any queries regarding the report, before and after the purchase.
We employ meticulous research methods, blending advanced analytics and expert insights to deliver accurate, actionable industry intelligence, staying ahead of competitors.
Our skilled analysts offer unparalleled competitive advantage with detailed insights on current and emerging markets, ensuring your strategic edge.
We offer an in-depth yet simplified presentation of industry insights and analysis to meet your specific requirements effectively.


