

Consumer Insights
Uncover trends and behaviors shaping consumer choices today
Procurement Insights
Optimize your sourcing strategy with key market data
Industry Stats
Stay ahead with the latest trends and market analysis.
The global potassium permanganate market, valued at USD 1352.61 Million in 2025, has experienced significant growth due to its widespread use in water purification to remove contaminants and enhance water quality. The market is projected to grow at a compound annual growth rate (CAGR) of 10.30% from 2026 to 2035, potentially reaching USD 3605.19 Million by 2035, driven by increasing industrial applications and growing health concerns.
The EPA (2022) reports that potassium permanganate is extensively used in industrial and municipal water treatment, making up 36.1% of total domestic consumption. Its oxidising properties help purify water, remove contaminants, and enhance water quality, supporting sustainable water management in the US.
Industry reports, states that 81% of the EU population is connected to secondary-level wastewater treatment. Potassium permanganate plays a crucial role in improving wastewater treatment, ensuring more effective removal of organic pollutants, and enhancing the quality of European surface water, contributing to environmental sustainability.
As per the India Brand Equity Foundation (IBEF), India’s textile sector is projected to surpass USD 209 billion by 2029. Potassium permanganate is integral in textile processing, particularly in dyeing and bleaching, facilitating cleaner and more efficient operations as the sector expands and modernises.
Compound Annual Growth Rate
10.3%
Value in USD Million
2026-2035
The potassium permanganate market growth is boosted due to its many key benefits. In water treatment, it is essential for eliminating contaminants, ensuring clean water. As a disinfectant, it purifies drinking water, sewage, and wastewater systems. In agriculture, it controls plant diseases and pests, supporting healthier crops. It also acts as an antiseptic, treating skin conditions such as eczema and fungal infections. Furthermore, potassium permanganate is a potent oxidising agent used in various chemical processes across industries. The Australian Commission on Safety and Quality in Health Care reported 21,848,005 antimicrobial prescriptions supplied under PBS in 2022.
The opportunities in the potassium permanganate market are driven by its wide-ranging applications across various sectors. In the textile industry, it is used for dyeing and bleaching fabrics, improving their quality. It is used in the food industry to sanitise processing equipment and surfaces. The chemical manufacturing sector relies on it as a precursor for synthesising other chemicals. In agriculture and aquaculture, it effectively controls fungal diseases, while it also plays a role in soil remediation. Additionally, potassium permanganate is effective in deodorising and eliminating unpleasant odours in various environments.
Read more about this report - REQUEST FREE SAMPLE COPY IN PDF
The potassium permanganate market is expanding, fueled by its applications in water treatment and purification, agricultural uses, healthcare, and pharmaceuticals, as well as various industrial applications.
A new uranium-free potassium permanganate-based metal staining protocol was introduced, enabling high-resolution imaging of complex cell/tissue structures in non-conductive specimens using scanning electron microscopy. This approach avoided harmful uranium compounds, improving electron microscopy applications, and allowing multiscale imaging, from large cell architectures to intricate subcellular ultrastructures.
An experimental investigation was conducted on strengthening Zea mays root fibres for biodegradable composite materials using potassium permanganate treatment. Typically regarded as agricultural waste, Zea mays (Zm) root fibres can be utilised as reinforcing agents in polymer matrices to create structural composite materials.
As of December 2023, the Department of Agriculture, Fisheries, and Forestry reported that 55% of Australia's land was used for agriculture. The growing adoption of modern farming practices in developing countries is further boosting the demand for potassium permanganate in the agricultural sector.
Camfil has launched CamPure 8 media in the U.S., enhancing availability of potassium permanganate-based filtration for air and water treatment. The product, designed for odor and corrosion control, uses activated alumina to improve molecular filtration across various industries, ensuring better environmental management and air quality.
The growing global demand for clean water is driving the increased use of potassium permanganate in water treatment. It effectively removes contaminants, organic matter, and dissolved iron and manganese. With rising concerns over water scarcity and pollution, potassium permanganate has become crucial in municipal and industrial water purification. In India, the Water Information Management System (WIMS) has recently been optimised with improved architecture and telemetry to enable more efficient data reading, decoding, and processing from over 10,000 stations. The system has been expanded to enhance resource management, database performance, and overall system architecture.
Potassium permanganate is gaining popularity in agriculture due to its effectiveness in controlling plant diseases and pests. As both a fungicide and soil disinfectant, it is extensively used in conventional and organic farming. It treats fungal infections, controls pests, and supports seed treatments. With increasing emphasis on sustainable agriculture and reducing pesticide use, potassium permanganate provides an eco-friendly alternative.
The demand for potassium permanganate in the pharmaceutical and healthcare sectors is increasing due to its antiseptic and disinfectant properties. It is widely used in dermatology to treat conditions like eczema, fungal infections, and acne, and in wound care to clean and disinfect open wounds. According to the National Health Expenditure Account (NHEA), US healthcare spending rose by 4.1% to USD 4.5 trillion in 2022, further driving demand. Its role in managing skin conditions continues to grow, particularly with the rise in home care and outpatient treatments.
The use of potassium permanganate is expanding across various industries, such as textiles, chemicals, and mining. In textiles, it plays a key role in dyeing, bleaching, and oxidation processes, ensuring top-quality finishes. In the chemical sector, it acts as a reagent in critical reactions, including the synthesis of other chemicals. Common applications include oil and gas well production water treatment (17.0%), air and gas purification (11.0%), chemical manufacturing (3.6%), remediation (1.7%), metal processing (0.3%), and other uses (7.5%), according to the USITC, 2021.
The potassium permanganate market revenue is impacted by its cost-effective solutions across various sectors, providing affordable and efficient methods for water treatment, disinfection, and waste management. It is used in industrial waste treatment to break down pollutants, and in sewage treatment to reduce harmful chemicals such as hydrogen sulfide. The compound is biodegradable, breaking down into non-toxic products, ensuring environmental safety. It also helps extend the lifespan of materials by preventing rusting and corrosion, particularly in industries dealing with metal components. Additionally, it is used in personal care to treat skin conditions such as acne and dermatitis. According to Invest India, the total market size for beauty, personal care, and hygiene was valued at USD 15.05 billion in FY22.
The growth of the potassium permanganate market is also supported by its antimicrobial properties, making it effective in protecting against bacteria and viruses, thus boosting its demand in medical and personal care products. Its antiseptic qualities have led to increased use in pharmaceuticals. The expanding industrial applications, combined with rising health concerns, are driving global demand for potassium permanganate.
Read more about this report - REQUEST FREE SAMPLE COPY IN PDF
The EMR’s report titled “Global Potassium Permanganate Market Report and Forecast 2026-2035” offers a detailed analysis of the market based on the following segments:
Market Breakup by Grade
Market Breakup by Application
Market Breakup by Region
According to the potassium permanganate market analysis, aquaculture benefits greatly from potassium permanganate, which is used to manage water quality and control diseases in fish populations. Its oxidising properties help reduce harmful bacteria and parasites, fostering healthier aquatic environments. This contributes to higher yields and better-quality seafood, supporting the expanding aquaculture industry. Syndel introduced potassium permanganate in a 55 lb bucket, serving as an oxidising agent for disinfecting hatcheries and aquaculture facilities. It also functions as a water treatment additive, reacting with organic matter like algae, bacteria, and specific parasites in ponds.
The growth of the potassium permanganate market is further driven by its use in metal processing, where it acts as an effective oxidising agent for surface treatment and cleaning. It helps remove impurities, improving the quality and longevity of metal products. Additionally, potassium permanganate is used as a regeneration chemical to eliminate iron and hydrogen sulfide (the rotten egg smell) from well water through a “Manganese Greensand” filter.


The potassium permanganate market key players specialise in producing a wide range of chemicals, including potassium permanganate, which is utilised in water treatment, agriculture, pharmaceuticals, and industrial applications. These companies are dedicated to delivering high-quality products that meet international standards, serving both domestic and global markets. They prioritise sustainability by adopting eco-friendly manufacturing practices and minimising environmental impact.
Headquartered in China and established in 1998, Changyuan Group is a leading producer of potassium permanganate. The company specialises in manufacturing a range of chemicals used in water treatment, textiles, and industrial applications, focusing on high-quality products and sustainable practices.
Founded in 1984 and based in the United States, Carus Group is a prominent supplier of specialty chemicals, including potassium permanganate. The company serves various industries, such as water treatment, agriculture, and chemicals, with a strong emphasis on environmental sustainability and innovative solutions.
Established in 1986 and headquartered in India, Organic Industries Pvt. Ltd. produces a wide range of chemicals, including potassium permanganate. The company focuses on delivering eco-friendly products for industries such as agriculture, water treatment, and chemicals, while maintaining high quality and sustainability standards.
It was founded in 2010 and is a Brazilian business-to-business platform that connects buyers and sellers across industries, including chemicals like potassium permanganate. Headquartered in São Paulo, it facilitates global trade, offering a wide range of products to enhance international business opportunities.
*Please note that this is only a partial list; the complete list of key players is available in the full report. Additionally, the list of key players can be customized to better suit your needs.*
Other key players in the potassium permanganate market report are Libox Chem India Pvt. Ltd and Seidler Chemical Co, Inc., among others.
Upto 15% Off
USD
$2499 $2249
$3999 $3599
$4999 $4249
$5999 $5099


*While we strive to always give you current and accurate information, the numbers depicted on the website are indicative and may differ from the actual numbers in the main report. At Expert Market Research, we aim to bring you the latest insights and trends in the market. Using our analyses and forecasts, stakeholders can understand the market dynamics, navigate challenges, and capitalize on opportunities to make data-driven strategic decisions.*
In 2025, the potassium permanganate market reached an approximate value of USD 1352.61 Million.
The market is assessed to grow at a CAGR of 10.30% between 2026 and 2035.
The market is estimated to witness healthy growth in the forecast period of 2026-2035 to reach a value of around USD 3605.19 Million by 2035.
The major drivers of the market include the increasing population and rising disposable incomes, growing feedstock and automobile markets, and rising health awareness among the consumers.
Various government initiatives globally focussing on the supply of treated soft water and the disposal of wastewater is likely to be a key trend guiding the growth of the market.
North America, Europe, the Asia Pacific, Latin America, and the Middle East and Africa are the leading regions in the market, with the Asia Pacific accounting for the largest market share.
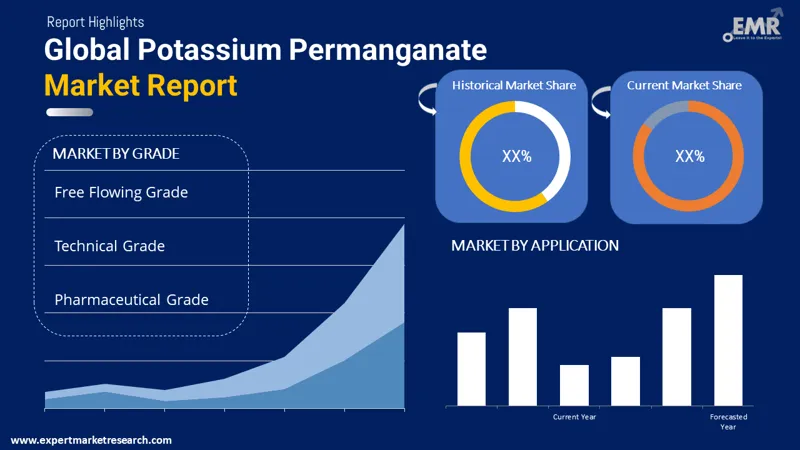
The major grades of potassium permanganate are free flowing grade, technical grade, and pharmaceutical grade.
The major application sectors include water treatment, waste water treatment, chemicals manufacturing, aquaculture, metal processing, and air and gas purification, among others.
The leading players in the global potassium permanganate market are Changyuan Group, Carus Group Inc., Organic Industries Pvt. Ltd., B2Brazil, Libox Chem India Pvt. Ltd, and Seidler Chemical Co, Inc., among others.
Explore our key highlights of the report and gain a concise overview of key findings, trends, and actionable insights that will empower your strategic decisions.
| REPORT FEATURES | DETAILS |
| Base Year | 2025 |
| Historical Period | 2019-2025 |
| Forecast Period | 2026-2035 |
| Scope of the Report |
Historical and Forecast Trends, Industry Drivers and Constraints, Historical and Forecast Market Analysis by Segment:
|
| Breakup by Grade |
|
| Breakup by Application |
|
| Breakup by Region |
|
| Market Dynamics |
|
| Competitive Landscape |
|
| Companies Covered |
|
| Report Price and Purchase Option | Explore our purchase options that are best suited to your resources and industry needs. |
| Delivery Format | Delivered as an attached PDF and Excel through email, with an option of receiving an editable PPT, according to the purchase option. |
Datasheet
One User
USD 2,499
USD 2,249
tax inclusive*
Single User License
One User
USD 3,999
USD 3,599
tax inclusive*
Five User License
Five User
USD 4,999
USD 4,249
tax inclusive*
Corporate License
Unlimited Users
USD 5,999
USD 5,099
tax inclusive*
*Please note that the prices mentioned below are starting prices for each bundle type. Kindly contact our team for further details.*
Flash Bundle
Small Business Bundle
Growth Bundle
Enterprise Bundle
*Please note that the prices mentioned below are starting prices for each bundle type. Kindly contact our team for further details.*
Flash Bundle
Number of Reports: 3
20%
tax inclusive*
Small Business Bundle
Number of Reports: 5
25%
tax inclusive*
Growth Bundle
Number of Reports: 8
30%
tax inclusive*
Enterprise Bundle
Number of Reports: 10
35%
tax inclusive*
How To Order

Select License Type
Choose the right license for your needs and access rights.

Click on ‘Buy Now’
Add the report to your cart with one click and proceed to register.

Select Mode of Payment
Choose a payment option for a secure checkout. You will be redirected accordingly.
Strategic Solutions for Informed Decision-Making
Gain insights to stay ahead and seize opportunities.

Get insights & trends for a competitive edge.

Track prices with detailed trend reports.

Analyse trade data for supply chain insights.

Leverage cost reports for smart savings

Enhance supply chain with partnerships.

Connect For More Information
Our expert team of analysts will offer full support and resolve any queries regarding the report, before and after the purchase.
Our expert team of analysts will offer full support and resolve any queries regarding the report, before and after the purchase.
We employ meticulous research methods, blending advanced analytics and expert insights to deliver accurate, actionable industry intelligence, staying ahead of competitors.
Our skilled analysts offer unparalleled competitive advantage with detailed insights on current and emerging markets, ensuring your strategic edge.
We offer an in-depth yet simplified presentation of industry insights and analysis to meet your specific requirements effectively.


