

Consumer Insights
Uncover trends and behaviors shaping consumer choices today
Procurement Insights
Optimize your sourcing strategy with key market data
Industry Stats
Stay ahead with the latest trends and market analysis.
The global pour point depressants market size attained a value of USD 1.95 Billion in 2025. The market is further expected to grow at a CAGR of 3.80% between 2026 and 2035, reaching a value of USD 2.83 Billion by 2035.
Compound Annual Growth Rate
3.8%
Value in USD Billion
2026-2035
Read more about this report - REQUEST FREE SAMPLE COPY IN PDF
Pour point depressants refer to additives support the flow of lubricants and oils at low temperatures, impeding the growth of wax crystals, so that the lubricants and oils can still flow and be pumped. By acting as wax crystal modifiers, the pour point or lowest temperature at which fuel, lubricant, or oil can flow is reduced further, enabling oil to flow in a smooth way.
Read more about this report - REQUEST FREE SAMPLE COPY IN PDF
The EMR’s report titled “Pour Point Depressants Market Report and Forecast 2026-2035" offers a detailed analysis of the market based on the following segments:
Market Breakup by Type
Market Breakup by Application
Market Breakup by Region


Read more about this report - REQUEST FREE SAMPLE COPY IN PDF
The styrene esters segment, based on type, accounts for a healthy share of the pour point depressants market. The increasing application of styrene esters in liquid moulding fabrication techniques to decrease viscosity and enhance the performance of resin is driving the segment’s growth. Growing industrial use of resins, such as for manufacturing lenses, electronic equipment, and furniture, etc., is further propelling the styrene esters demand. Moreover, low cost and low molecular weight of styrene ester are further heightening their industrial usage as lubricant additive.
Based on application, oil and gas is likely to be a fast-growing segment in the pour point depressants market. This can be attributed to the fact that lubrication is essential to maintain pumpability of oil in refineries and plants. Heavy volumes of oil are used in the oil and gas sector which escalates the formation of heavy wax, thereby leading to a heightened demand for pour point depressants. Over the forecast period, the anticipated increase in demand for crude oil is expected to aid oil and gas applications of pour point depressants.
The comprehensive EMR report provides an in-depth assessment of the market based on the Porter's five forces model along with giving a SWOT analysis. The report gives a detailed analysis of the key players in the global pour point depressants market, covering their competitive landscape and latest developments like mergers, acquisitions, investments and expansion plans.
Akzo Nobel S.A. is a leading paint coating and manufacturing company, with a portfolio of brands of that include Dulux, International Sikkens, and Interpon. The company was founded in 1994 and is headquartered in Amsterdam in the Netherlands.
Evonik Industries is a renowned specialty chemicals company which caters to the demands of medical, food, construction, oil and gas, and tire and rubber, among other sectors. It was established in 2007 and is headquartered in North Rhine-Westphalia, Germany.
Chevron Corporation is a prominent petroleum refineries company based in California, United States. Founded in 1879, this company engages in all kinds of operations related to petroleum, such as exploration, production, marketing, and research.
*Please note that this is only a partial list; the complete list of key players is available in the full report. Additionally, the list of key players can be customized to better suit your needs.*
Other market players include Croda International PLC, Innospec, BASF SE, Clariant Chemicals, Sanyo Chemical Industries Ltd., Messina Chemicals, Infineum International Ltd., Afton Chemicals Corporation, Lubrizol Corporation, Arkema Group, and Krishna Antioxidants Pvt Ltd., among others.
Upto 15% Off
USD
$2999 $2699
$4399 $3959
$5599 $4759
$6659 $5660


*While we strive to always give you current and accurate information, the numbers depicted on the website are indicative and may differ from the actual numbers in the main report. At Expert Market Research, we aim to bring you the latest insights and trends in the market. Using our analyses and forecasts, stakeholders can understand the market dynamics, navigate challenges, and capitalize on opportunities to make data-driven strategic decisions.*
The market reached a value of USD 1.95 Billion in 2025.
The market is estimated to grow at a CAGR of 3.80% between 2026 and 2035.
The market is estimated to witness a healthy growth between the forecast period of 2026-2035 to reach a value of USD 2.83 Billion by 2035.
The increasing demand for automotive lubricants, rising usage of fuels and lubricants in cold weather, and increasing demand for marine fuel pour point depressants are the major drivers of the market.
The key trends in the market include the growing innovations by vehicle manufacturers and growing expansion of oil and gas sector propelling the demand for pour point depressants to store and pump heavy oil volumes.
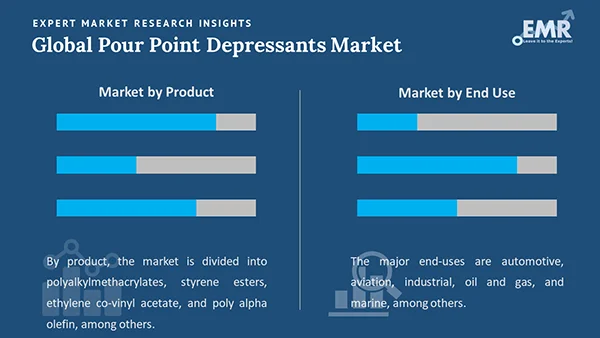
Poly alkyl methacrylates, styrene esters, oligomerized alkyl phenol, phthalic acid esters & copolymers, ethylene co-vinyl-acetate, and poly alpha olefin, among others, are the different types of pour point depressants in the market.
Automotive industry, oil and gas, industrial, marine, and aviation, among others, are the major applications of pour point depressants.
Akzo Nobel S.A., Evonik Industries, Chevron Corporation, Croda International PLC, Innospec, BASF SE, Clariant Chemicals, Sanyo Chemical Industries Ltd., Messina Chemicals, Infineum International Ltd., Afton Chemicals Corporation, Lubrizol Corporation, Arkema Group, and Krishna Antioxidants Pvt Ltd., among others, are the key players in the pour point depressants market, according to the report.
Explore our key highlights of the report and gain a concise overview of key findings, trends, and actionable insights that will empower your strategic decisions.
| REPORT FEATURES | DETAILS |
| Base Year | 2025 |
| Historical Period | 2019-2025 |
| Forecast Period | 2026-2035 |
| Scope of the Report |
Historical and Forecast Trends, Industry Drivers and Constraints, Historical and Forecast Market Analysis by Segment:
|
| Breakup by Type |
|
| Breakup by Application |
|
| Breakup by Region |
|
| Market Dynamics |
|
| Competitive Landscape |
|
| Companies Covered |
|
Datasheet
One User
USD 2,999
USD 2,699
tax inclusive*
Single User License
One User
USD 4,399
USD 3,959
tax inclusive*
Five User License
Five User
USD 5,599
USD 4,759
tax inclusive*
Corporate License
Unlimited Users
USD 6,659
USD 5,660
tax inclusive*
*Please note that the prices mentioned below are starting prices for each bundle type. Kindly contact our team for further details.*
Flash Bundle
Small Business Bundle
Growth Bundle
Enterprise Bundle
*Please note that the prices mentioned below are starting prices for each bundle type. Kindly contact our team for further details.*
Flash Bundle
Number of Reports: 3
20%
tax inclusive*
Small Business Bundle
Number of Reports: 5
25%
tax inclusive*
Growth Bundle
Number of Reports: 8
30%
tax inclusive*
Enterprise Bundle
Number of Reports: 10
35%
tax inclusive*
How To Order

Select License Type
Choose the right license for your needs and access rights.

Click on ‘Buy Now’
Add the report to your cart with one click and proceed to register.

Select Mode of Payment
Choose a payment option for a secure checkout. You will be redirected accordingly.
Strategic Solutions for Informed Decision-Making
Gain insights to stay ahead and seize opportunities.

Get insights & trends for a competitive edge.

Track prices with detailed trend reports.

Analyse trade data for supply chain insights.

Leverage cost reports for smart savings

Enhance supply chain with partnerships.

Connect For More Information
Our expert team of analysts will offer full support and resolve any queries regarding the report, before and after the purchase.
Our expert team of analysts will offer full support and resolve any queries regarding the report, before and after the purchase.
We employ meticulous research methods, blending advanced analytics and expert insights to deliver accurate, actionable industry intelligence, staying ahead of competitors.
Our skilled analysts offer unparalleled competitive advantage with detailed insights on current and emerging markets, ensuring your strategic edge.
We offer an in-depth yet simplified presentation of industry insights and analysis to meet your specific requirements effectively.


