

Consumer Insights
Uncover trends and behaviors shaping consumer choices today
Procurement Insights
Optimize your sourcing strategy with key market data
Industry Stats
Stay ahead with the latest trends and market analysis.
The global power float market was valued at USD 11.80 Billion in 2025. The market is expected to grow at a CAGR of 5.10% during the forecast period of 2026-2035 to reach a value of USD 19.40 Billion by 2035. Growing construction projects and demand for high-quality concrete finishing are driving market development.
Compound Annual Growth Rate
5.1%
Value in USD Billion
2026-2035
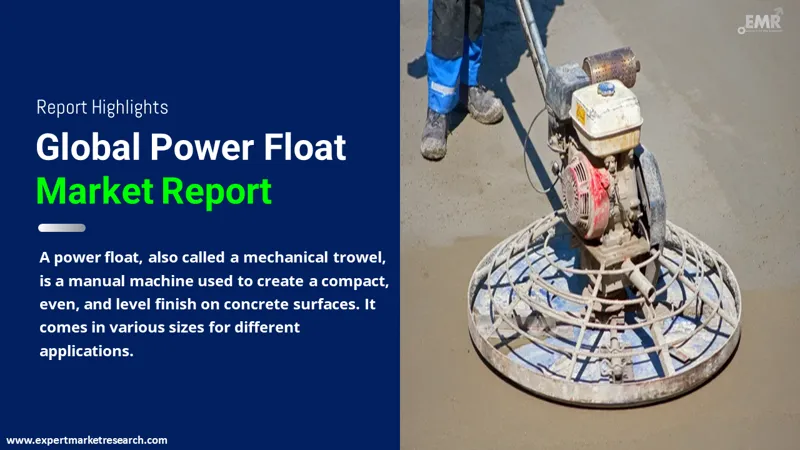
A power float is a hand-operated machine employed to make a dense, smooth, and level surface finish to in-situ concrete beds. Also known as mechanical trowels, power floats are available in various sizes. The usage of power float reduces the time and removes the requirement for materials that would be needed to produce a finishing screed on the surface. It is less dependent on manual labour and also takes less amount of time as compared to hand trowelling.
Read more about this report - REQUEST FREE SAMPLE COPY IN PDF


The EMR’s report titled “Power Float Market Report and Forecast 2026-2035" offers a detailed analysis of the market based on the following segments:
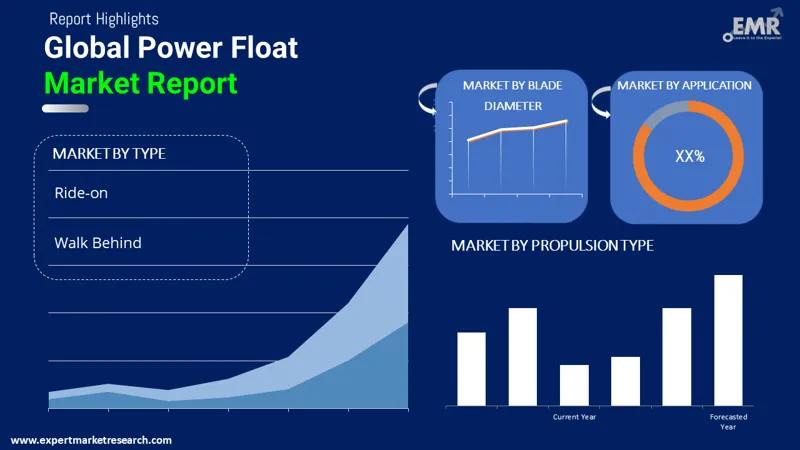
Market Breakup by Type
Market Breakup by Blade Diameter
Market Breakup by Propulsion Type
Market Breakup by Application
Market Breakup by Region
Read more about this report - REQUEST FREE SAMPLE COPY IN PDF
The comprehensive EMR report provides an in-depth assessment of the market based on the Porter's five forces model along with giving a SWOT analysis. The report gives a detailed analysis of the following key players in the global power float market, covering their competitive landscape and latest developments like mergers, acquisitions, investments and expansion plans.
Upto 15% Off
USD
$2499 $2249
$3999 $3599
$4999 $4249
$5999 $5099


*While we strive to always give you current and accurate information, the numbers depicted on the website are indicative and may differ from the actual numbers in the main report. At Expert Market Research, we aim to bring you the latest insights and trends in the market. Using our analyses and forecasts, stakeholders can understand the market dynamics, navigate challenges, and capitalize on opportunities to make data-driven strategic decisions.*
The market is projected to grow at a CAGR of 5.10% between 2026 and 2035.
The major market driver is the growing urban population along with the rising construction industry.
The key market trends include the increasing disposable income among people, expansion of infrastructure, and restructuring of spaces.
The various types of power floats include the ride-on and walk behind.
The various blade diameter in the market of power tools includes less than 36 inch, 36-48 inch, and above 48 inches.
In 2025, the global power float market reached an approximate value of USD 11.80 Billion.
The market is expected to witness steady growth during the forecast period of 2026-2035 to reach a value of USD 19.40 Billion by 2035.
Explore our key highlights of the report and gain a concise overview of key findings, trends, and actionable insights that will empower your strategic decisions.
| REPORT FEATURES | DETAILS |
| Base Year | 2025 |
| Historical Period | 2019-2025 |
| Forecast Period | 2026-2035 |
| Scope of the Report |
Historical and Forecast Trends, Industry Drivers and Constraints, Historical and Forecast Market Analysis by Segment:
|
| Breakup by Type |
|
| Breakup by Blade Diameter |
|
| Breakup by Propulsion Type |
|
| Breakup by Application |
|
| Breakup by Region |
|
| Market Dynamics |
|
| Competitive Landscape |
|
| Companies Covered |
|
Datasheet
One User
USD 2,499
USD 2,249
tax inclusive*
Single User License
One User
USD 3,999
USD 3,599
tax inclusive*
Five User License
Five User
USD 4,999
USD 4,249
tax inclusive*
Corporate License
Unlimited Users
USD 5,999
USD 5,099
tax inclusive*
*Please note that the prices mentioned below are starting prices for each bundle type. Kindly contact our team for further details.*
Flash Bundle
Small Business Bundle
Growth Bundle
Enterprise Bundle
*Please note that the prices mentioned below are starting prices for each bundle type. Kindly contact our team for further details.*
Flash Bundle
Number of Reports: 3
20%
tax inclusive*
Small Business Bundle
Number of Reports: 5
25%
tax inclusive*
Growth Bundle
Number of Reports: 8
30%
tax inclusive*
Enterprise Bundle
Number of Reports: 10
35%
tax inclusive*
How To Order

Select License Type
Choose the right license for your needs and access rights.

Click on ‘Buy Now’
Add the report to your cart with one click and proceed to register.

Select Mode of Payment
Choose a payment option for a secure checkout. You will be redirected accordingly.
Strategic Solutions for Informed Decision-Making
Gain insights to stay ahead and seize opportunities.

Get insights & trends for a competitive edge.

Track prices with detailed trend reports.

Analyse trade data for supply chain insights.

Leverage cost reports for smart savings

Enhance supply chain with partnerships.

Connect For More Information
Our expert team of analysts will offer full support and resolve any queries regarding the report, before and after the purchase.
Our expert team of analysts will offer full support and resolve any queries regarding the report, before and after the purchase.
We employ meticulous research methods, blending advanced analytics and expert insights to deliver accurate, actionable industry intelligence, staying ahead of competitors.
Our skilled analysts offer unparalleled competitive advantage with detailed insights on current and emerging markets, ensuring your strategic edge.
We offer an in-depth yet simplified presentation of industry insights and analysis to meet your specific requirements effectively.


