

Consumer Insights
Uncover trends and behaviors shaping consumer choices today
Procurement Insights
Optimize your sourcing strategy with key market data
Industry Stats
Stay ahead with the latest trends and market analysis.
The global powerships market attained a value of USD 4.02 Billion in 2025 and is projected to expand at a CAGR of 4.60% through 2035. The market is further expected to achieve USD 6.30 Billion by 2035. The growth in industrialization within coastal countries is driving the need for faster deployment of floating power generation units amid existing challenges associated with deteriorating electrical transmission networks and delayed construction of thermal plants, which cause grid unreliability and energy insecurity.
According to a Financial Afrik report on April 7, 2026, the Gabonese State disbursed an advance of roughly USD 12.3 million to Turkish powership operator Karpowership against a debt of about USD 26.4 million. The remaining shortfall underscores recurring payment risks that shape commercial terms across the powerships market, where host-nation arrears, fuel disputes, and currency pressure increasingly influence contract structures, financing costs, and fleet redeployment decisions in emerging economies.
Offshore Energy reported on March 9, 2026 that Singapore's Seatrium secured the lead role in converting a new floating storage regasification unit for Türkiye-based Karpowership, marking the eighth such assignment between the two firms. The deal advances Karpowership's plan to integrate four next-generation Powerships, with options for two more, signalling sustained capital flow into the floating power segment and rising demand for LNG-fed powership capacity globally.
Utility companies are opting for the use of powerships due to the relatively shorter period required for setting up compared to thermal plants. Moreover, African and Southeast Asian governments are focusing on LNG-compatible floating power plants in an attempt to decrease reliance on diesel and ensure steady power production during peak demand periods.
The powerships market is demonstrating robust commercial performance, given the focus of utility companies and governments on the swift development of electricity sources for industry zones, mining communities, and underpowered coastal regions. In August 2025, BKPS, a Karpowership affiliate, launched Iraq power projects supporting floating electricity generation and regional energy security initiatives. According to Karpowership's press release, its current operational fleet surpasses 8,000 MW of installed capacity, with expansion efforts targeting close to 21,000 MW of installed capacity. At the same time, utilities in Iraq and Senegal are rapidly sourcing floating generation systems to provide relief to their strained electrical systems experiencing shortages of fossil fuels and intermittent power supply.
There is an increasing trend among powership providers to focus on floating generation units not as emergency electricity sources but as transition energy sources. Companies in the powerships market are incorporating features such as LNG regasification technology, hybrid fuel capacity, digital monitoring software, and modular transmission systems into their systems to enhance flexibility. For instance, in September 2025, Synergy Marine delivered Karadeniz LNGT FSRU conversion, accelerating floating LNG-to-power deployment and offshore energy infrastructure modernization.
Compound Annual Growth Rate
4.6%
Value in USD Billion
2026-2035
Read more about this report - REQUEST FREE SAMPLE COPY IN PDF
Karpowership improved energy security in Iraq by deploying powerships capable of providing quick electricity production and grid stabilizing solutions. Such developments create opportunities for companies to offer mobile power systems, emergency electricity solutions, and regional energy services.
According to Modern Power Systems, powerships in Iraq are playing important roles in improving grid stability, generating flexible electricity, and expanding energy infrastructure rapidly in Iraq. This move encourages other companies to invest in solutions that can address electricity shortage problems in Iraq, thereby boosting powerships market growth.
Seatrium collaborated with Karpowership to introduce LNGTS Americas, marking progress in floating LNG-to-power systems and innovative offshore energy platforms. Partnerships like these allow businesses to investigate technologies involving LNG-powered ships that can facilitate transitions to cleaner fuels and offshore energy solutions.
MAN Energy Solutions provided dual-fuel engines, which offer advantages in flexible fueling, increased efficiency, and reduced emissions in floating power plants. This innovation underscores potential areas where companies in the powerships market can focus on manufacturing eco-friendly marine power solutions for floating energy facilities.
The use of LNG-based powerships is becoming an important part of future investments, which help companies save on fuel consumption and comply with environmental standards. The powerships company Karpowership is implementing the infrastructure for LNG-to-power systems through the introduction of floating storage and regasification facilities for powerships and land-based power plants. The implementation of Senegal's LNG-to-power projects demonstrates that floating facilities can bring into play gas sources much faster than onshore facilities, boosting growth in the powerships market. South Asian and African governments are also negotiating short-term floating LNG deals to bypass the lengthy process involved in building thermal plants. For instance, in May 2026, Russia-linked LNG carrier Merkuriy loaded Arctic LNG cargoes, expanding shadow fleet capacity supporting sanctioned energy transportation operations.
Powerships suppliers are focusing on countries with energy deficit issues, transmission constraints, and weather-induced blackouts, reshaping the powerships market trends and dynamics. Iraq, for example, is expanding its floating generation deals to ensure that electricity supply would not be disrupted during the summer season. Some African power utilities are also considering the idea of signing temporary floating generation deals rather than importing additional diesel generators as backup sources. Similarly, in May 2026, the Indian government accelerated battery storage deployment and grid expansion initiatives, strengthening renewable energy integration, transmission efficiency, and power reliability in the country. Such projects are appealing to infrastructure investors due to the faster implementation periods compared to utility-scale thermal plants.
Hybrid floating energy systems are emerging as a transformative trend in the powerships market, combining floating LNG units with offshore wind, solar, and battery storage technologies to deliver cleaner and more reliable electricity. These integrated platforms help coastal and island nations reduce carbon emissions while maintaining grid stability and rapid deployment advantages. Companies are investing in modular hybrid powerships capable of supporting renewable integration and flexible fuel usage, aligning with global decarbonization goals. For instance, in July 2025, MOL and Kinetics partnered to develop floating data centers powered by powerships, supporting scalable offshore digital infrastructure.
The powerships market observes an increasing trend towards renting powerships on a short-term basis for managing energy deficits during peak hours, natural disasters, and unforeseen power outages. Island countries and developing economies are opting for floating power rentals due to their low cost and quick installation in comparison with stationary thermal plants. Ministries responsible for energy matters are also considering installing temporary offshore power plants in industrial parks and mining centers. Aligning with this trend, in December 2025, Kinetics partnered with Amogy advancing ammonia-powered floating energy systems supporting zero-emission powerships and offshore data center infrastructure.
Powership suppliers are allocating considerable resources into digital optimization and next-generation fuel compatibility technology advancements. Scientific communities and engineering firms are creating digital twins that can enhance floating power plant performance, predictive maintenance, and fuel utilization management. Meanwhile, turbine producers are experimenting with hydrogen and ammonia mixing technologies to facilitate low-emission floating power generation activities. Demonstrating this shift in the powerships market, in November 2023, Mitsubishi Power expanded its hydrogen co-firing demonstration projects as utilities increasingly explore next-generation thermal infrastructure solutions for cleaner and more flexible power generation.
Read more about this report - REQUEST FREE SAMPLE COPY IN PDF
The Expert Market Research's report titled “Global Powerships Market Report and Forecast 2026-2035” offers a detailed analysis of the market based on the following segments:
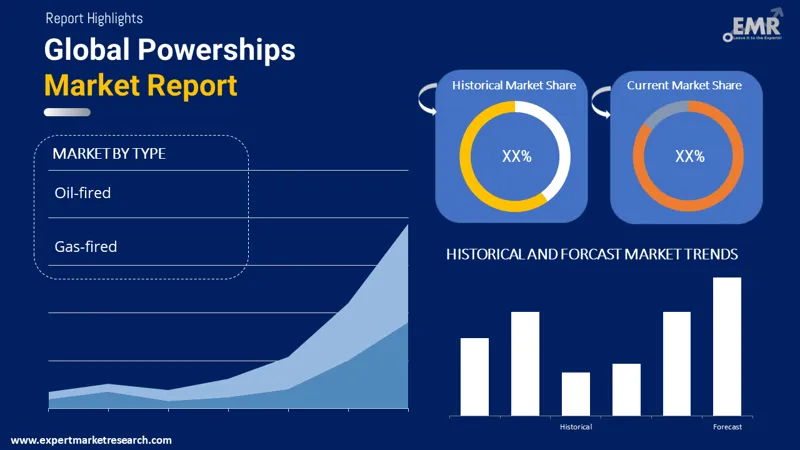
Market Breakup by Type
Key Insight: The oil-powered and gas-powered powership segments are witnessing rapid expansion due to their distinct roles in addressing diverse energy demands across global markets. The powerships market observes more development in the gas-powered ships category owing to cleaner fuel strategies, LNG facility construction, and strictness on emissions standards by utilities. On the other hand, oil-powered powerships keep powering countries that need immediate electricity supply due to inadequate gas logistics and commercial feasibility. Operators are developing powerships with fuel systems that are able to switch from oil to LNG to hybrid fuel systems according to the energy infrastructural capabilities of the country.
Market Breakup by Region
Key Insight: Across the powerships market in North America and Europe, the main attention is paid to the development of floating energy solutions, emissions optimization solutions, and integration of fuels. In the Asia Pacific region, growth is fueled by expanding industrial activities, electrification demands of islands, and investments in decentralization of power production through natural gas. Growth in the Latin American market is gradual due to rising mining operations and pressure on aging electricity grids located near coastal industries. However, the Middle East and Africa regions emerge to be the largest contributor to global market value due to continuous demands for quick deployment of floating power plants that can ensure the supply of electricity amid various challenges. In June 2025, GE Vernova and Ansaldo Energia accelerated Middle East energy investments, supporting grid modernization, gas power expansion, and sustainability initiatives.
Read more about this report - REQUEST FREE SAMPLE COPY IN PDF
Gas-fired powerships secure the biggest share of the market revenue owing to cleaner fuel flexibility advantages
The market is being dominated by powerships using natural gas as their primary source of fuel as utilities are shifting towards low-emission floating power generation facilities with quicker regulatory processes. Powerships that use liquefied natural gas (LNG) are gaining more traction in Africa, the Middle East, and Southeast Asia as governments try to cut down on diesel usage while avoiding the long construction timelines associated with onshore thermal power plants. Operators are now combining floating storage and regasification units with powerships using natural gas as their primary energy source. For example, in April 2026, eFuels SEA launched Southeast Asia electrofuel platform, accelerating sustainable fuel projects, regional decarbonization, and renewable energy investments.
The powerships market observes a consistent growth in the oil-fired powerships category, strengthened by nations with less stable gas infrastructure networks and an urgent need for electricity due to emergencies. Coastal economies in developing nations continue to rely on heavy fuel oil-powered ships because the fuel is easier to obtain than LNG. Companies are improving oil-fired powerships through technological advances, such as emission reduction systems and efficient software, to ensure that their business models are viable.


Read more about this report - REQUEST FREE SAMPLE COPY IN PDF
Middle East and Africa lead the market growth due to chronic electricity shortages
Middle East and Africa represent the leading regions in the global powerships market owing to the continued presence of issues related to transmission instability, periodic blackouts, and delays in thermal plant construction in many nations. The governments in West Africa and the Middle East are focusing on floating powerships to regulate industry operations and provide electricity to urban centers. Powership vendors are focusing on ports, mining routes, and industrial centers that need immediate energy solutions. Furthermore, LNG-powered ships are being developed at a rapid pace to enable their adoption in the region. In March 2026, EWEC advanced the Al Nouf power project, supporting carbon-capture-ready generation, grid stability, and large-scale energy infrastructure expansion.
The Asia Pacific region is expected to register the fastest growth in the powerships market revenue share owing to the growing industrialization in the region, electrification projects in islands, and growing interest in floating LNG terminals. Many nations in Southeast Asia are using powerships to cater to the energy demands of manufacturing centers and urban areas. The companies are working to develop hybrid ships that can incorporate LNG power, batteries, and renewables to serve decentralized grids along coastlines.
The sector remains highly specialized, focusing on fuel flexibility, incorporation of floating LNG, modular deployment technologies, and digital monitoring capabilities. Key powerships market players are shifting towards securing long-term utility contracts in areas dealing with electricity instability as well as expansion of industrial facilities. Companies are making investments in dual-fuel turbine technology, in-ship regasification plants, and floating substations to enhance efficiency and cut down deployment time. The acquisition of shipyards and engineering partnerships in various regions are becoming crucial for utilities as they look for fast deployment of vessels in case of energy emergencies.
Some powership companies are developing hybrid powerships, incorporating battery technology, floating solar power generation capacity, and hydrogen turbines. Growing opportunities are emerging across mining operations, industrial development projects, island electrification programs, and temporary grid stabilization initiatives. Companies that can offer flexible financing terms and rapid deployment are able to capitalize better in emerging economies, which continue to face problems in implementing their thermal power plants due to delays and funding issues.
Karpower International B.V. was founded in 2009 and its headquarters are located in Netherlands. The company is involved in the operation of one of the biggest fleets of floating power facilities. It pays special attention to LNG-friendly powerships, floating regasification solutions, and fast-track energy agreements within Africa, Asia, and the Middle East.
The company Volkswagen AG was founded in 1937 and is based in Wolfsburg, Germany. It provides indirect services to the powerships market as a producer of marine engines, industrial power generators, and alternative fuels. Volkswagen AG actively invests in sustainability-related solutions such as alternative fuel technologies, hydrogen-based solutions, and digitized engineering platforms.
Founded in 1988, ABB Ltd operates from its headquarters based in Zurich, Switzerland. The company uses marine electrification systems, digital automation systems, and energy management technology. The company is concentrating on smart grids, software-based predictive maintenance, and advanced power conversion systems that ensure increased system reliability for floating power stations used in industrial ports and coastal locations.
Founded in 1892, General Electric Company supplies modern gas turbines, grid technologies, and optimization solutions to facilitate floating power plants. General Electric Company, based in the United States, is concentrating on developing hydrogen-friendly gas turbines, optimizing fuel efficiency, and designing modular power systems to rapidly deploy electricity in deficit areas and expanding industrial zones.
*Please note that this is only a partial list; the complete list of key players is available in the full report. Additionally, the list of key players can be customized to better suit your needs.*
Unlock the latest insights with our powerships market trends 2026 report. Discover regional growth patterns, consumer preferences, and key industry players. Stay ahead of competition with trusted data and expert analysis. Download your free sample report today and drive informed decisions in the market.
Upto 15% Off
USD
$2499 $2249
$3999 $3599
$4999 $4249
$5999 $5099


*While we strive to always give you current and accurate information, the numbers depicted on the website are indicative and may differ from the actual numbers in the main report. At Expert Market Research, we aim to bring you the latest insights and trends in the market. Using our analyses and forecasts, stakeholders can understand the market dynamics, navigate challenges, and capitalize on opportunities to make data-driven strategic decisions.*
The global powerships market is projected to grow at a CAGR of nearly 4.60% in the forecast period of 2026-2035.
The major drivers of the industry include the rising demand for energy, rising economic activities, digitalisation of modern economies, electrification of the heating and transport industry, and a rising number of electronically connected devices.
The rising introduction of electric motor systems in industries is expected to be a key trend guiding the growth of the market.
North America, Europe, the Asia Pacific, Latin America, and the Middle East and Africa are the leading regions in the market.
The leading types of powerships in the industry are oil-fired and gas-fired.
The leading players in the market are Karpower International B.V., Volkswagen AG, ABB Ltd, and General Electric Company, among others.
Explore our key highlights of the report and gain a concise overview of key findings, trends, and actionable insights that will empower your strategic decisions.
| REPORT FEATURES | DETAILS |
| Base Year | 2025 |
| Historical Period | 2019-2025 |
| Forecast Period | 2026-2035 |
| Scope of the Report |
Historical and Forecast Trends, Industry Drivers and Constraints, Historical and Forecast Market Analysis by Segment:
|
| Breakup by Type |
|
| Breakup by Region |
|
| Market Dynamics |
|
| Competitive Landscape |
|
| Companies Covered |
|
| Report Price and Purchase Option | Explore our purchase options that are best suited to your resources and industry needs. |
| Delivery Format | Delivered as an attached PDF and Excel through email, with an option of receiving an editable PPT, according to the purchase option. |
Datasheet
One User
USD 2,499
USD 2,249
tax inclusive*
Single User License
One User
USD 3,999
USD 3,599
tax inclusive*
Five User License
Five User
USD 4,999
USD 4,249
tax inclusive*
Corporate License
Unlimited Users
USD 5,999
USD 5,099
tax inclusive*
*Please note that the prices mentioned below are starting prices for each bundle type. Kindly contact our team for further details.*
Flash Bundle
Small Business Bundle
Growth Bundle
Enterprise Bundle
*Please note that the prices mentioned below are starting prices for each bundle type. Kindly contact our team for further details.*
Flash Bundle
Number of Reports: 3
20%
tax inclusive*
Small Business Bundle
Number of Reports: 5
25%
tax inclusive*
Growth Bundle
Number of Reports: 8
30%
tax inclusive*
Enterprise Bundle
Number of Reports: 10
35%
tax inclusive*
How To Order

Select License Type
Choose the right license for your needs and access rights.

Click on ‘Buy Now’
Add the report to your cart with one click and proceed to register.

Select Mode of Payment
Choose a payment option for a secure checkout. You will be redirected accordingly.
Strategic Solutions for Informed Decision-Making
Gain insights to stay ahead and seize opportunities.

Get insights & trends for a competitive edge.

Track prices with detailed trend reports.

Analyse trade data for supply chain insights.

Leverage cost reports for smart savings

Enhance supply chain with partnerships.

Connect For More Information
Our expert team of analysts will offer full support and resolve any queries regarding the report, before and after the purchase.
Our expert team of analysts will offer full support and resolve any queries regarding the report, before and after the purchase.
We employ meticulous research methods, blending advanced analytics and expert insights to deliver accurate, actionable industry intelligence, staying ahead of competitors.
Our skilled analysts offer unparalleled competitive advantage with detailed insights on current and emerging markets, ensuring your strategic edge.
We offer an in-depth yet simplified presentation of industry insights and analysis to meet your specific requirements effectively.


