

Consumer Insights
Uncover trends and behaviors shaping consumer choices today
Procurement Insights
Optimize your sourcing strategy with key market data
Industry Stats
Stay ahead with the latest trends and market analysis.
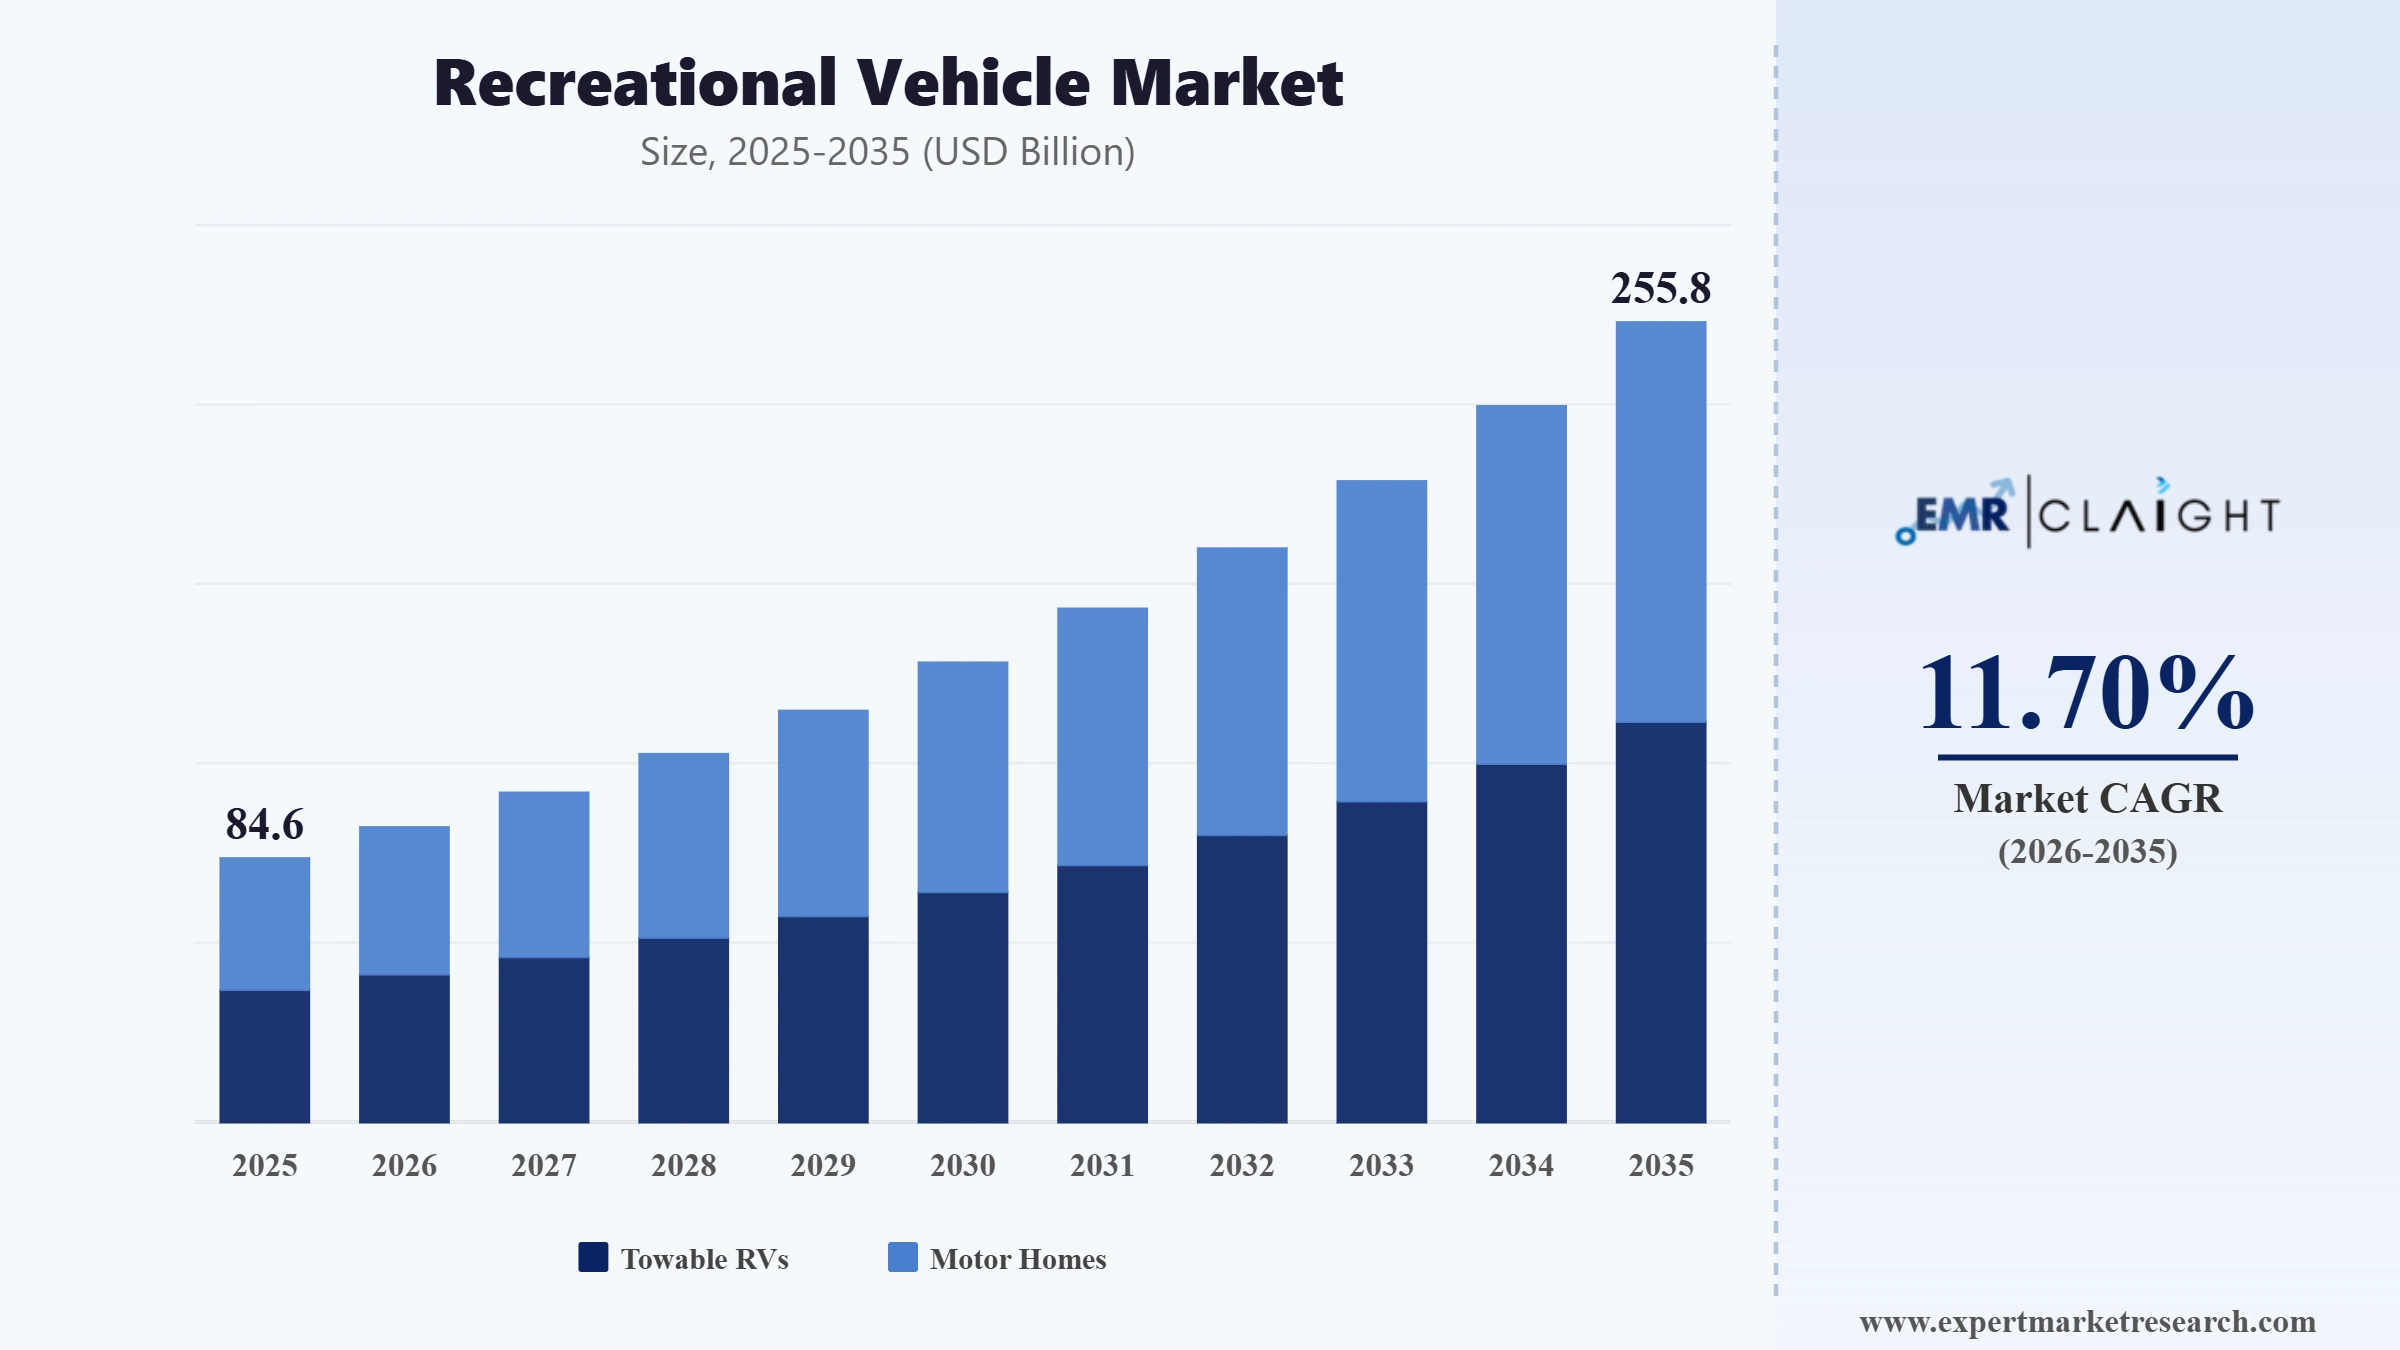
The global recreational vehicle market attained a value of USD 84.60 Billion in 2025 and is projected to expand at a CAGR of 11.70% through 2035. The market is further expected to achieve USD 255.80 Billion by 2035. The increasing integration of off-grid energy systems, telematic diagnostic services, and composite structures is spurring innovation in fleet modernization within the rental industry and among luxury RV producers who aim to increase efficiency.
According to KIRO 7 News, an industry status report published in April 2026 confirmed that only Lightship is currently delivering electric RVs to paying customers, with legacy brands such as Winnebago and Thor still in pilot or rental-fleet stages. The findings highlight the gradual electrification curve and reinforce that gasoline and diesel motorhomes will dominate global recreational vehicle sales for several years.
According to Green Car Reports, Winnebago's eRV2 and Thor's range-extended Embark Class A electric motorhome were showcased as the recreational vehicle industry signals a long-term shift away from gas and diesel powertrains. The Embark, named 2026 RV of the Year, will enter THL's rental fleet for real-world validation, advancing electrification roadmaps across the North American recreational vehicle market.
Electrification, lightweight designs, and digital vehicle integration are among the key factors that are currently changing the recreational vehicle market landscape due to a growing need for efficiency in manufacturing and a broadening customer base. For example, in May 2026, AL-KO VTE introduced ONDA connectivity retrofitting, improving trailer monitoring, predictive maintenance, and smarter fleet management across Europe. The decision was influenced by the current changes in outdoor travel, considering the fact that, according to the RV Industry Association, more than 342,220 units were sold in 2025 with a retail value of USD 20.40 billion, reflecting the need for continuous production amidst tightened financial conditions.
Moreover, the structural demand in the recreational vehicle market is driven by the changing positioning strategies of major companies that aim at serving premium travelers, fleet renters, and adventure travel companies. For example, in May 2026, Winnebago introduced the Arka off-grid adventure truck, expanding rugged mobility, self-sufficiency, and outdoor travel capabilities. Manufacturers are further investing in light composite materials, solar power generation systems, and digitized cabin control systems in order to make their products more competitive. Companies like Thor Industries and Forest River are aiming at increasing the durability and off-road capabilities of their products.
A potential source of growth is the expansion of rental tourism ecosystems. Premium RV rental and subscription service providers are growing their businesses to cater to young travelers looking for alternative ways of owning RVs, reshaping the recreational vehicle market dynamics. For example, in January 2026, RVshare launched flexible travel offerings, adding one-way rentals, guided planning, and turnkey getaway packages for easier RV trips. In addition, vehicle producers are incorporating connected navigation technologies, predictive maintenance software, and multifunctional interior spaces to increase routing efficiency and user comfort.
Read more about this report - REQUEST FREE SAMPLE COPY IN PDF
Post-Pandemic Outdoor Recreation Boom and Experiential Travel
The most powerful near-term structural driver of RV market growth is the sustained post-pandemic shift in consumer leisure preferences toward outdoor, nature-based, and self-directed travel experiences. The pandemic period demonstrated to tens of millions of households that RV travel offered a form of leisure that combined the flexibility of independent travel with the safety, control, and comfort of bringing one's own accommodations. This experience converted a significant new cohort of first-time buyers who had previously not considered RV ownership, while simultaneously deepening the commitment of existing owners who reduced other travel expenditures and increased their RV usage frequency. Survey data consistently show that a substantial majority of new RV buyers entered the category from alternative travel modes hotels, air travel, cruise ships and have maintained their preference for RV travel even as pandemic-era constraints have lifted.
Remote Work and the Digital Nomad Lifestyle
The normalization of remote and hybrid work arrangements following the pandemic has fundamentally expanded the pool of potential full-time and part-time RV users. When professional obligations can be met from any location with a reliable internet connection, the traditional barriers to extended RV travel, specifically the requirement to return to a fixed office location, are eliminated. This has created a new consumer archetype: the mobile professional who works from their RV while traveling, using the flexibility of location independence to live on the road either full-time or for extended seasonal periods.
Modern RV manufacturers have responded by engineering connectivity infrastructure directly into their product designs. Starlink-ready roof mounts, LTE router integration, 120-volt inverter systems capable of powering full workstation setups, and ergonomically designed fold-down workspace surfaces are standard or near-standard features on 2025 model year RVs targeting this demographic. The Class B campervan segment has been particularly responsive to digital nomad demand, offering compact van-based units that function as daily drivers, weekend adventure vehicles, and mobile offices simultaneously.
Millennial and Gen Z Consumer Adoption
The recreational vehicle market is experiencing a generational demographic shift of significant commercial importance. Millennials are now entering their peak earning years in their mid-30s to early 40s, and Gen Z consumers are adopting RV travel at rates that exceed prior generational patterns for equivalent life stages. These cohorts bring strong outdoor recreation affinities developed through hiking, camping, rock climbing, surfing, and other adventure sports culture, combined with a value system that prioritizes experiences over possessions and authenticity over luxury hotel polish. They are attracted to the RV lifestyle for its combination of adventure access, cost-efficient travel, and Instagram-worthy aesthetic potential.
Critically, younger consumers are also accessing RV travel through the rental channel before committing to purchase, using peer-to-peer platforms such as Outdoorsy and RVshare to test specific vehicle types and travel styles. This rental-to-purchase funnel is bringing younger buyers into the ownership market earlier in the RV lifecycle than traditional marketing approaches could achieve. Class B campervans under 22 feet are particularly resonant with this demographic for their versatility, compact footprint, and accessibility relative to larger coach-style motorhomes.
Peer-to-Peer Rental Economy Democratizing Access
The emergence of peer-to-peer RV rental platforms has fundamentally broadened the accessible market for the RV lifestyle beyond the traditional ownership demographic. Platforms including Outdoorsy and RVshare collectively list more than 250,000 active rental units across North America, enabling travelers to experience RV travel at a fraction of the capital commitment of ownership. The global RV rental market was valued at approximately USD 2.72 billion and is projected to reach USD 3.62 billion by 2030, growing at a CAGR of approximately 5.88%. The peer-to-peer segment within this is growing at approximately 12% annually.
Beyond democratizing access for new users, the rental economy generates significant incremental demand through a different pathway: it enables existing owners to monetize their RVs during periods of non-use, improving the economics of ownership and increasing the financial justification for purchase. This creates a virtuous cycle in which rental revenue offsets ownership cost, more consumers can afford to own, and a larger fleet is available for rental, expanding the total addressable market simultaneously on both sides of the rental transaction.
Technological Innovation: Electrification, Solar, and Smart Integration
Technology is rapidly advancing the RV product proposition across multiple dimensions. The electric RV (E-RV) segment is the fastest-growing vehicle category within the market, projected to expand at a CAGR of approximately 23% as battery technology advances, charging infrastructure expands, and consumer demand for zero-emission outdoor recreation grows. Thor Industries, the world's largest RV manufacturer, has revealed the Airstream eStream concept, an electric travel trailer with its own powered axle and integrated battery pack capable of adding range to the tow vehicle rather than reducing it. Other manufacturers are developing fully electric Class B campervans targeted at the environmentally conscious urban adventurer demographic.
Solar power integration has become a primary purchase consideration for the growing segment of consumers pursuing off-grid camping travel without connection to campground electrical hookups. Modern high-end RVs feature roof-mounted monocrystalline solar arrays of 400-800 watts paired with lithium iron phosphate (LiFePO4) battery banks in the 100-200 amp-hour range, capable of powering air conditioning, refrigeration, lighting, and electronics for extended periods without shore power. Smart home integration including voice-activated control systems, connected climate management accessible via smartphone apps, automated slide-out and leveling systems, and AI-powered energy management that optimizes battery state based on weather and usage forecasting is increasingly standard in premium product tiers.
Growing Popularity of Outdoor Recreation and National Park Tourism
The structural growth of organized outdoor recreation in North America, Europe, and Australia is expanding the core addressable market for RV ownership and rental. National park visitation in the United States reached record levels in the years following the pandemic and has remained elevated, with the Great Smoky Mountains, Zion, Yellowstone, Grand Canyon, and Rocky Mountain national parks consistently exceeding previous visitor records. RV travel is the preferred access mode for a significant proportion of national park visitors, particularly families with children who value the combination of park access and self-contained accommodations.
In Australia, the caravan and motorhome sector similarly benefits from the country's strong outdoor tourism culture, with 908,513 registered caravans and motorhomes in 2025, a figure that represents a 21% increase since 2019. The Australian RV market is growing alongside infrastructure investment in caravan parks, free camping areas, and outback touring routes, creating a robust domestic demand base that is attracting international manufacturers.
VanContact Ultra Camper tires were launched by Continental, which helps provide increased durability, capacity, and stability for contemporary camper cars. Such innovations offer an opportunity for businesses to develop innovative components of their RVs that offer improved safety, durability, and performance in traveling far distances.
Newmar launched its first compact C RV, offering more flexible space configurations to increase mobility on the roads. Such innovations in the recreational vehicle market make it possible for companies to produce smaller yet more versatile RVs for travelers who wish to be on the road comfortably.
Lightship initiated the production of electric motorhome trailers under its AE.1 Cosmos Edition. These solutions offer improved aerodynamics, enhanced off-grid capabilities, and greater affordability. Such developments indicate ways for companies to explore the possibility of investing in recreational vehicles powered by electricity.
JCBL Group unveiled Signature Motorhomes that are aimed at making luxury recreational vehicles more desirable with premium features, advanced interior systems, and travel amenities. Such developments enable companies in the recreational vehicle market to explore different ways of incorporating premium customization and smarter interiors in recreational vehicles.
Electrification is set to play a significant role in the development of the recreational vehicle market as companies seek to create greener, quieter, and efficient travel solutions. Some firms are developing battery-electric RVs, hybrid drive systems, and power management systems for use in their high-end RVs. Companies like Winnebago Industries are further making progress in electric RVs by partnering with firms specializing in zero emission mobility architecture and off-grid battery efficiency. On the other hand, in May 2026, Synland debuted native electric RV platform, improving range, safety, integration, and sustainable mobile travel.
Connected vehicle technologies are revolutionizing recreational vehicles as companies incorporate telematics, predictive maintenance, and digital user interfaces. Modern smart RV technology involves remote diagnostics, energy management, GPS route optimization, and mobile-controlled appliance control. Major firms such as THOR Industries are now incorporating digital cabin systems for improved user experience and reduced downtime. Connected RV platforms are being utilized by rental fleets to remotely track RV status to avoid unexpected maintenance services, accelerating the recreational vehicle market penetration. For example, in October 2025, CPAC Systems unveiled Marivue infotainment platform, enhancing RV connectivity, digital control, entertainment, and smarter onboard experiences.
Lightweight composites, aluminum framing, and aerodynamics of automotive designs are gaining traction among manufacturers because of their benefits in improving fuel consumption and towing capabilities. Lightweight vehicles can accommodate more payload while reducing operating costs, which is important for both individual consumers and rentals. Companies like Forest River are focusing on innovation in structural engineering and insulations performance within its line of travel trailers. The trend of increasing efficiency standards and transportation regulations in the United States continues to drive optimization efforts, further reshaping the recreational vehicle market dynamics. For example, in January 2026, Evotrex unveiled its PG5 power-generating travel trailer at CES, highlighting off-grid energy and mobility.
The development of outdoor tourism infrastructure is playing an instrumental role in accelerating the overall demand in the recreational vehicle market. Campgrounds, highway rest stops, and recreational parks that rely on utilities are being upgraded to ensure increased convenience of RV usage. The government of the United States and other nations are also investing in parks, tourism corridors, and other outdoor recreational sites, making RV tourism even more appealing. For example, in December 2025, Dubai introduced Middle East’s first integrated RV route, expanding tourism connectivity, travel infrastructure, and regional recreational mobility.
Access to flexible mobility solutions is becoming an emerging trend in the recreational vehicle market. The younger generation of customers and travelers is increasingly opting for renting, subscription services, and sharing of the vehicles rather than owning them directly. RV rental services and fleets are investing in adding connected vehicles with luxurious but compact interiors in their premium collections. Manufacturers are developing RVs that would be more suited to be rented out, while offering durability, predictive service, and modular maintenance capabilities. For example, in August 2025, Uber launched intercity motorhomes, offering flexible premium travel for families, flyers, and weekend road trips.
Interest Rate Sensitivity and Financing Headwinds
Recreational vehicles, particularly motorhomes, whose purchase prices for Class A coaches can exceed USD 500,000, are among the most interest-rate-sensitive consumer product categories in existence. The elevated interest rate environment of 2024-2025, with prime rates significantly above pre-2022 norms, has meaningfully compressed buyer demand for large-ticket motorized RV units, where monthly financing costs at current rates can double or triple relative to the historically low-rate era of 2020-2021. Winnebago Industries' stock declined approximately 40% over six months in 2024 as the market digested the implications of sustained high borrowing costs for RV demand.
The rate-sensitivity effect is asymmetric across vehicle categories: towable RVs at price points of USD 20,000-60,000 are less severely affected than motorhomes at USD 100,000-500,000+, where even a 1-2 percentage point increase in financing rates can materially change the monthly payment calculus. The market has responded with a compositional shift toward more affordable towable units, which partially offsets the volume impact of motorhome demand softness but affects revenue mix.
Rising Costs and U.S. Tariff Uncertainty
New RV prices are expected to increase 8-10% across most product lines in 2025-2026, driven by a combination of domestic input cost inflation and U.S. tariff-related supply chain pressures. RV manufacturers source components from diverse supply chains that include both domestic and imported electronics, hardware, appliances, glass, aluminum extrusions, and chassis components. Tariff changes affecting steel, aluminum, and Chinese-origin electronics and components directly impact bill of materials costs for manufacturers who have limited ability to substitute domestic alternatives in the short term.
This cost pressure arrives at a commercially sensitive moment dealers are already absorbing inventory overhang, with dealer stocks running approximately 16% above year-prior levels in mid-2025. When rising vehicle prices combine with high dealer inventory and rate-sensitive consumer demand, the result is margin compression at the retail level, increased discounting, and extended time-on-lot for new inventory that further pressures dealer economics.
Campsite and Public Land Infrastructure Constraints
The growth of RV travel has strained the infrastructure on which it depends. Campsite availability at popular destinations national parks, state parks, and Bureau of Land Management (BLM) dispersed camping areas has not kept pace with the growth in RV ownership and rental. Reservations at popular national park campgrounds now fill months in advance, creating frustration for spontaneous travelers and potentially limiting trip frequency for owners who cannot reliably access their preferred destinations. Federal budget constraints affecting the National Park Service (NPS) and BLM create ongoing uncertainty about campground maintenance standards, amenity availability, and the responsiveness of the public land system to growing demand.
This infrastructure constraint is a genuine long-term growth barrier that the industry cannot resolve independently it requires federal and state investment in campground capacity, digital reservation infrastructure improvements, and potentially regulatory facilitation of private campground development on appropriate public lands adjacent to existing recreation areas.
Environmental Regulation and the Emissions Transition
Recreational vehicles, particularly motorhomes with large gasoline or diesel engines, face increasing regulatory pressure from emissions standards that are progressively tightening at both the federal and state level, particularly in California. The California Air Resources Board (CARB) has historically set the de facto national standard for vehicle emissions through the market power of the California market. Manufacturers investing in electric RV development are positioning ahead of these regulatory trends, but the transition from internal combustion powertrains to electric in a vehicle category where range, weight, and charging infrastructure present unique engineering challenges requires significant capital investment over an extended development timeline.
The Expert Market Research's report titled “Global Recreational Vehicle Market Report and Forecast 2026-2035” offers a detailed analysis of the market based on the following segments:
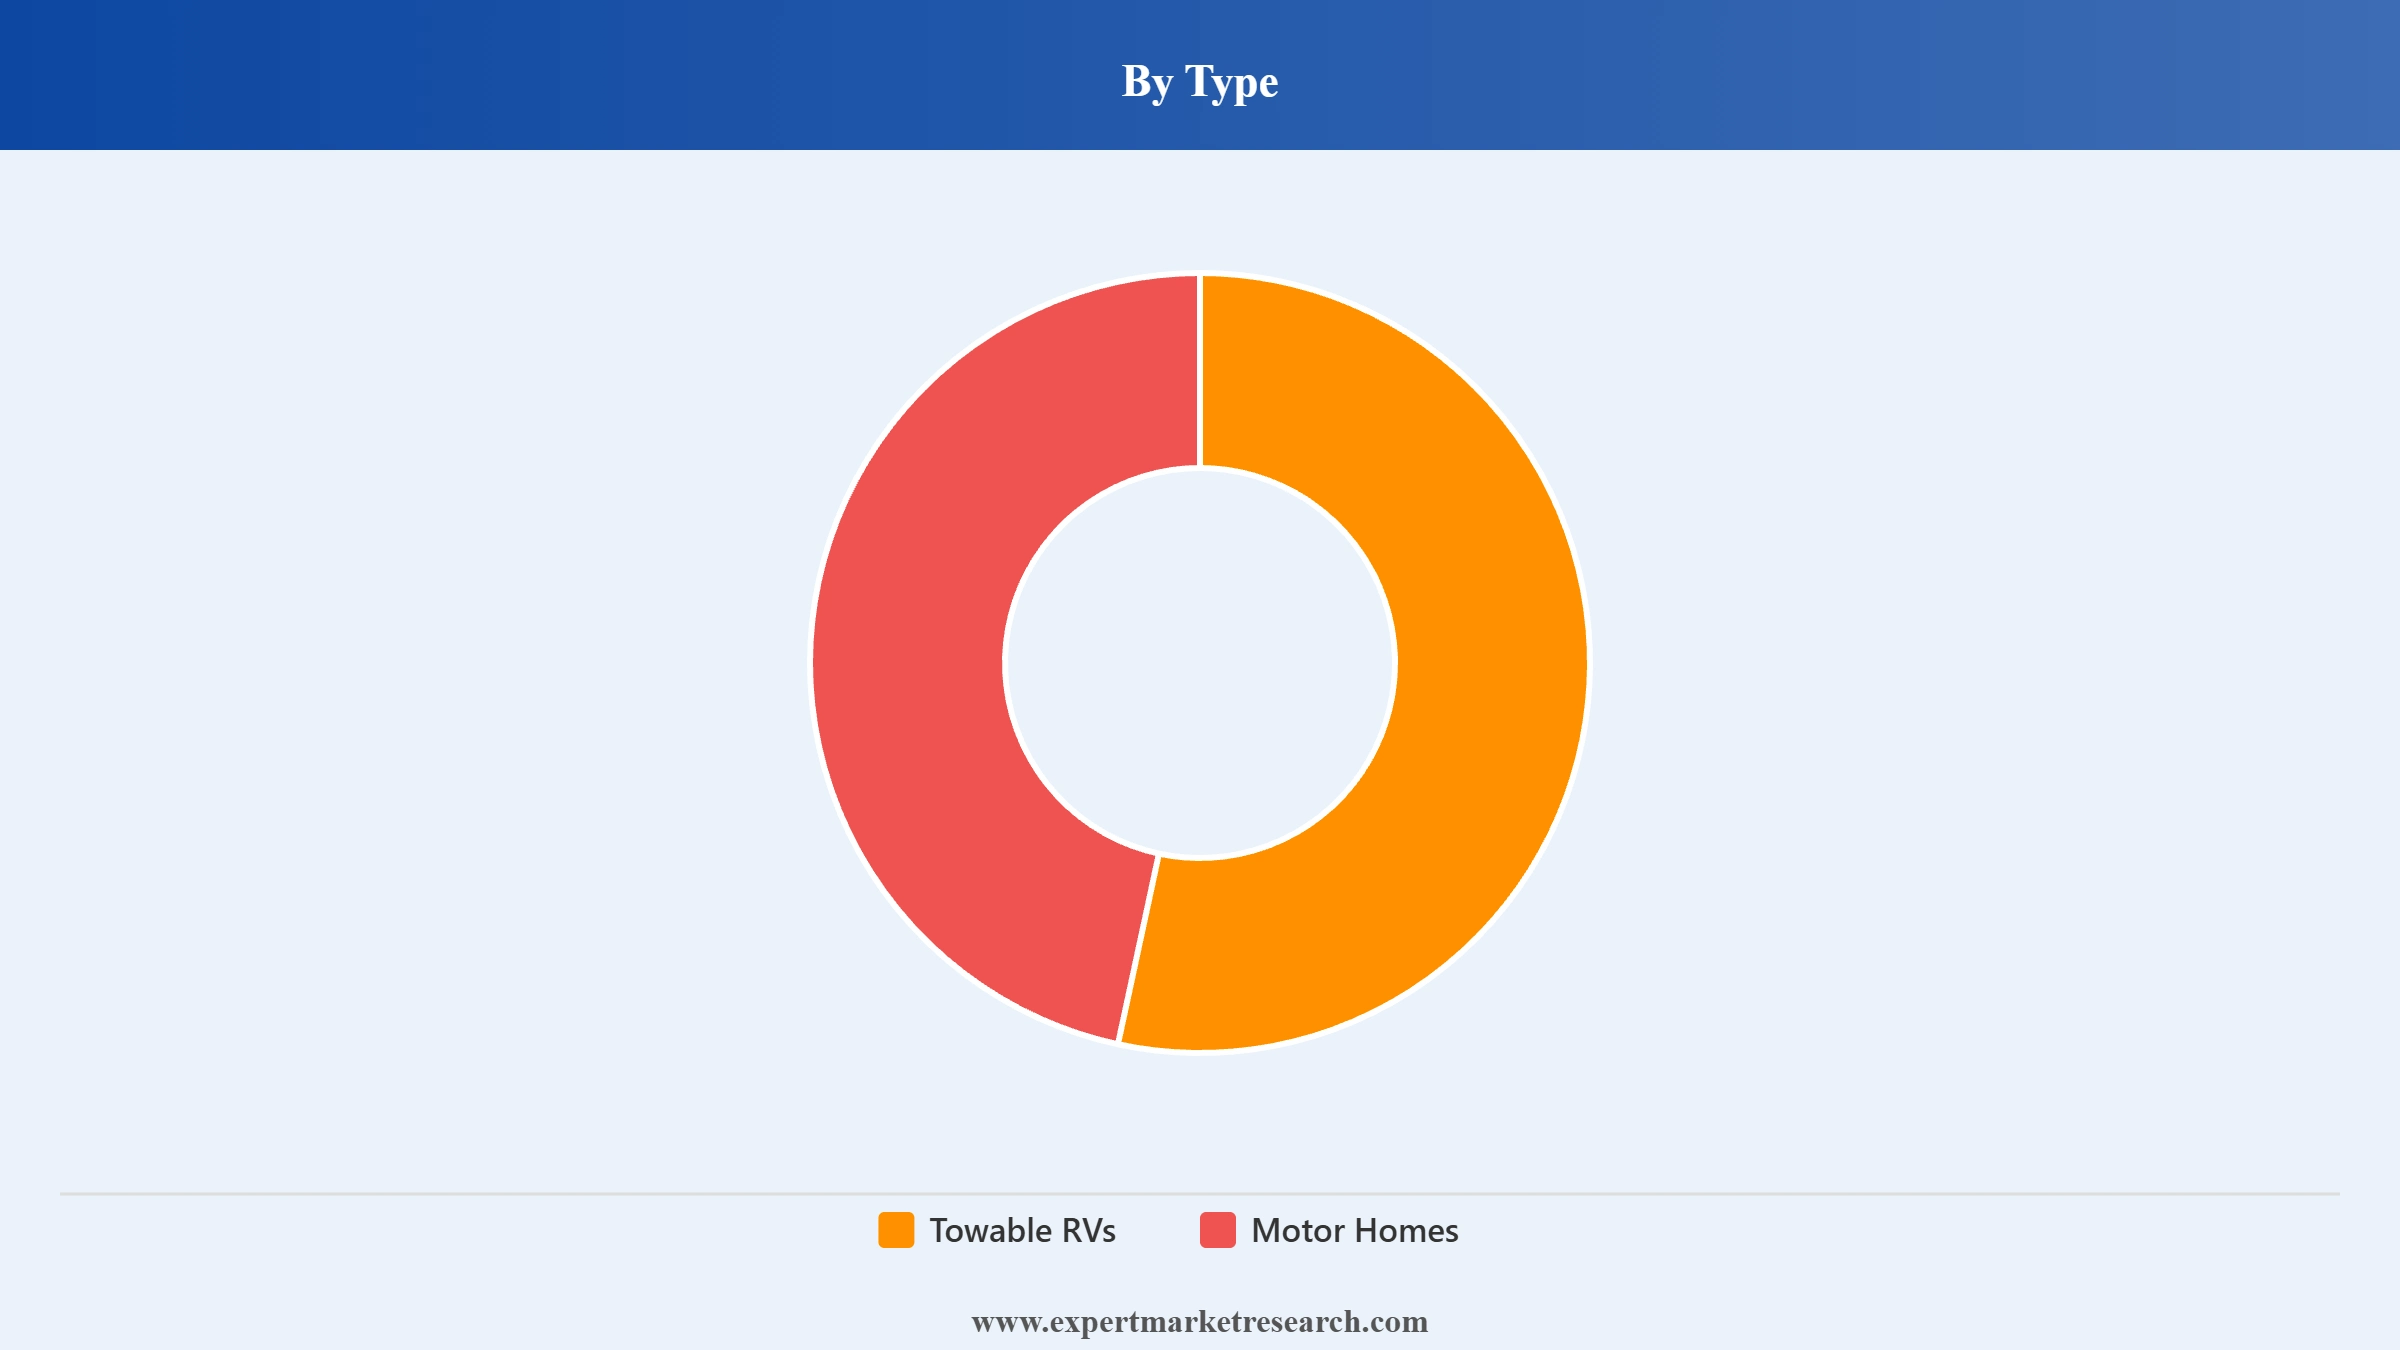
Market Breakup by Type
Market Breakup by Type
Key Insight: Towable RVs continue to attract demand due to cost efficiency, lightweight designs, and flexible towing compatibility. Meanwhile, motor homes are expanding through premium comfort, smart connectivity, and self-contained mobility features. For example, in September 2025, THOR Industries introduced range-extended electric motorhome, improving travel range, sustainability, efficiency, and off-grid capability. Both segments are benefiting from innovations such as electrification, off-grid systems, compact layouts, and digital control technologies, supporting broader growth in the recreational vehicle market.
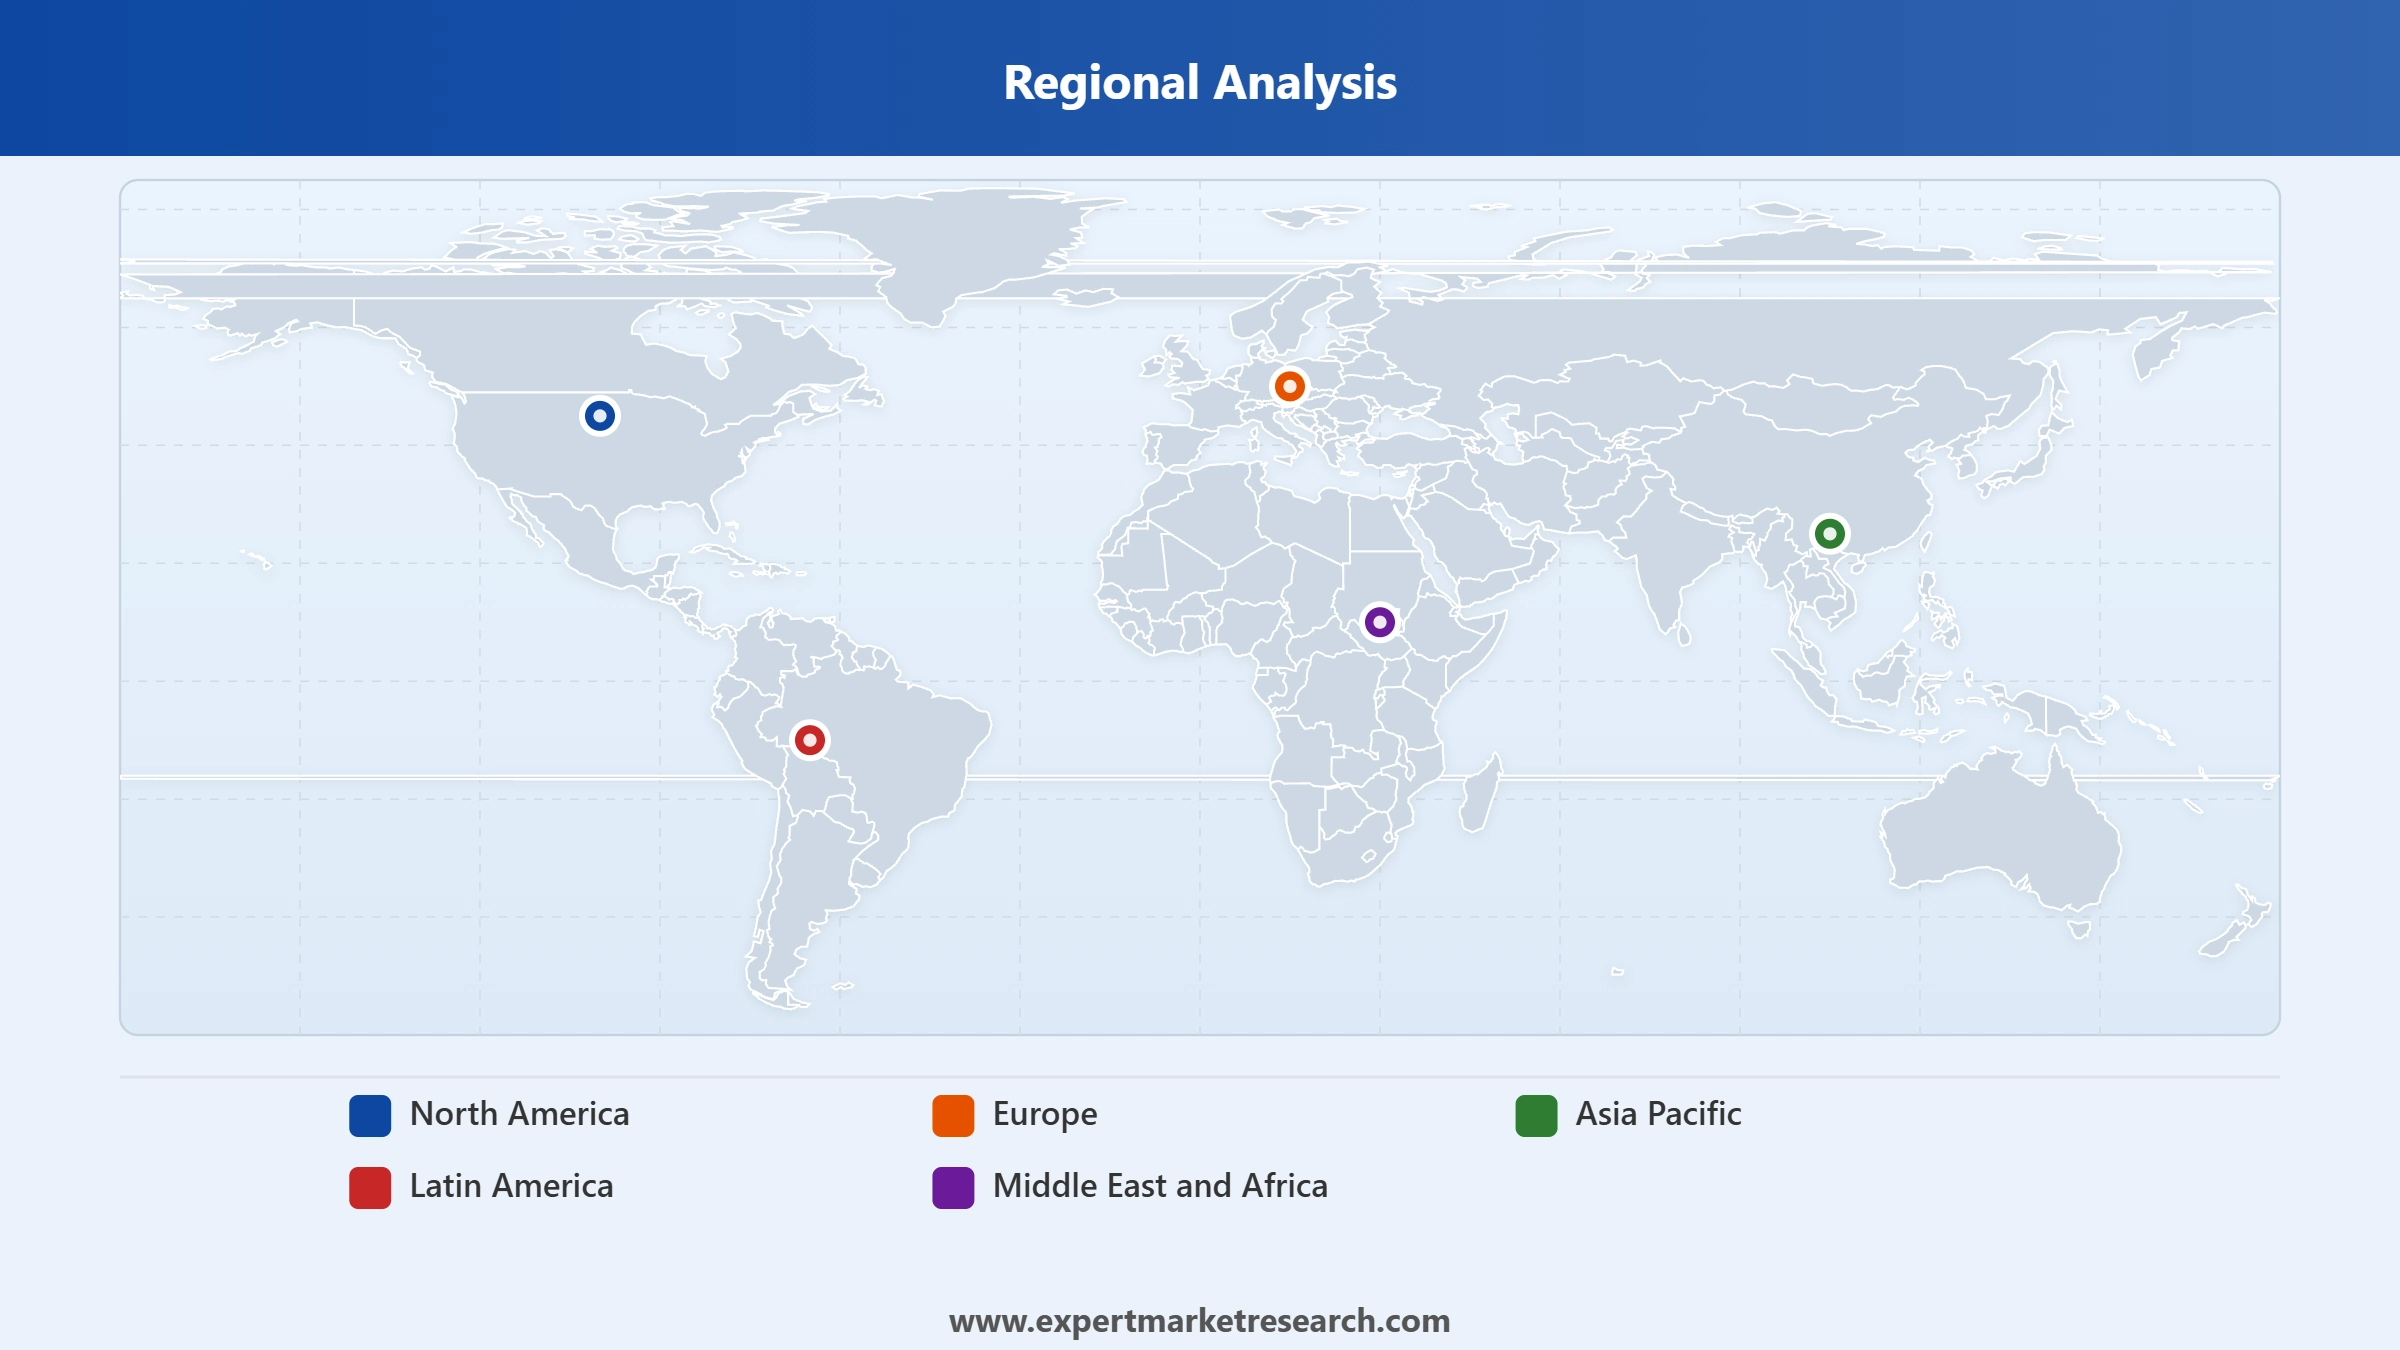
Market Breakup by Region
Key Insight: The ongoing dominance of the North America recreational vehicle market is led by ownership culture, production clustering, and established infrastructure for outdoor tourism. Europe observes market growth due to innovations in compact vehicles, sustainable design, and strong caravan culture. Asia Pacific is growing due to increasing domestic travel, changing urban mobility trends, and growth of rental platforms. For example, in May 2026, Nissan updated Japan’s Clipper Van, adding affordable camper conversion option for compact, flexible recreational travel. Latin America is growing due to tourism development and improved road access which encourages the use of RVs. Middle East and Africa represent niche markets, but with significant potential due to adventure tourism, demand for desert tours, and specialized off-road recreational vehicles.

Read more about this report - REQUEST FREE SAMPLE COPY IN PDF
By type, towable recreational vehicles lead the majority of the market demand due to tourism flexibility and affordability
Towable recreational vehicles account for the dominant share of the market due to factors like cost-effectiveness, flexibility, and availability across various towing vehicle models. Travel trailer recreational vehicles, fifth-wheel trailer RVs, and pop-up camping units are becoming popular among price-sensitive tourists and nature enthusiasts. New trends in the recreational vehicle market like composite construction, energy-efficient electric RVs, and autonomous power systems are making travel more convenient and sustainable. For example, in January 2026, Honda unveiled Base Station prototype, offering lightweight towable camping with modular design, smart technology, and compact versatility.
Read more about this report - REQUEST FREE SAMPLE COPY IN PDF
Motorized RVs represent the fastest-growing category of the recreational vehicle market, propelled mainly by an increase in the demand for superior travel experience, travel, and comfort. Motorized RVs are designed for efficient and luxurious travel. Manufacturers are currently inclining towards developing compact Class C motorized RVs, high-end entertainment systems, state-of-the-art safety measures, and energy efficiency in travel.
North America dominates the market due to mature RV culture infrastructure
North America represents the largest regional recreational vehicle market due to its strong culture of owning recreational vehicles, a well-developed network of campsites, high level of highway connectivity, and extensive coverage by manufacturers. North America is favored by its mature dealer network, higher levels of rentals, and consumers' preference for traveling by road over long distances. Premium motor homes, electric-powered RVs, and advanced towing systems are being introduced to cater to customers' changing requirements. To cater to the continuous demand in this region, in April 2026, Lightship expanded its Colorado facility, increasing manufacturing capacity to accelerate electric RV trailer production and market scalability.
Read more about this report - REQUEST FREE SAMPLE COPY IN PDF
Asia Pacific is emerging as the fastest-growing regional market due to the growth in domestic tourism, development of highway infrastructure, and changes in lifestyle trends, which are leading to an increased acceptance of recreational vehicles. Manufacturers are concentrating on developing smaller, lighter, and multipurpose RVs, which can be used for both urban and rural driving. Rising travel expenditure of middle-class travelers and preference for road trips are also contributing to the recreational vehicle market revenue.
There is high competition in the market since manufacturers are now shifting their attention towards electric technology, smart connections, weight reduction, and premium off-grid mobility. Leading recreational vehicle market players are making substantial investments into modular interiors, energy systems that can run using solar power, predictive maintenance software, and aerodynamic vehicle design. Adventure tourism, upgrade in rental fleets and the adoption of subscription services for RVs presents a huge opportunity for players in the industry.
The industry also presents opportunities for AI diagnostics, batteries management, and cabin designs that allow multiple functions for durability. Partnerships between manufacturers and suppliers of batteries, software developers, and composite material manufacturers are helping firms reduce production time and customize products better. Some recreational vehicle companies are diversifying into compact RVs to attract young customers. In addition, there are opportunities for aftermarket services, connected navigation, and maintenance services for fleets.
Founded in 1980 and located in Elkhart, United States, Thor Industries Inc. is a leading RV manufacturing company. The firm produces motor homes, travel trailers, fifth wheel RVs, and advanced electric recreational vehicles. The company focuses on lightweight constructions, smart mobility, and eco-friendly RVs to cater to the growing needs of luxury RV users and off-grid travel enthusiasts.
Founded in 1996 and based in Elkhart, Indiana, United States, Forest River Inc. is one of the largest manufacturers of RVs. The firm manufactures a wide range of vehicles, including travel trailers, toy haulers, fifth wheels, and motor homes. It contributes to the market by providing diversified products, reliable models, and innovation in terms of comfort, family vacation, and outdoor adventure.
Winnebago Industries Inc. was incorporated in the year 1958, with its headquarters located in the United States. Winnebago Industries Inc. holds an important position in the recreational vehicle industry by providing its consumers with high-end motor homes, towable recreational vehicles, and vehicles intended for adventurous journeys.
REV Group Inc. is a company that was founded in 2010 with its headquarters located in Brookfield, Wisconsin, United States. With its brands like American Coach and Fleetwood RV, it provides safety systems, comfort-oriented interiors, and luxurious travel options to customers.
Other key players in the market include Nexus RVS, Tiffin Motorhomes Inc., and Triple E Canada Ltd., among others.
*Please note that this is only a partial list; the complete list of key players is available in the full report. Additionally, the list of key players can be customized to better suit your needs.*
Unlock the latest insights with our recreational vehicle market trends 2026 report. Discover regional growth patterns, consumer preferences, and key industry players. Stay ahead of competition with trusted data and expert analysis. Download your free sample report today and drive informed decisions in the market.
North America Underground Mining Vehicle Market


Upto 15% Off
USD
$2499 $2249
$3999 $3599
$4999 $4249
$5999 $5099


*While we strive to always give you current and accurate information, the numbers depicted on the website are indicative and may differ from the actual numbers in the main report. At Expert Market Research, we aim to bring you the latest insights and trends in the market. Using our analyses and forecasts, stakeholders can understand the market dynamics, navigate challenges, and capitalize on opportunities to make data-driven strategic decisions.*
The global recreational vehicle (RV) market is projected to grow at a CAGR of 11.70% between 2026 and 2035.
The major drivers of the industry, such as the rising use of the products, increased exposure leading to increased revenues, and the incorporation of sophisticated techniques into RVs, are expected to aid the market growth.
The key market trend guiding the industry growth includes the expanding RV fleet by rental operators of renting recreational vehicles (RVs) to meet the increasing demand from clients.
The major regions in the industry are North America, Latin America, the Middle East and Africa, Europe, and the Asia Pacific.
Towable RVs and motor homes are the leading types of the product in the industry.
The major players in the industry are Thor Industries Inc., Forest River Inc., Winnebago Industries Inc., REV Group Inc., Nexus RVS, and Tiffin Motorhomes Inc., Triple E Canada Ltd., among others.
Explore our key highlights of the report and gain a concise overview of key findings, trends, and actionable insights that will empower your strategic decisions.
| REPORT FEATURES | DETAILS |
| Base Year | 2025 |
| Historical Period | 2019-2025 |
| Forecast Period | 2026-2035 |
| Scope of the Report |
Historical and Forecast Trends, Industry Drivers and Constraints, Historical and Forecast Market Analysis by Segment:
|
| Breakup by Type |
|
| Breakup by Region |
|
| Market Dynamics |
|
| Competitive Landscape |
|
| Companies Covered |
|
| Report Price and Purchase Option | Explore our purchase options that are best suited to your resources and industry needs. |
| Delivery Format | Delivered as an attached PDF and Excel through email, with an option of receiving an editable PPT, according to the purchase option. |
Datasheet
One User
USD 2,499
USD 2,249
tax inclusive*
Single User License
One User
USD 3,999
USD 3,599
tax inclusive*
Five User License
Five User
USD 4,999
USD 4,249
tax inclusive*
Corporate License
Unlimited Users
USD 5,999
USD 5,099
tax inclusive*
*Please note that the prices mentioned below are starting prices for each bundle type. Kindly contact our team for further details.*
Flash Bundle
Small Business Bundle
Growth Bundle
Enterprise Bundle
*Please note that the prices mentioned below are starting prices for each bundle type. Kindly contact our team for further details.*
Flash Bundle
Number of Reports: 3
20%
tax inclusive*
Small Business Bundle
Number of Reports: 5
25%
tax inclusive*
Growth Bundle
Number of Reports: 8
30%
tax inclusive*
Enterprise Bundle
Number of Reports: 10
35%
tax inclusive*
How To Order

Select License Type
Choose the right license for your needs and access rights.

Click on ‘Buy Now’
Add the report to your cart with one click and proceed to register.

Select Mode of Payment
Choose a payment option for a secure checkout. You will be redirected accordingly.
Strategic Solutions for Informed Decision-Making
Gain insights to stay ahead and seize opportunities.

Get insights & trends for a competitive edge.

Track prices with detailed trend reports.

Analyse trade data for supply chain insights.

Leverage cost reports for smart savings

Enhance supply chain with partnerships.

Connect For More Information
Our expert team of analysts will offer full support and resolve any queries regarding the report, before and after the purchase.
Our expert team of analysts will offer full support and resolve any queries regarding the report, before and after the purchase.
We employ meticulous research methods, blending advanced analytics and expert insights to deliver accurate, actionable industry intelligence, staying ahead of competitors.
Our skilled analysts offer unparalleled competitive advantage with detailed insights on current and emerging markets, ensuring your strategic edge.
We offer an in-depth yet simplified presentation of industry insights and analysis to meet your specific requirements effectively.




