

Consumer Insights
Uncover trends and behaviors shaping consumer choices today
Procurement Insights
Optimize your sourcing strategy with key market data
Industry Stats
Stay ahead with the latest trends and market analysis.
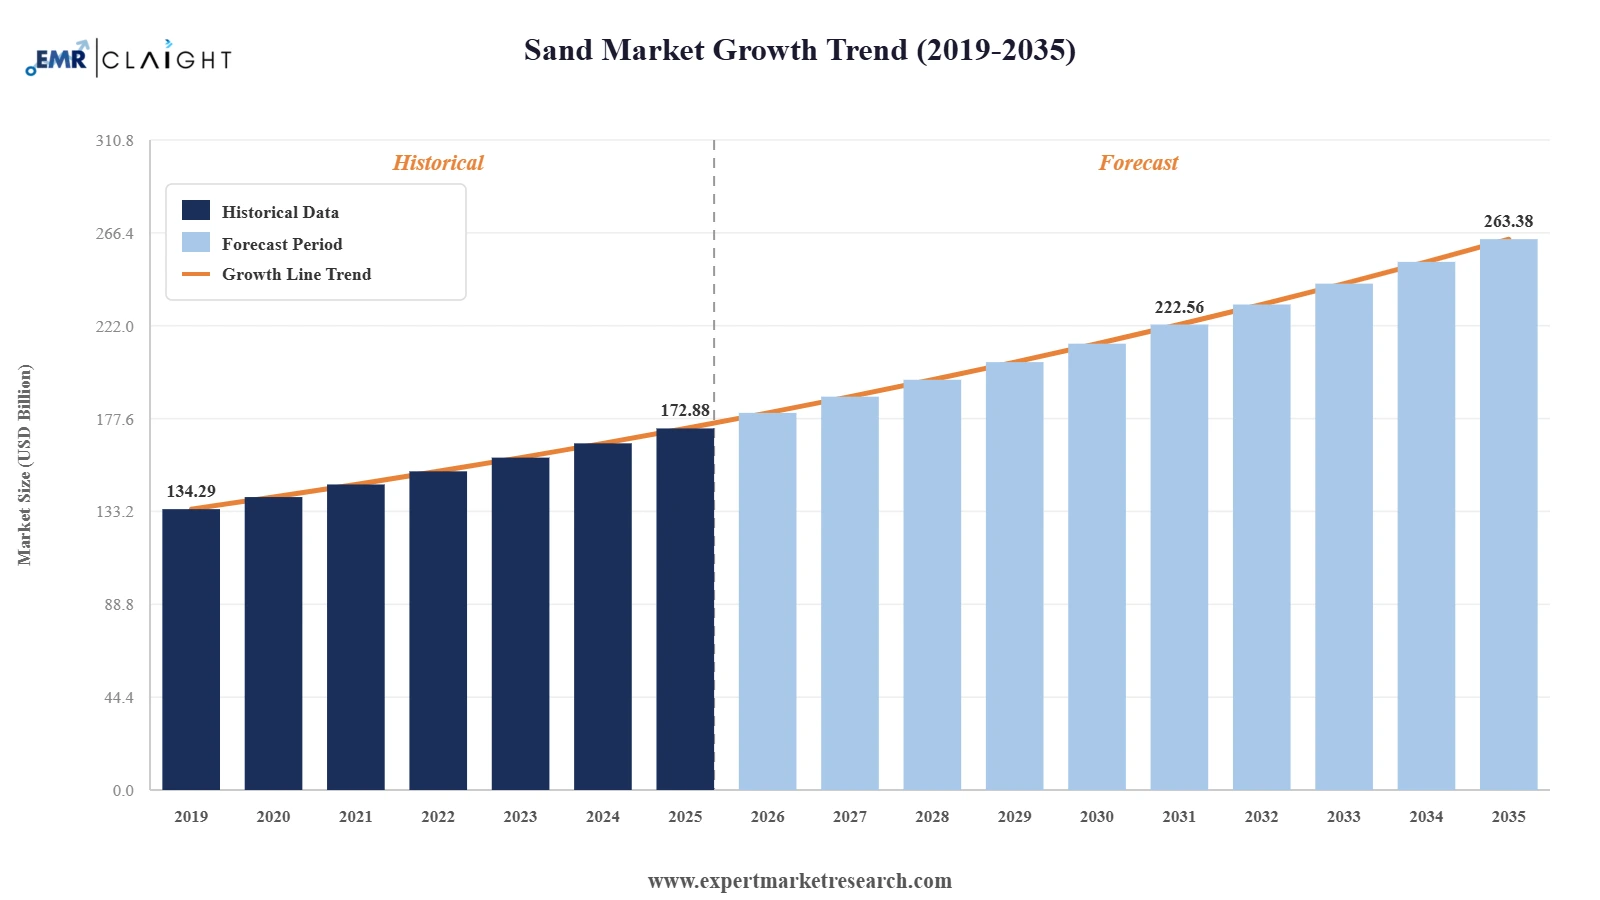
The sand market reached a value of USD 172.88 Billion at 2025 and is projected to expand at a CAGR of around 4.30% during the forecast period of 2026-2035 to reach USD 263.38 Billion by 2035. With rapid urbanization fuelling construction activity, expanding glass and semiconductor manufacturing demand, rising use of sand in oil and gas operations, and a growing focus on sustainable and responsible extraction practices.
According to The Milli Chronicle, global demand for sand has increased sharply in recent decades, driven by rapid urbanization and large-scale construction projects. The United Nations Environment Programme notes that sand and gravel are the most extracted solid materials worldwide, surpassing fossil fuels and biomass in volume. The supply squeeze is pushing up construction costs globally and intensifying pressure on policymakers to strengthen resource governance frameworks.
In April 2026, the Supreme Court of India strongly criticized state governments for failing to control illegal sand mining activities in the Chambal Gharial Sanctuary, highlighting the severe environmental damage caused to river ecosystems and wildlife habitats. The court directed authorities to strengthen surveillance systems, including mandatory GPS tracking, live monitoring, and rapid enforcement measures to curb unauthorized sand extraction and improve resource governance practices.
Read more about this report - REQUEST FREE SAMPLE COPY IN PDF
| Global Sand Market Report Summary | Description | Value |
| Base Year | USD Billion | 2025 |
| Historical Period | USD Billion | 2019-2025 |
| Forecast Period | USD Billion | 2026-2035 |
| Market Size 2025 | USD Billion | 172.88 |
| Market Size 2035 | USD Billion | 263.38 |
| CAGR 2019-2025 | Percentage | XX% |
| CAGR 2026-2035 | Percentage | 4.30% |
| CAGR 2026-2035 - Market by Region | Asia Pacific | 4.9% |
| CAGR 2026-2035 - Market by Country | India | 5.7% |
| CAGR 2026-2035 - Market by Country | China | 4.7% |
| CAGR 2026-2035 - Market by End Use | Construction | 6.2% |
| CAGR 2026-2035 - Market by End Use | Glass Manufacturing | 5.8% |
| Market Share by Country 2025 | Italy | 2.6% |
The global sand market is undergoing a meaningful shift driven by surging infrastructure activity, expanding industrial applications, and rising environmental awareness. Construction continues to be the largest end-use, while glass manufacturing and semiconductor-grade silica are gaining fast momentum. Oil and gas operations remain a steady demand driver, and sustainability concerns are reshaping extraction practices across major markets.
In July 2024, funds managed by affiliates of Apollo Global Management completed their acquisition of U.S. Silica Holdings, Inc. in an all-cash transaction valuing the company at an enterprise value of approximately USD 1.85 billion. Shareholders received USD 15.50 per share in cash. The deal took U.S. Silica private after more than a century as a public company. The acquisition signals strong institutional confidence in industrial minerals, with U.S. Silica continuing under its existing management team and retaining its brand, production facilities, and logistics capabilities across more than 27 North American sites.
In May 2024, Covia Holdings LLC completed the acquisition of R.W. Sidley's Industrial Minerals Division, which operates a silica sand mining facility in Thompson, Ohio. The acquisition added a new quarry and high-quality reserves to Covia's network, enhancing its product range across filtration media, premium golf course sand, and athletic field infill. The transaction allowed Covia to extend its reach to a broader customer base and consolidate leading product brands such as Pro/Angle and BESTSAND under one roof, strengthening its competitive positioning across multiple industrial sand segments.
In November 2024, Covia Energy and Black Mountain Sand completed a merger to create Iron Oak Energy Solutions, a new and prominent North American proppant supplier. The combined entity boasts an annual production capacity of 30 million tons, with operations strategically located across major shale basins. The merger strengthened supply chain integration and enhanced cost efficiency for upstream oil and gas operators relying on frac sand. Iron Oak's scale and geographic footprint position it as a key supplier in the growing North American energy sector.
In November 2024, U.S. Silica Holdings announced price increases of up to 20% across its Industrial and Specialty Products segment, covering silica, aplite, limestone, diatomaceous earth, and related products. The increases took effect from January 1, 2025, and were implemented to address escalating operational costs while enabling continued reinvestment in production infrastructure. The announcement reflects robust underlying demand conditions in the industrial sand market and the company's pricing leverage, as demand for high-purity silica in specialty applications continues to outpace supply additions in several key product categories.
In February 2024, Sibelco North America entered into a strategic partnership with Ojing Technology for the supply of high-purity quartz sand, in an agreement valued at USD 350 million. The deal was designed to strengthen supply arrangements for advanced industrial applications in the semiconductor, solar energy, and specialty glass sectors. The partnership highlights the growing strategic importance of high-purity silica sand in technology-driven industries and positions Sibelco as a preferred supplier as demand for precision-grade mineral inputs from clean-energy and chip-manufacturing supply chains continues to grow.
Global construction spending reached USD 1.98 trillion by August 2025, marking a 7.4% increase since 2019. The African Development Bank invested approximately USD 13.5 billion in 2022 to develop over 18,000 km of roads and 25 transportation corridors, with an additional USD 500 million slated for cross-border connectivity projects. This expanding infrastructure pipeline continues to drive construction sand demand, which functions as the core aggregate in concrete, mortar, and asphalt, and remains the single largest end-use category in the global sand market growth trajectory.
China's insulating glass production reached 9,868,000 square metres in April 2024, illustrating the scale of glass manufacturing activity in the Asia Pacific region. Globally, glass container production has grown at 1.7% per year since 2012, sustaining consistent demand for high-quality silica sand. Beyond traditional glass, the semiconductor sector now requires ultra-pure silica as a critical material input. This dual demand from both conventional glass producers and advanced technology manufacturers is broadening the sand market's growth base and increasing the value derived per unit of sand processed.
The oil and gas industry remains a critical end-user of sand, particularly as a proppant in hydraulic fracturing operations. The United States produced approximately 12.8 million barrels of crude oil per day in 2024, with shale formations requiring large and consistent quantities of frac sand to sustain production rates. Apollo Global Management's acquisition of U.S. Silica Holdings in July 2024 for USD 1.85 billion reflects strong institutional conviction in the longevity of frac sand demand, as upstream operators continue to intensify drilling activity and increase proppant volumes per well.
Sand extraction faces growing scrutiny across major markets, with several governments in Asia and Europe tightening river sand mining regulations to protect ecosystems and freshwater reserves. In response, major producers are investing in advanced extraction and processing technologies to reduce their environmental footprint. Sibelco's USD 350 million high-purity quartz sand supply agreement with Ojing Technology in February 2024 reflects this pivot toward cleaner, precision-grade supply chains. Across the industry, companies are adopting water recycling, dust suppression, and land rehabilitation measures to meet tightening regulatory standards and maintain their social licence to operate.
The Expert Market Research's report titled “Global Sand Market Report and Forecast 2026-2035” offers a detailed analysis of the market based on the following segments:
Market Breakup by End Use
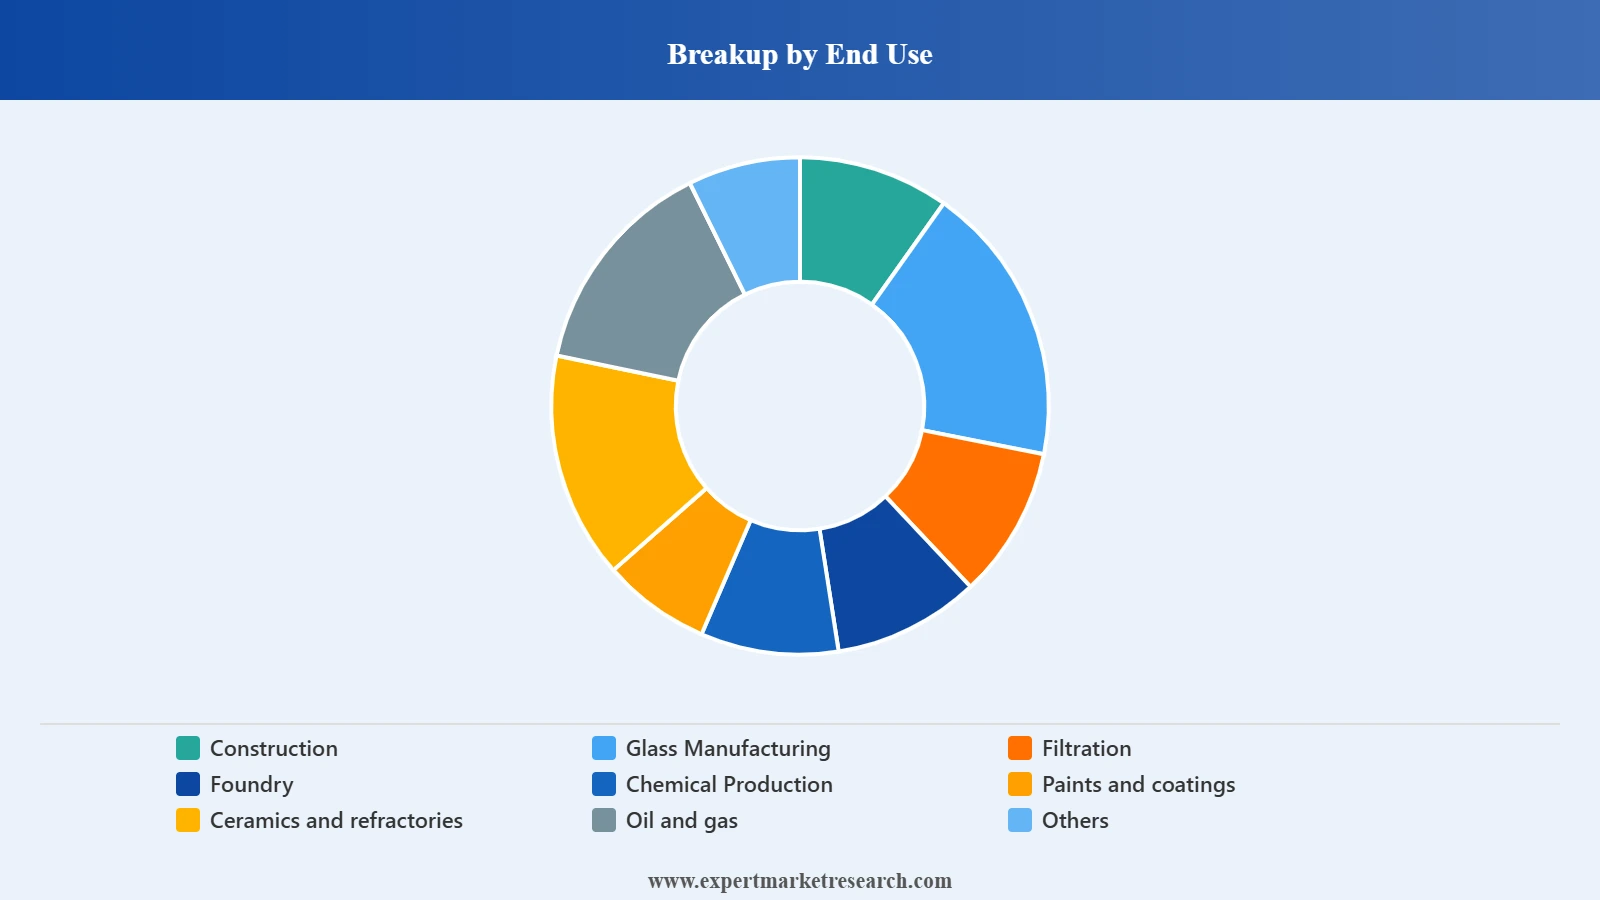
Key Insight: Construction is the dominant end-use segment in the global sand market, reflecting sand's indispensable role in concrete, mortar, and asphalt. The housing development sector alone accounts for roughly 40% of global concrete consumption, sustaining steady demand across residential and commercial construction projects. Glass manufacturing is the fastest-growing industrial segment, supported by rising demand for flat glass, container glass, specialty glass, and solar photovoltaic panels. The oil and gas segment is also a major contributor, where sand serves as a proppant in hydraulic fracturing. Companies such as U.S. Silica Holdings and Covia Holdings supply high-quality silica sand across multiple end-use categories, leveraging diversified product portfolios and large-scale logistics networks.
Market Breakup by Region
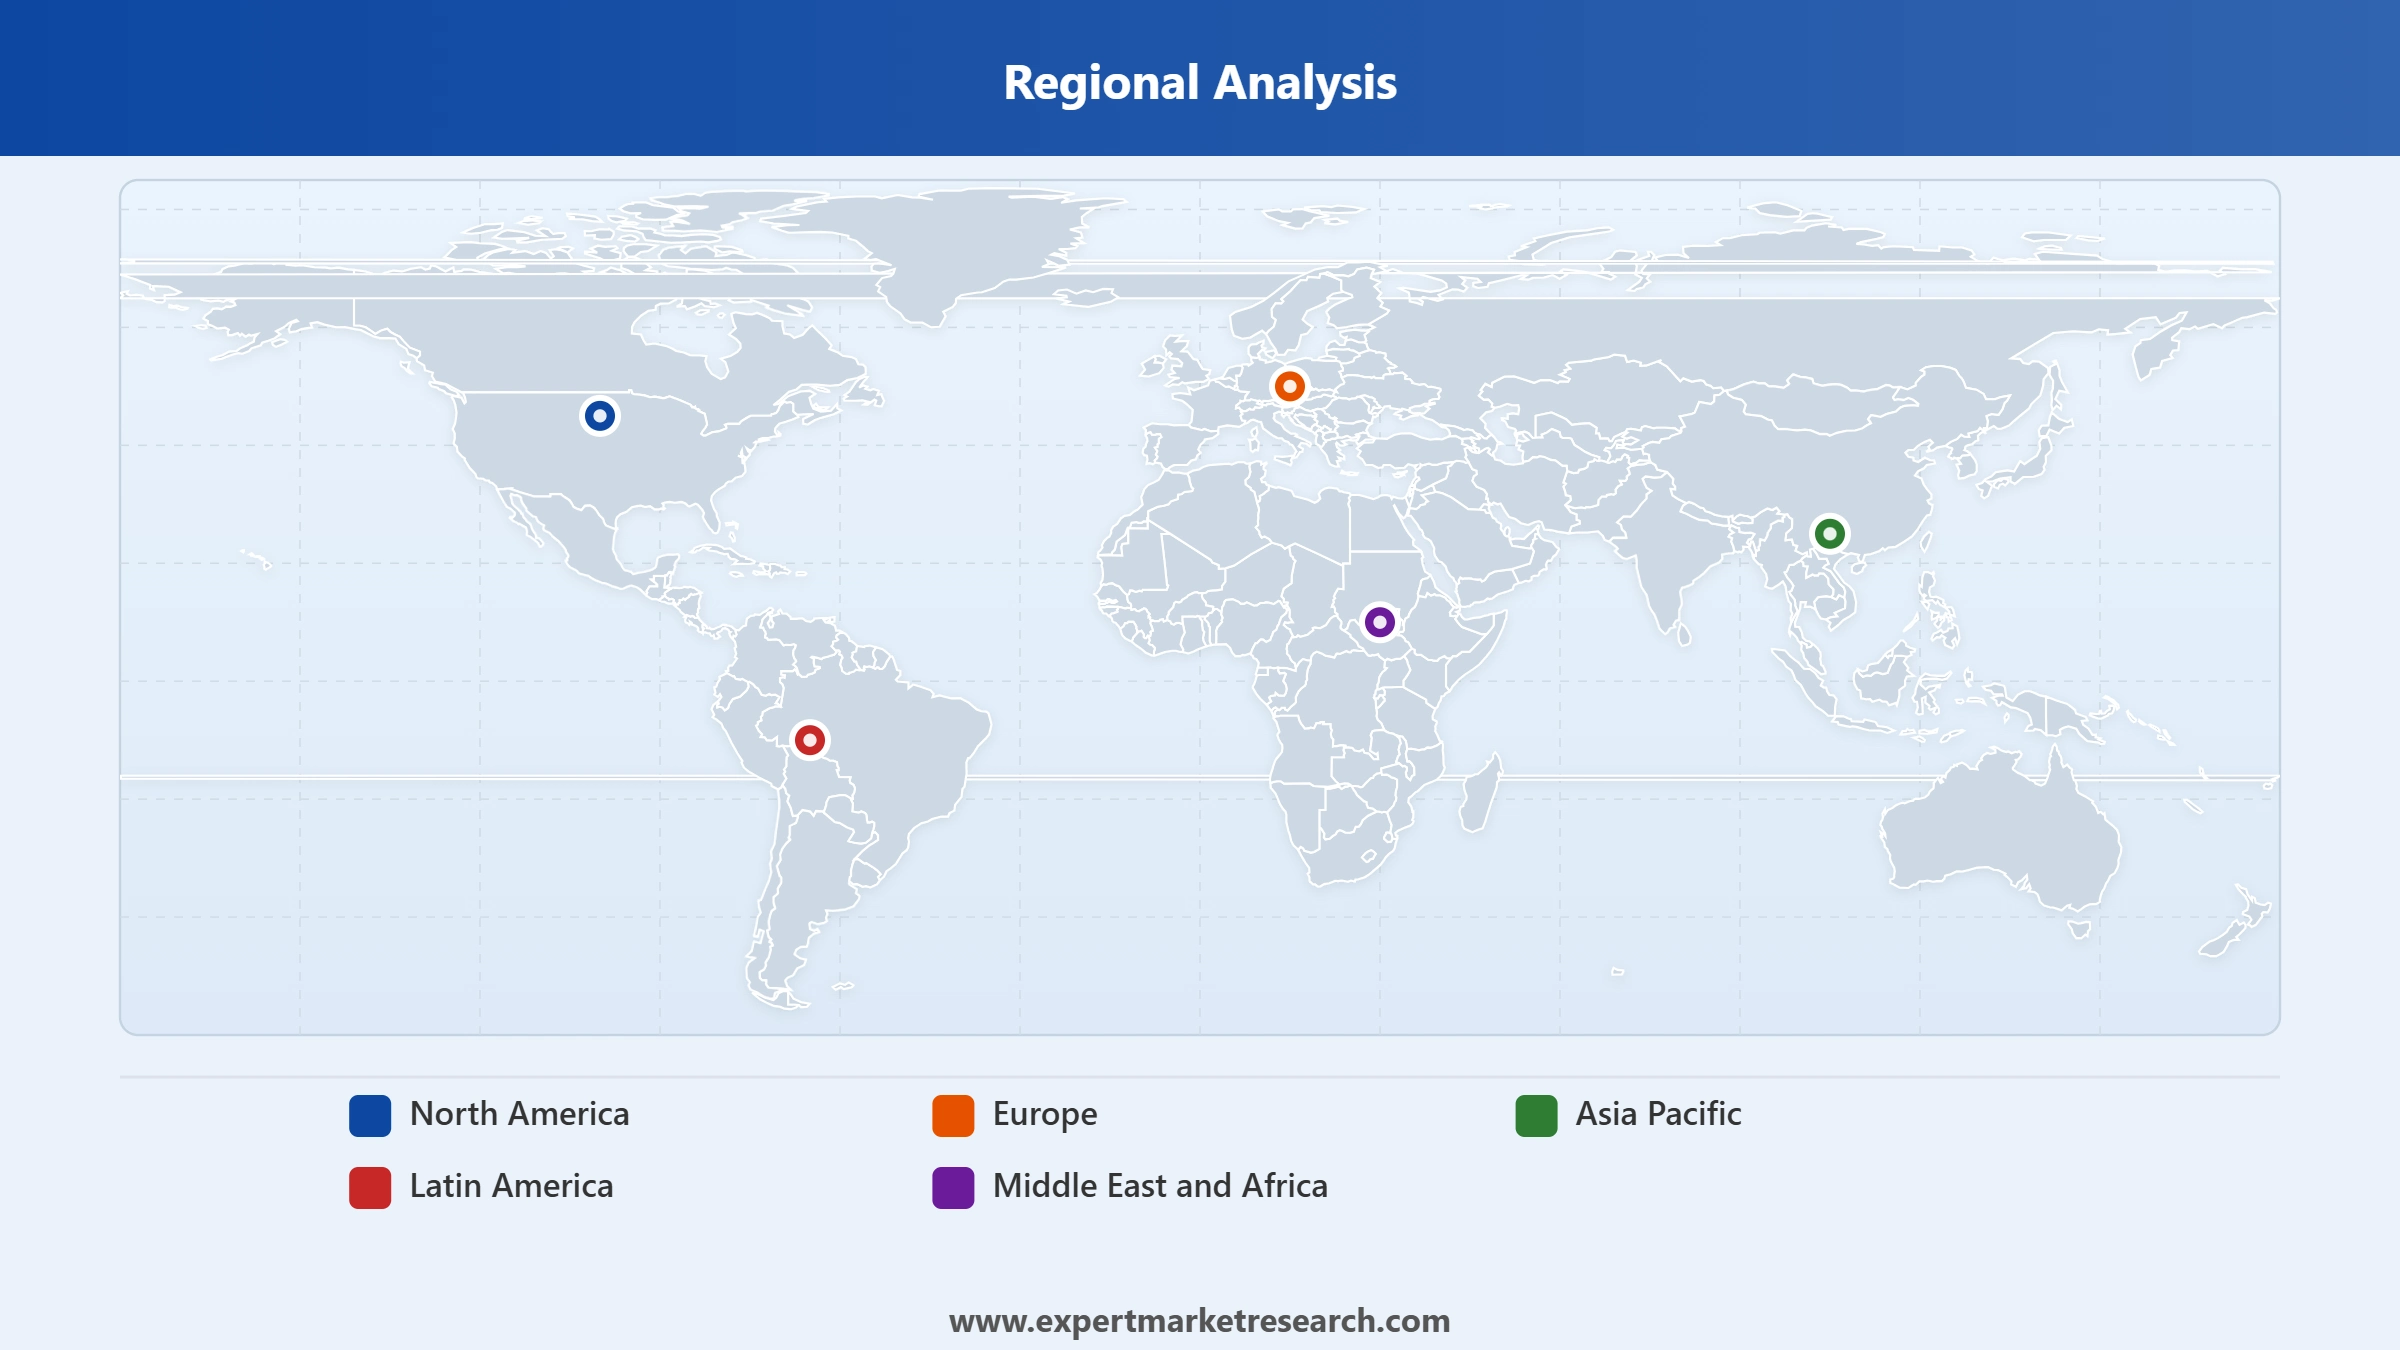
Key Insight: Asia Pacific is the fastest-growing regional market in the global sand industry, expanding at a CAGR of 4.9% over the forecast period. The region's growth is underpinned by large-scale infrastructure investment in China and India, rapid urbanisation, and a booming semiconductor manufacturing sector that requires high-purity silica. North America is a well-established and value-intensive market, with the United States serving as both the largest national sand market and the world's leading exporter of silica sand. The Middle East and Africa region is gaining momentum through large infrastructure programmes, with the African Development Bank channelling billions in road and corridor development. Europe, driven by glass manufacturing and foundry applications, continues to sustain steady demand, with Germany, France, and the United Kingdom as key consuming nations.


Read more about this report - REQUEST FREE SAMPLE COPY IN PDF
By End Use
Within the global sand market's end-use segmentation, Construction and Glass Manufacturing are the two dominant segments. Construction accounts for the largest share of global sand consumption, driven by the sustained pace of residential, commercial, and infrastructure development across emerging and developed economies alike. The housing development sector contributes approximately 40% of concrete demand worldwide, creating a reliable and substantial pipeline for construction-grade sand. Glass Manufacturing holds the second-most prominent position and is growing rapidly, with glass container production rising at 1.7% annually since 2012. The semiconductor industry's escalating demand for ultra-high-purity silica sand is further elevating the Glass Manufacturing segment's strategic value. Major players such as SCR-Sibelco NV and Covia Holdings have positioned product portfolios to serve both segments simultaneously.
Read more about this report - REQUEST FREE SAMPLE COPY IN PDF
Asia Pacific is the most dynamic regional market in the global sand industry. The region accounted for a significant share of global consumption in 2025 and is projected to grow at a CAGR of 4.9% through 2035. China and India are the primary growth engines, with both countries driving massive construction pipelines under national infrastructure programmes. India's infrastructure push under its National Infrastructure Pipeline and China's ongoing urbanisation drive targeting a 70% urban population share by 2035 continue to translate into strong and sustained sand demand. Beyond construction, the region's semiconductor manufacturing surge, with Taiwan, South Korea, and Japan at the forefront, has created incremental demand for precision-grade silica sand. Companies such as JFE Mineral and Alloy and Tochu Corporation maintain a strong presence across this market, and major Western sand suppliers are also expanding their supply agreements in the region.
North America is the second major regional market and a global leader in silica sand production. The United States is both the largest national sand market and the leading exporter globally, with the Infrastructure Investment and Jobs Act allocating USD 550 billion in new federal spending that is sustaining demand for construction aggregates. Oil and gas activities across major shale basins in Texas, Wyoming, and Pennsylvania continue to generate robust frac sand demand. Filtration and water treatment are emerging as a fast-growing sub-segment in North America, driven by water recycling mandates and municipal refurbishment programmes. The region is home to some of the world's leading sand producers, including U.S. Silica Holdings, Covia Holdings, Badger Mining Corporation, and Manley Bros. of Indiana, all of which maintain large integrated extraction and logistics operations.
Read more about this report - REQUEST FREE SAMPLE COPY IN PDF
The global sand market is moderately consolidated, with a handful of large multinational producers holding significant market share alongside a broader base of regional and specialty players. Competition is driven by scale of reserves, logistical capabilities, product quality, and the ability to serve diverse end-use sectors from a single integrated platform. Major players are increasingly differentiating through high-purity product development for semiconductor and solar applications, sustainability credentials, and strategic acquisitions that expand geographic reach and product diversity.
The market has seen notable consolidation in recent years, with Apollo Global Management's takeover of U.S. Silica, Covia's acquisition of R.W. Sidley's operations, and the Covia Energy-Black Mountain Sand merger, all occurring in 2024. These moves reflect a broader industry trend toward scale, operational efficiency, and long-term supply security as demand from both traditional construction markets and technology-driven industries continues to rise.
Founded in 1900 and headquartered in Katy, Texas, U.S. Silica Holdings is one of North America's leading industrial minerals companies. Following its acquisition by Apollo Global Management in July 2024, it operates as a private entity with more than 27 production facilities across the United States. The company serves oil and gas, glass, filtration, and specialty industrial markets, offering a diversified portfolio of silica, aplite, limestone, and diatomaceous earth products backed by a robust last-mile logistics network.
Founded in 1872 and headquartered in Antwerp, Belgium, Sibelco is a global leader in industrial mineral solutions with operations spanning more than 30 countries. The company specialises in silica, clays, white silica sand, and olivine, and holds a significant presence in glass recycling. Sibelco serves customers across construction, glass, foundry, and advanced technology industries. Its February 2024 partnership with Ojing Technology for high-purity quartz supply and its strategic acquisitions in the Americas and Europe underscore its growth-focused approach.
Headquartered in Independence, Ohio, Covia Holdings was formed from the merger of Fairmount Santrol and Unimin in 2018. The company is a leading provider of mineral-based and material solutions for industrial and energy markets, offering silica sand, nepheline syenite, feldspar, and related products. In May 2024, Covia completed the acquisition of R.W. Sidley's Ohio operations, expanding its product offerings in filtration, sports surfaces, and construction. Its broad distribution network and customer-centric approach across North America position it as a formidable competitor.
Founded in July 2004 and headquartered in Tokyo, Japan, JFE Mineral and Alloy Company is a leading producer of high-quality silica sand and related minerals across the Asia Pacific region. The company focuses on precision mineral products for glass manufacturing, construction, and industrial applications. As part of the JFE Steel group's broader materials ecosystem, it benefits from integrated supply chains and technical expertise, enabling it to serve demanding customers in the region's growing semiconductor, glass, and specialty industrial sectors.
Other key players in the market are Quarzwerke GmbH, P U M Group, Badger Mining Corporation, Manley Bros. of Indiana, Inc., Euroquarz GmbH, Tochu Corporation, and Others.
*Please note that this is only a partial list; the complete list of key players is available in the full report. Additionally, the list of key players can be customized to better suit your needs.*
Explore the latest intelligence on the Global Sand Market 2026 through our detailed industry report. Access current data on demand trends, end-use segment performance, and regional growth dynamics shaping the market from 2026-2035. Whether you are assessing new markets, evaluating supply chain strategies, or tracking competitor activities, this report provides the clarity and depth you need. Download your free sample today and uncover the key opportunities across the thriving sand industry.
Upto 15% Off
USD
$2499 $2249
$3999 $3599
$4999 $4249
$5999 $5099


*While we strive to always give you current and accurate information, the numbers depicted on the website are indicative and may differ from the actual numbers in the main report. At Expert Market Research, we aim to bring you the latest insights and trends in the market. Using our analyses and forecasts, stakeholders can understand the market dynamics, navigate challenges, and capitalize on opportunities to make data-driven strategic decisions.*
In 2025, the sand market reached an approximate value of USD 172.88 Billion.
The market is projected to grow at a CAGR of 4.30% between 2026 and 2035.
The market is estimated to witness healthy growth in the forecast period of 2026-2035 to reach a value of around USD 263.38 Billion by 2035.
North America, Europe, Asia Pacific, Latin America, and the Middle East and Africa are the major regions covered in the Global Sand Market report.
The major market trends are technological advancements, rising semiconductor production in Taiwan, and increasing industrial demand for sand.
The different end uses of sand are construction, glass manufacturing, filtration, foundry, chemical production, paints and coatings, ceramics and refractories, and oil and gas, among others.
The leading producers of sand worldwide are the United States, the Netherlands, and Germany.
Key players in the market are U.S. Silica Holdings, Inc., SCR-Sibelco NV, Covia Holdings LLC, JFE Mineral & Alloy Company,Ltd., Quarzwerke GmbH, P U M Group, Badger Mining Corporation, Manley Bros. of Indiana, Inc., Euroquarz GmbH, and Tochu Corporation, among others.
Explore our key highlights of the report and gain a concise overview of key findings, trends, and actionable insights that will empower your strategic decisions.
| REPORT FEATURES | DETAILS |
| Base Year | 2025 |
| Historical Period | 2019-2025 |
| Forecast Period | 2026-2035 |
| Scope of the Report |
Historical and Forecast Trends, Industry Drivers and Constraints, Historical and Forecast Market Analysis by Segment:
|
| Breakup by End Use |
|
| Breakup by Region |
|
| Market Dynamics |
|
| Competitive Landscape |
|
| Companies Covered |
|
Datasheet
One User
USD 2,499
USD 2,249
tax inclusive*
Single User License
One User
USD 3,999
USD 3,599
tax inclusive*
Five User License
Five User
USD 4,999
USD 4,249
tax inclusive*
Corporate License
Unlimited Users
USD 5,999
USD 5,099
tax inclusive*
*Please note that the prices mentioned below are starting prices for each bundle type. Kindly contact our team for further details.*
Flash Bundle
Small Business Bundle
Growth Bundle
Enterprise Bundle
*Please note that the prices mentioned below are starting prices for each bundle type. Kindly contact our team for further details.*
Flash Bundle
Number of Reports: 3
20%
tax inclusive*
Small Business Bundle
Number of Reports: 5
25%
tax inclusive*
Growth Bundle
Number of Reports: 8
30%
tax inclusive*
Enterprise Bundle
Number of Reports: 10
35%
tax inclusive*
How To Order

Select License Type
Choose the right license for your needs and access rights.

Click on ‘Buy Now’
Add the report to your cart with one click and proceed to register.

Select Mode of Payment
Choose a payment option for a secure checkout. You will be redirected accordingly.
Strategic Solutions for Informed Decision-Making
Gain insights to stay ahead and seize opportunities.

Get insights & trends for a competitive edge.

Track prices with detailed trend reports.

Analyse trade data for supply chain insights.

Leverage cost reports for smart savings

Enhance supply chain with partnerships.

Connect For More Information
Our expert team of analysts will offer full support and resolve any queries regarding the report, before and after the purchase.
Our expert team of analysts will offer full support and resolve any queries regarding the report, before and after the purchase.
We employ meticulous research methods, blending advanced analytics and expert insights to deliver accurate, actionable industry intelligence, staying ahead of competitors.
Our skilled analysts offer unparalleled competitive advantage with detailed insights on current and emerging markets, ensuring your strategic edge.
We offer an in-depth yet simplified presentation of industry insights and analysis to meet your specific requirements effectively.


