

Consumer Insights
Uncover trends and behaviors shaping consumer choices today
Procurement Insights
Optimize your sourcing strategy with key market data
Industry Stats
Stay ahead with the latest trends and market analysis.
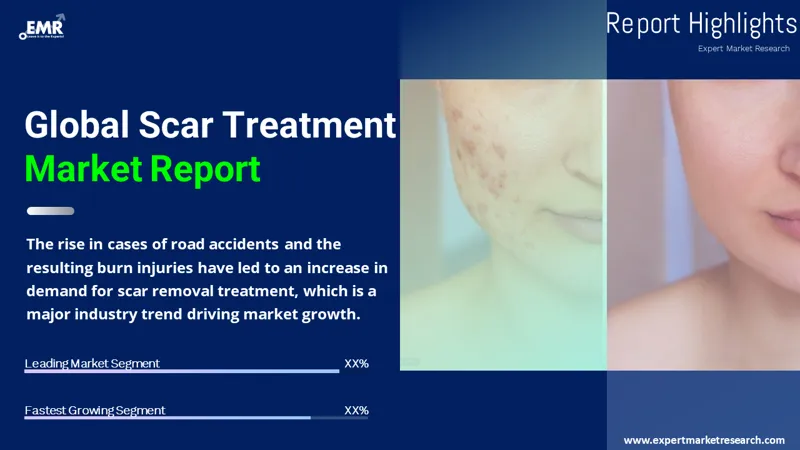
The scar treatment market size was valued at USD 25.04 Billion in 2025, driven by the rising prevalence of demand for cosmetic procedures across the 8 major markets. The market is expected to grow at a CAGR of 11.00% during the forecast period of 2026-2035, to reach USD 71.10 Billion by 2035.
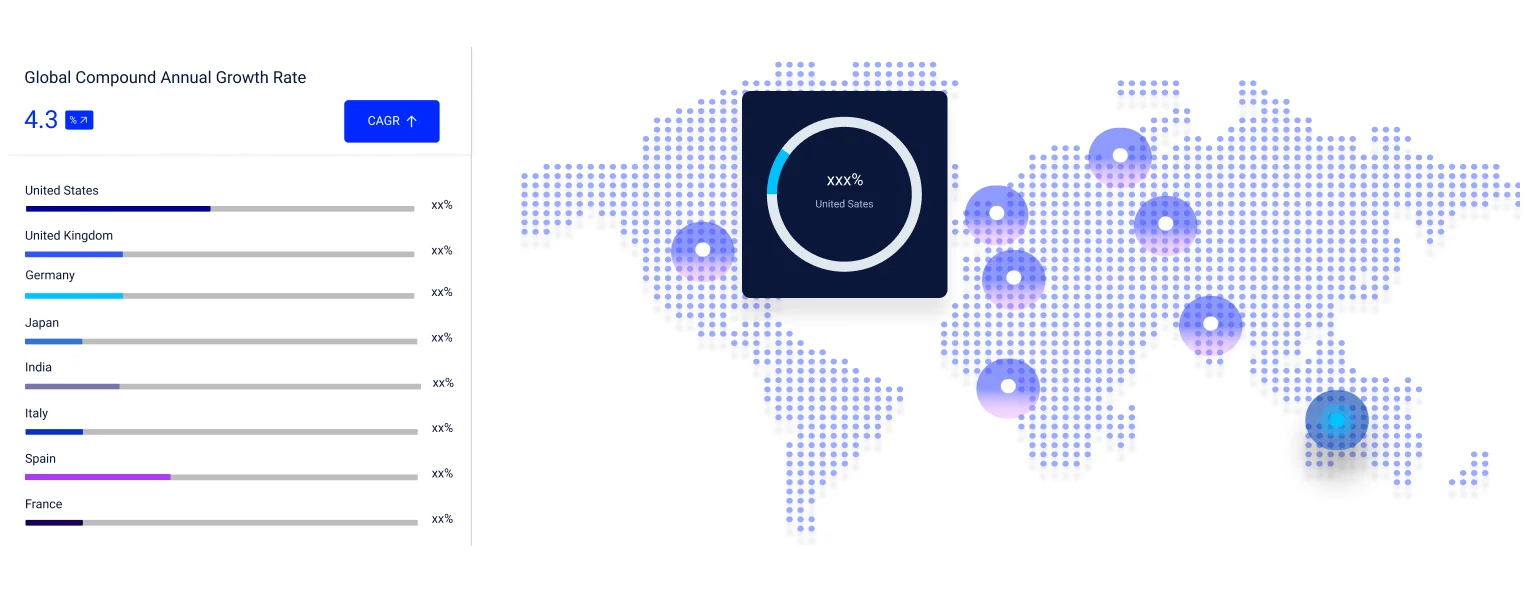
Compound Annual Growth Rate
11%
Value in USD Billion
2026-2035
Scar treatment includes a range of techniques and products used to reduce, mask, or completely remove scars on the skin. Scars may be caused by injuries, surgeries, burns, acne, and other skin disorders. It develops as a result of the body's natural healing process. Topical creams, gels, silicone sheets, laser therapy, surgery, and injections are amongst the common treatments for treating scars.
The scar treatment market growth is driven by individuals becoming more self-conscious about their appearance. This has resulted in increased scar removal and reduction treatments. Consequently, resulting in increased incidence in approvals from regulatory authorities. For instance, in August 2023, FDA approved Sofwave Medical Ltd.'s Precise SUPERB Applicator to treat acne scars, expanding its list of approved uses beyond cellulite. After three sessions, a multicenter clinical research spread across multiple US locations showed a notable improvement in the appearance of acne scars. Most patients expressed relief and great pleasure with their outcomes. There were no significant adverse events in the research, which showed a positive safety profile.
Read more about this report - REQUEST FREE SAMPLE COPY IN PDF
To meet the rising scar treatment market demand, mergers and collaborations are witnessing a significant surge. In June 2023, International Medical Lasers (IML) partnered with DEKA Trio to offer laser accessories, including a scanner for CO2 laser-assisted scar reconstruction. The terms of agreement also focused on an FDA approved novel scanner for surgical scar correction By collaborating with global medical providers and manufacturers, new-age and technology driven companies are bringing cutting-edge medical technology to the markets, further driving its growth.
The scar treatment market share for products and services continues to expand, driven by rising application in the realm of medical aesthetics for non-surgical alternatives. People are looking for less intrusive ways to repair scars and rejuvenate their skin instead of undergoing typical surgical procedures. As laser-based procedures for skin rejuvenation and scar correction become more common, there is an increasing demand for cutting-edge instruments and technology that can produce good outcomes with little risk or downtime.
| Key Trend | Impact |
| Increased Application of Advanced Technologies | Regarding its precision and effectiveness, technologies such as radiofrequency devices, laser therapy, and microneedling are becoming more and more popular. These techniques provide accurate scar tissue targeting and productive outcomes, thereby, contributing to elevated scar treatment market growth. |
| Preference for Non-Surgical Solutions | The growing inclination towards minimally invasive procedures that have lower risks and downtime has led to an increase in demand for non-surgical scar treatment solutions. These therapies, such as microneedling and laser therapy, are appealing to people looking for non-surgical scar control that works well. They provide more accessibility to a broader spectrum of patients, reduced recovery periods, and fewer side effects. These therapies are made easier by advanced technologies, which also minimize invasiveness while producing effective results. |
| Rising Demand for Cosmetic Procedures | The scar therapy treatment market size is expanding due to rising demand for cosmetic procedures brought on by social and cultural reasons. People are seeking scar treatments to improve their appearance and increase their self-esteem. This tendency is indicative of a larger cultural focus on self-improvement and aesthetics. |
| Customized Treatment Plans | Healthcare professionals are adopting customized scar treatment regimens that consider requirements of each patient and take several elements including skin type, location, size, and scar type into account. This tailored method guarantees that treatment plans are formulated to maximize efficacy and patient satisfaction, indicating a change in scar management toward more patient-centred care. |
Read more about this report - REQUEST FREE SAMPLE COPY IN PDF
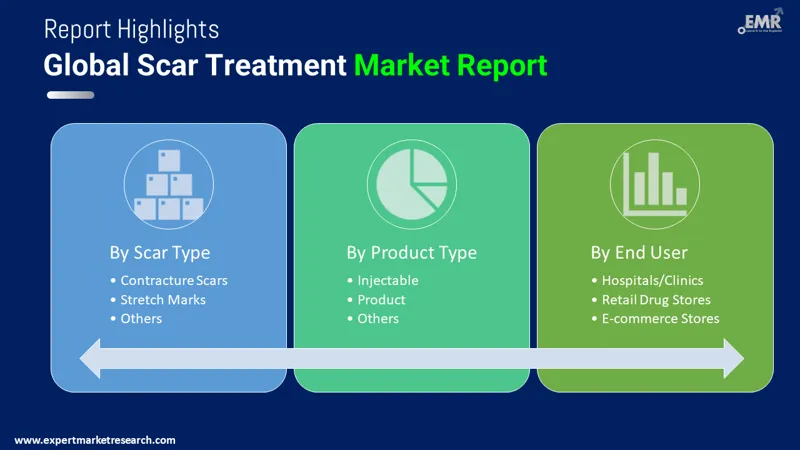
Market Breakup by Scar Type
The market segmentation by treatment type includes atrophic scars, hypertrophic and keloid scars, contracture scars, and stretch marks. This market segment illustrates the different types of treatment types.
Market Breakup by Product
Based on products, the scar treatment market is segmented into topical products, laser products, injectables, and others. Topical products include creams, gels, silicone sheets, and other formulations. Laser products comprise CO2 lasers, pulse-dyed lasers, and other laser devices. Injectable treatments are also offered for scar management. These segments reflect the diverse range of scar treatment options available, catering to varying patient needs and preferences. From non-invasive topical solutions to advanced laser therapies and injectable treatments, the market offers a comprehensive array of products aimed at reducing the appearance of scars and improving skin texture, ensuring a tailored approach to scar management.
Market Breakup by End User
End-users of scar treatment include hospitals, and ambulatory surgical centers, among others. These healthcare facilities provide access to treatment to diverse patient populations and clinical needs.
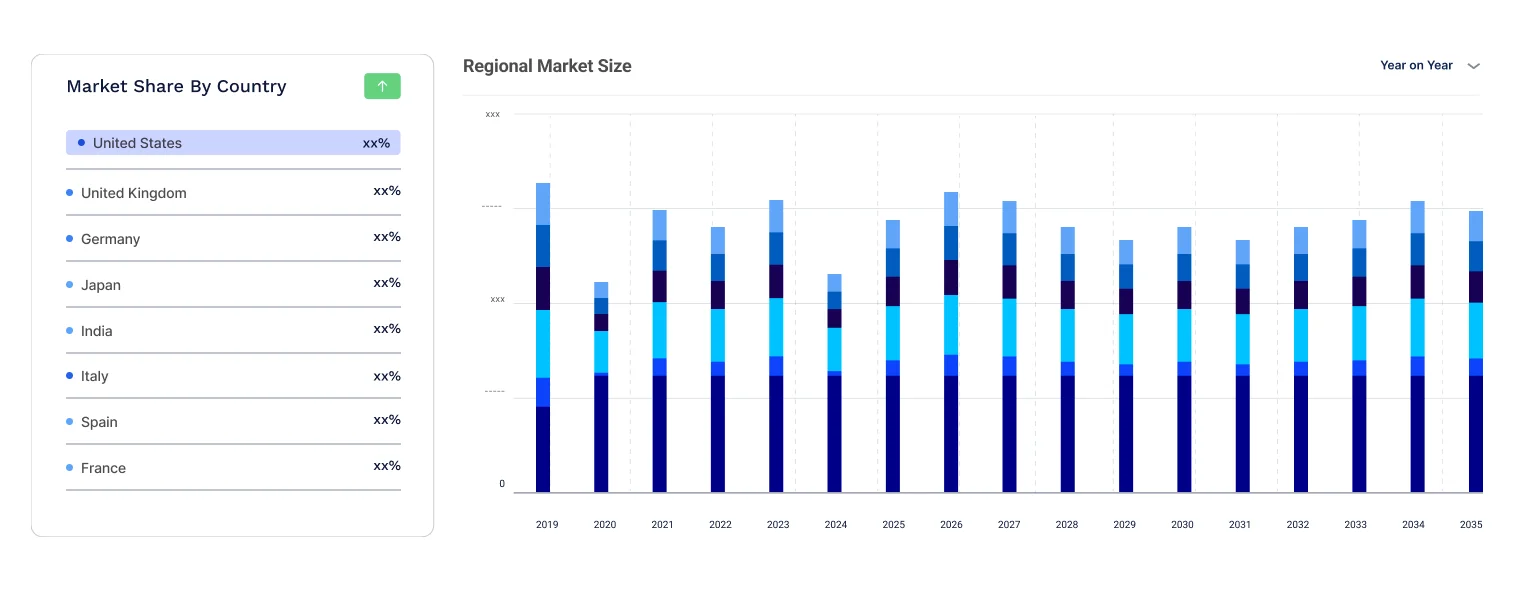
Market Breakup by Region
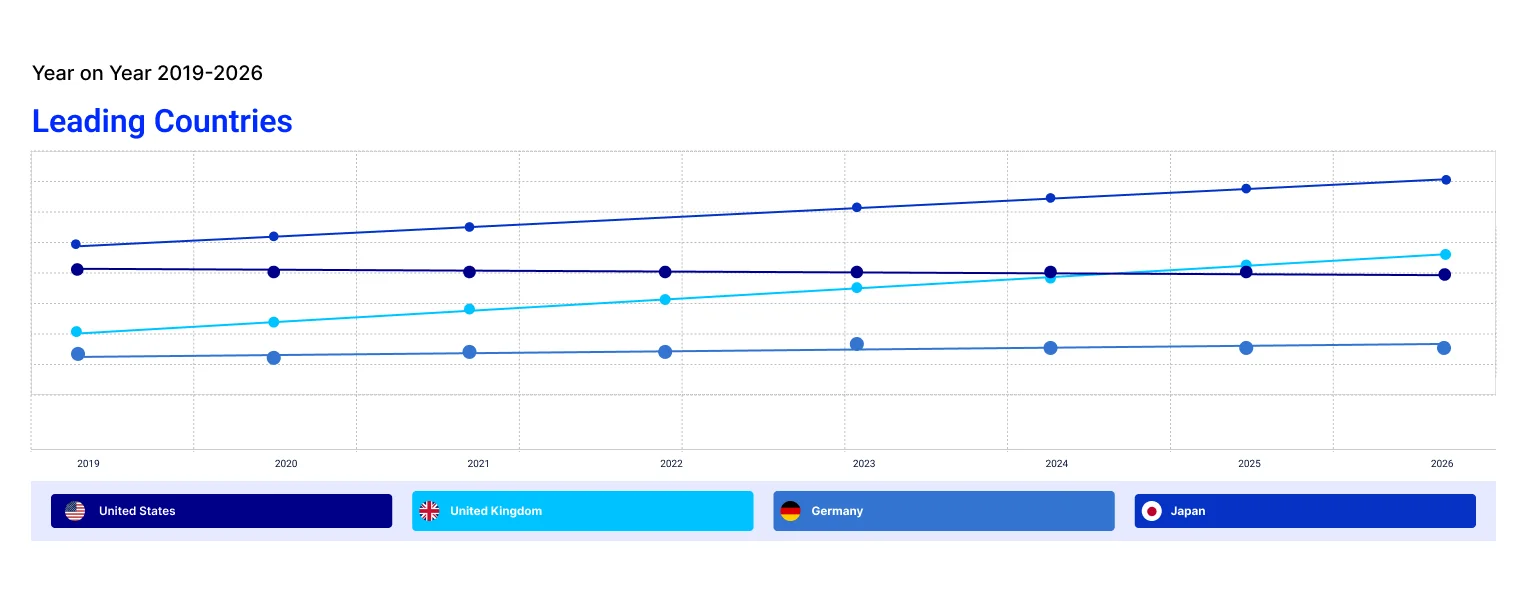
Based on regions, the market is divided into United States, EU-4 (Germany, France, Italy, and Spain) and the United Kingdom, along with Japan, and India. These areas reflect diverse healthcare environments and consumer preferences across various geographic areas. United States with a robust healthcare infrastructure is expected to lead the market share in the forecast period, while India and Japan are likely to witness expedited market growth.
The key features of the market report include patent analysis, grants analysis, clinical trials analysis, funding and investment analysis, partnerships, and collaborations analysis by the leading key players. The major companies in the market are as follows:
Kindly note that this only represents a partial list of companies, and the complete list has been provided in the report.
Upto 15% Off
USD
$3299 $2969
$5499 $4949
$6999 $5949
$8199 $6969


*While we strive to always give you current and accurate information, the numbers depicted on the website are indicative and may differ from the actual numbers in the main report. At Expert Market Research, we aim to bring you the latest insights and trends in the market. Using our analyses and forecasts, stakeholders can understand the market dynamics, navigate challenges, and capitalize on opportunities to make data-driven strategic decisions.*
The market attained a value of about USD 25.04 Billion in 2025 driven by the rising prevalence of demand for cosmetic procedures across the 8 major markets.
The market is anticipated to grow at a CAGR of 11.00% during the forecast period of 2026-2035, likely to reach a market value of USD 71.10 Billion by 2035.
Growing demands for personalized treatment plans as well as rising disposable incomes are fuelling the demand for the market.
The growing preference for non-surgical scar treatment options is one significant market trends. Methods that reduce scars precisely and effectively, such microneedling and laser therapy, are gaining wide popularity amongst the consumers.
It includes atrophic scars, hypertrophic and keloid scars, contracture scars and stretch marks.
Based on product type, the market for scar treatment includes topical products, laser products, and injectables among others. Topical products include silicone sheets, gels, lotions, and other compositions.CO2 lasers, pulse-dyed lasers, and other laser devices are typical laser products.
End-users of scar treatment include hospitals, and ambulatory surgical centers, among others.
The major regions of the market include the United States, EU-4 (Germany, France, Italy, and Spain), the United Kingdom, Japan, and India.
Key players involved in the market are Alliance Pharma PLC, Perrigo Company plc, Newmedical Technology Inc., Sonoma Pharmaceuticals, Inc., HRA Pharma, Boston Scientific Corporation, CCA Industries, Inc., Avita Medical, Inc., Smith & Nephew PLC, Shanghai Fosun Pharmaceutical (Group) Co., Ltd., Sientra, Inc., Molnlycke Health Care AB, Merz Pharma, POLYTECH Health & Aesthetics GmbH and CYNOSURE LUTRONIC
Explore our key highlights of the report and gain a concise overview of key findings, trends, and actionable insights that will empower your strategic decisions.
| REPORT FEATURES | DETAILS |
| Base Year | 2025 |
| Historical Period | 2019-2025 |
| Forecast Period | 2026-2035 |
| Scope of the Report |
Historical and Forecast Trends, Industry Drivers and Constraints, Historical and Forecast Market Analysis by Segment:
|
| Breakup by Scar Type |
|
| Breakup by Product |
|
| Breakup by End User |
|
| Breakup by Region |
|
| Market Dynamics |
|
| Supplier Landscape |
|
| Companies Covered |
|
Datasheet
One User
USD 3,299
USD 2,969
tax inclusive*
Single User License
One User
USD 5,499
USD 4,949
tax inclusive*
Five User License
Five User
USD 6,999
USD 5,949
tax inclusive*
Corporate License
Unlimited Users
USD 8,199
USD 6,969
tax inclusive*
*Please note that the prices mentioned below are starting prices for each bundle type. Kindly contact our team for further details.*
Flash Bundle
Small Business Bundle
Growth Bundle
Enterprise Bundle
*Please note that the prices mentioned below are starting prices for each bundle type. Kindly contact our team for further details.*
Flash Bundle
Number of Reports: 3
20%
tax inclusive*
Small Business Bundle
Number of Reports: 5
25%
tax inclusive*
Growth Bundle
Number of Reports: 8
30%
tax inclusive*
Enterprise Bundle
Number of Reports: 10
35%
tax inclusive*
How To Order

Select License Type
Choose the right license for your needs and access rights.

Click on ‘Buy Now’
Add the report to your cart with one click and proceed to register.

Select Mode of Payment
Choose a payment option for a secure checkout. You will be redirected accordingly.
Strategic Solutions for Informed Decision-Making
Gain insights to stay ahead and seize opportunities.

Get insights & trends for a competitive edge.

Track prices with detailed trend reports.

Analyse trade data for supply chain insights.

Leverage cost reports for smart savings

Enhance supply chain with partnerships.

Connect For More Information
Our expert team of analysts will offer full support and resolve any queries regarding the report, before and after the purchase.
Our expert team of analysts will offer full support and resolve any queries regarding the report, before and after the purchase.
We employ meticulous research methods, blending advanced analytics and expert insights to deliver accurate, actionable industry intelligence, staying ahead of competitors.
Our skilled analysts offer unparalleled competitive advantage with detailed insights on current and emerging markets, ensuring your strategic edge.
We offer an in-depth yet simplified presentation of industry insights and analysis to meet your specific requirements effectively.


