

Consumer Insights
Uncover trends and behaviors shaping consumer choices today
Procurement Insights
Optimize your sourcing strategy with key market data
Industry Stats
Stay ahead with the latest trends and market analysis.
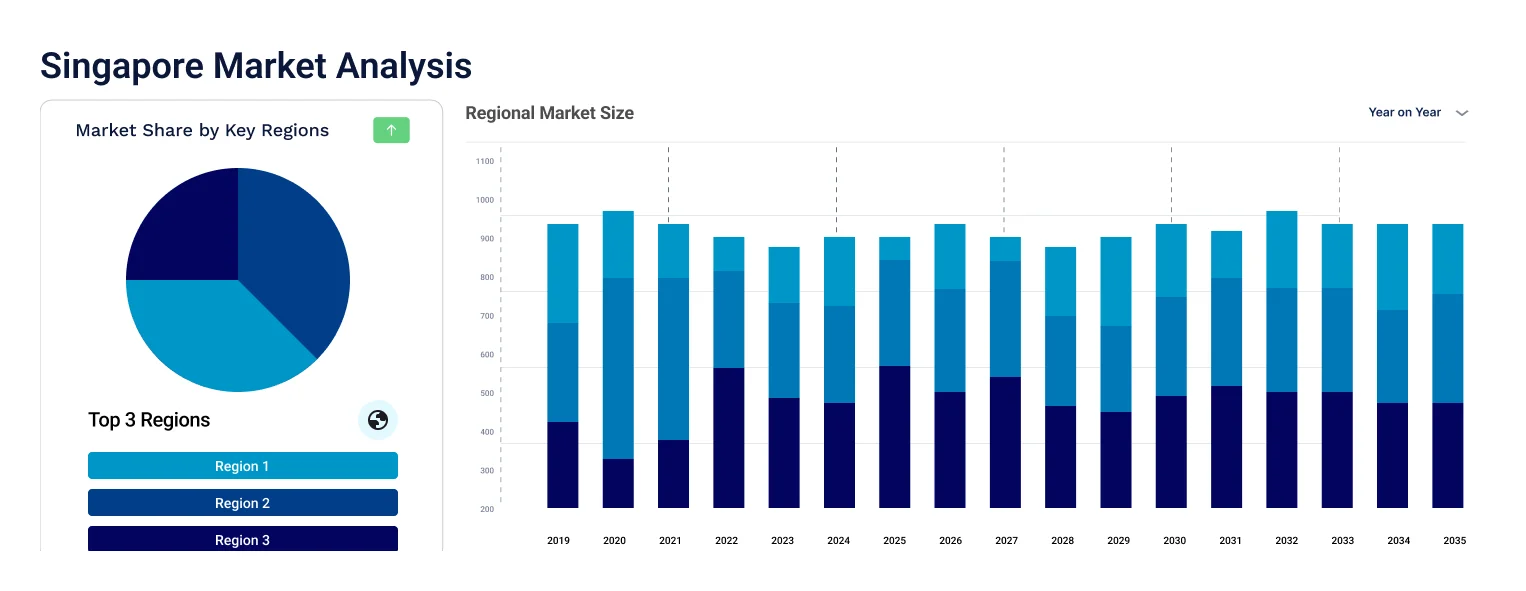
The Singapore socks market was valued at USD 12.86 Million in 2025. The industry is expected to grow at a CAGR of 6.10% during the forecast period of 2026-2035 to attain a valuation of USD 23.25 Million by 2035.
In 2022, consumer spending in Singapore reached $139.34 billion, marking an 11.53% rise compared to the previous year.
The National Sports Participation Survey revealed that 74% of the 4,500 respondents aged 13 and above engaged in sports activities at least once a week.
The total number of e-commerce users in Singapore in 2022 amounted to 3.51 million.
Compound Annual Growth Rate
6.1%
Value in USD Million
2026-2035
| Singapore Socks Market Report Summary | Description | Value |
| Base Year | USD Million | 2025 |
| Historical Period | USD Million | 2019-2025 |
| Forecast Period | USD Million | 2026-2035 |
| Market Size 2025 | USD Million | 12.86 |
| Market Size 2035 | USD Million | 23.25 |
| CAGR 2019-2025 | Percentage | XX% |
| CAGR 2026-2035 | Percentage | 6.10% |
| CAGR 2026-2035 - Market by Product Type | Athletic Socks | 7.0% |
| CAGR 2026-2035 - Market by Distribution Channel | Online Channels | 11.0% |
| 2025 Market Share by Distribution Channel | Online Channels | 12.1% |
The increase in sock purchases in Singapore can be attributed to the rising focus on physical health and wellness among the population. As per the 2022 National Sport Participation Survey, 73% of teenagers between 13 and 19 years old stated that they engage in sports and physical activities, primarily for the sake of their physical well-being. A data spanning from 2020 to 2022 from the same survey indicated a rise in the number of young individuals participating in activities like weightlifting, circuit training, and calisthenics. A larger portion of the population is now actively involved in various physical pursuits, such as running, gym sessions, yoga, and team sports. Consequently, there has been an increased demand for performance socks that provide comfort, support, and longevity.
The increase in online shopping has had a significant impact on the demand for socks. Online stores are available 24/7, making it convenient for consumers to buy socks whenever they need them. The convenience of having socks delivered directly to one's door eliminates the need to visit physical stores, leading to more frequent purchases. In 2022, the gross merchandise volume of the Singaporean eCommerce market reached US$8.2 billion, with projections indicating a rise to US$11 billion by 2025. Major eCommerce product categories include fashion, food, cosmetics and personal care, and toys. E-commerce platforms offer a wide variety of sock styles, colours, materials, and brands, often more extensive than physical stores. Consumers can easily find specialised socks, such as athletic, compression, or eco-friendly options, on online channels to meet their specific needs and preferences.
“Singapore Socks Market Report and Forecast 2026-2035” offers a detailed analysis of the market based on the following segments:
Market Breakup by Product Type
Market Breakup by Material Type
Market Breakup by Demographics
Market Breakup by Distribution Channel
| CAGR 2026-2035 - Market by | Product Type |
| Athletic Socks | 7.0% |
| Casual Socks | 6.5% |
| Formal Socks | XX% |
| Specialty Socks | XX% |
| Others | XX% |
| CAGR 2026-2035 - Market by | Distribution Channel |
| Online Channels | 11.0% |
| Hypermarkets/Supermarkets | 6.5% |
| Convenience Stores | XX% |
| Others | XX% |
Based on the distribution channel, the market is segmented into hypermarkets/supermarkets, convenience stores, and online channels, among others. Online channels are projected to grow at a CAGR of 11.0% during the forecast period of 2026-2035.The ease of online shopping allows consumers to discover and purchase a diverse range of sock options from the comfort of their own homes.
| 2025 Market Share by | Distribution Channel |
| Hypermarkets/Supermarkets | XX% |
| Convenience Stores | XX% |
| Online Channels | 12.1% |
| Others | XX% |
Major players are focusing on product innovation and ethical production practices to gain a competitive edge in the market.
Upto 15% Off
USD
$2499 $2249
$3999 $3599
$4999 $4249
$5999 $5099


*While we strive to always give you current and accurate information, the numbers depicted on the website are indicative and may differ from the actual numbers in the main report. At Expert Market Research, we aim to bring you the latest insights and trends in the market. Using our analyses and forecasts, stakeholders can understand the market dynamics, navigate challenges, and capitalize on opportunities to make data-driven strategic decisions.*
The market is estimated to grow at a CAGR of 6.10% between 2026 and 2035.
The market is being driven by rising disposable incomes, increasing spending on consumer goods, and rising health and fitness activities.
The key trends aiding the market expansion include the growth of online sales channels, increasing social media marketing, and rising recreational and outdoor activities.
The different distribution channels of socks include hypermarkets/supermarkets, convenience stores, and online channels, among others.
The major players in the market are Nike, Inc., Adidas AG, Puma SE, New Balance Athletics, Inc., YONEX Co., Ltd., Li-Ning Studio LLP, and Under Armour, Inc., among others.
In 2025, the market attained a value of nearly USD 12.86 Million.
The market is estimated to witness a healthy growth in the forecast period of 2026-2035 to reach about USD 23.25 Million by 2035.
Explore our key highlights of the report and gain a concise overview of key findings, trends, and actionable insights that will empower your strategic decisions.
| REPORT FEATURES | DETAILS |
| Base Year | 2025 |
| Historical Period | 2019-2025 |
| Forecast Period | 2026-2035 |
| Scope of the Report |
Historical and Forecast Trends, Industry Drivers and Constraints, Historical and Forecast Market Analysis by Segment:
|
| Breakup by Product Type |
|
| Breakup by Material Type |
|
| Breakup by Demographics |
|
| Breakup by Distribution Channel |
|
| Market Dynamics |
|
| Competitive Landscape |
|
| Companies Covered |
|
Datasheet
One User
USD 2,499
USD 2,249
tax inclusive*
Single User License
One User
USD 3,999
USD 3,599
tax inclusive*
Five User License
Five User
USD 4,999
USD 4,249
tax inclusive*
Corporate License
Unlimited Users
USD 5,999
USD 5,099
tax inclusive*
*Please note that the prices mentioned below are starting prices for each bundle type. Kindly contact our team for further details.*
Flash Bundle
Small Business Bundle
Growth Bundle
Enterprise Bundle
*Please note that the prices mentioned below are starting prices for each bundle type. Kindly contact our team for further details.*
Flash Bundle
Number of Reports: 3
20%
tax inclusive*
Small Business Bundle
Number of Reports: 5
25%
tax inclusive*
Growth Bundle
Number of Reports: 8
30%
tax inclusive*
Enterprise Bundle
Number of Reports: 10
35%
tax inclusive*
How To Order

Select License Type
Choose the right license for your needs and access rights.

Click on ‘Buy Now’
Add the report to your cart with one click and proceed to register.

Select Mode of Payment
Choose a payment option for a secure checkout. You will be redirected accordingly.
Strategic Solutions for Informed Decision-Making
Gain insights to stay ahead and seize opportunities.

Get insights & trends for a competitive edge.

Track prices with detailed trend reports.

Analyse trade data for supply chain insights.

Leverage cost reports for smart savings

Enhance supply chain with partnerships.

Connect For More Information
Our expert team of analysts will offer full support and resolve any queries regarding the report, before and after the purchase.
Our expert team of analysts will offer full support and resolve any queries regarding the report, before and after the purchase.
We employ meticulous research methods, blending advanced analytics and expert insights to deliver accurate, actionable industry intelligence, staying ahead of competitors.
Our skilled analysts offer unparalleled competitive advantage with detailed insights on current and emerging markets, ensuring your strategic edge.
We offer an in-depth yet simplified presentation of industry insights and analysis to meet your specific requirements effectively.


