

Consumer Insights
Uncover trends and behaviors shaping consumer choices today
Procurement Insights
Optimize your sourcing strategy with key market data
Industry Stats
Stay ahead with the latest trends and market analysis.
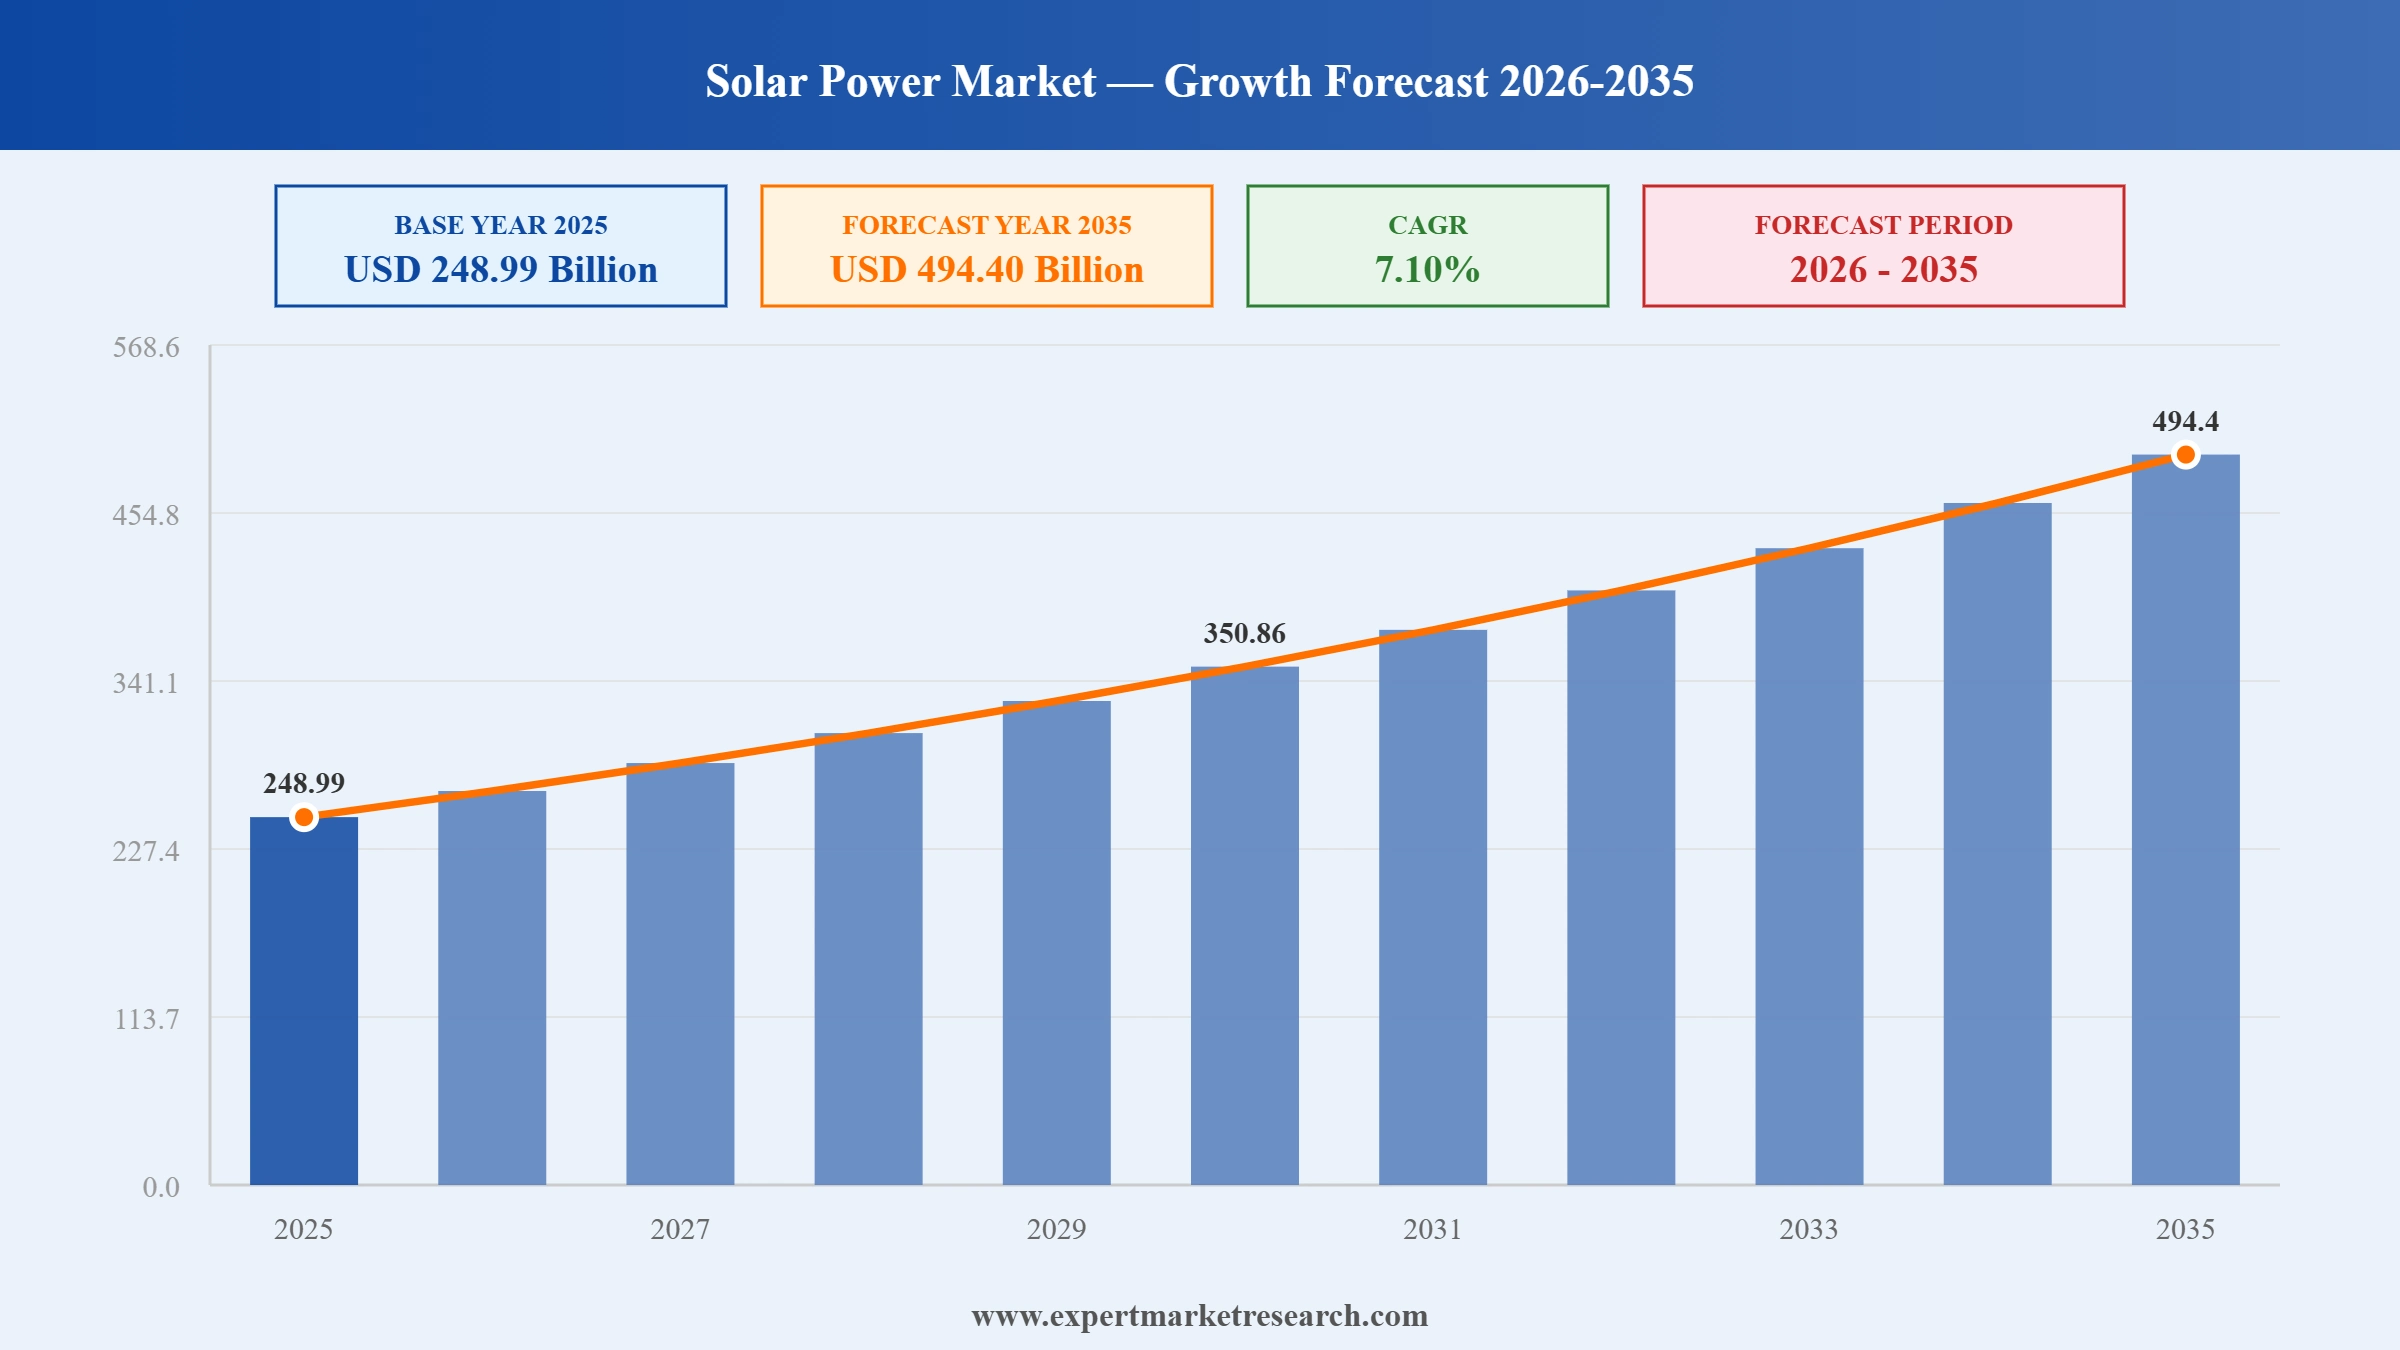
The global solar power market reached a value of USD 248.99 Billion at 2025 and is projected to expand at a CAGR of around 7.10% during the forecast period of 2026-2035. With surging global demand for renewable energy accelerating solar PV installations at record pace, falling solar module costs improving energy economics for residential and utility customers, growing government and corporate clean energy commitments driving large-scale solar procurement, and expanding solar manufacturing capacity in India, the US, and Southeast Asia supporting global supply, the global solar power market is expected to reach USD 494.40 Billion by 2035.
Read more about this report - REQUEST FREE SAMPLE COPY IN PDF
The global solar power market is being reshaped by major manufacturing investments, landmark utility-scale project groundbreakings, and rapid capacity milestones across key markets. Leading Indian manufacturers are scaling aggressively to serve domestic and international demand, while Middle Eastern developers are commissioning the world's largest solar plus storage projects, together signalling the market's transition toward mainstream energy infrastructure.
Tata Power Renewable Energy received board approval in April 2026 for a INR 6,500 crore investment in a 10 GW solar PV ingot and wafer manufacturing facility, targeting backward integration into upstream solar manufacturing and reducing India's import dependence.
Waaree Energies' subsidiary Sangam Solar One commenced operations at a 1,500 MW solar module manufacturing facility in Samakhiali, Kutch, Gujarat in December 2025, expanding India's domestic solar manufacturing capacity and supporting the global solar power market supply chain.
Masdar and Emirates Water and Electricity Company broke ground on a 5.2 GWdc solar PV project paired with 19 GWh of battery storage in Abu Dhabi in October 2025, targeting continuous 1 GW baseload renewable power delivery around the clock.
Waaree Solar Americas, the US subsidiary of Waaree Energies, secured a 452 MW solar module supply order from a leading American utility-scale solar developer in August 2025, with delivery scheduled across FY2026-27 for the North American solar market.
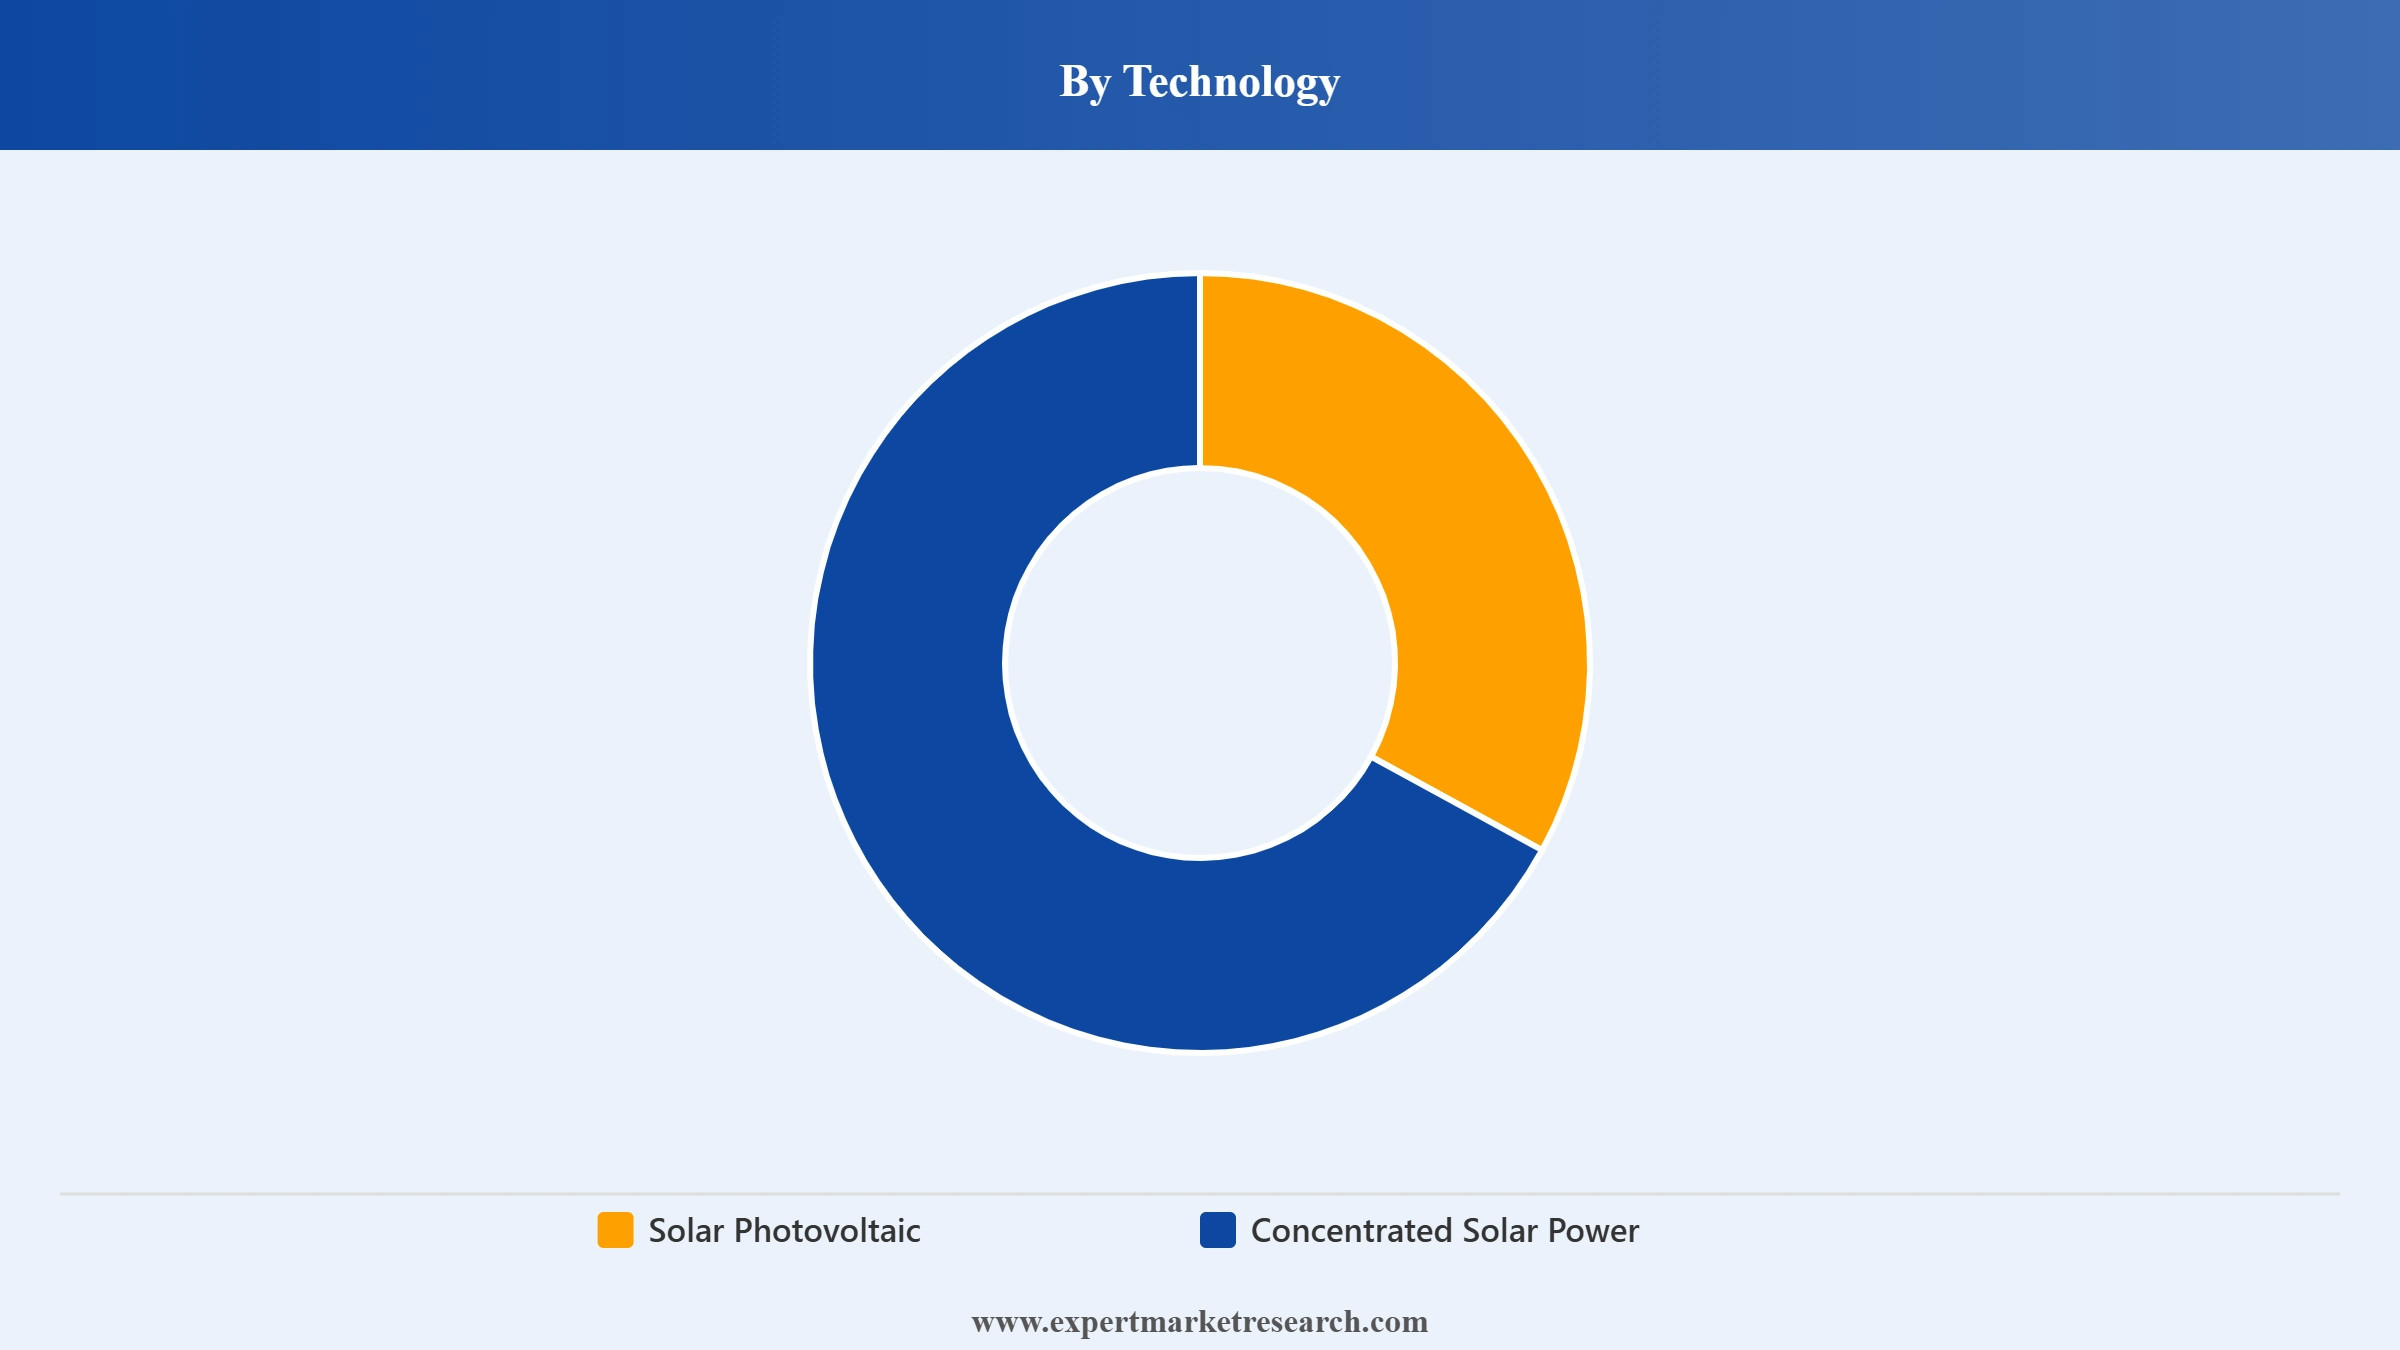
Solar photovoltaic is the dominant technology in the global solar power market, representing over 97% of all new solar capacity installed globally in 2025 per IRENA. Continuously declining module costs are driving adoption at residential, commercial, and utility-scale levels worldwide.
Utility solar drives the largest share of demand in the global solar power market. Masdar and EWEC's October 2025 groundbreaking on a 5.2 GWdc solar plus 19 GWh battery storage facility in Abu Dhabi exemplifies growing utility-scale solar investment worldwide.
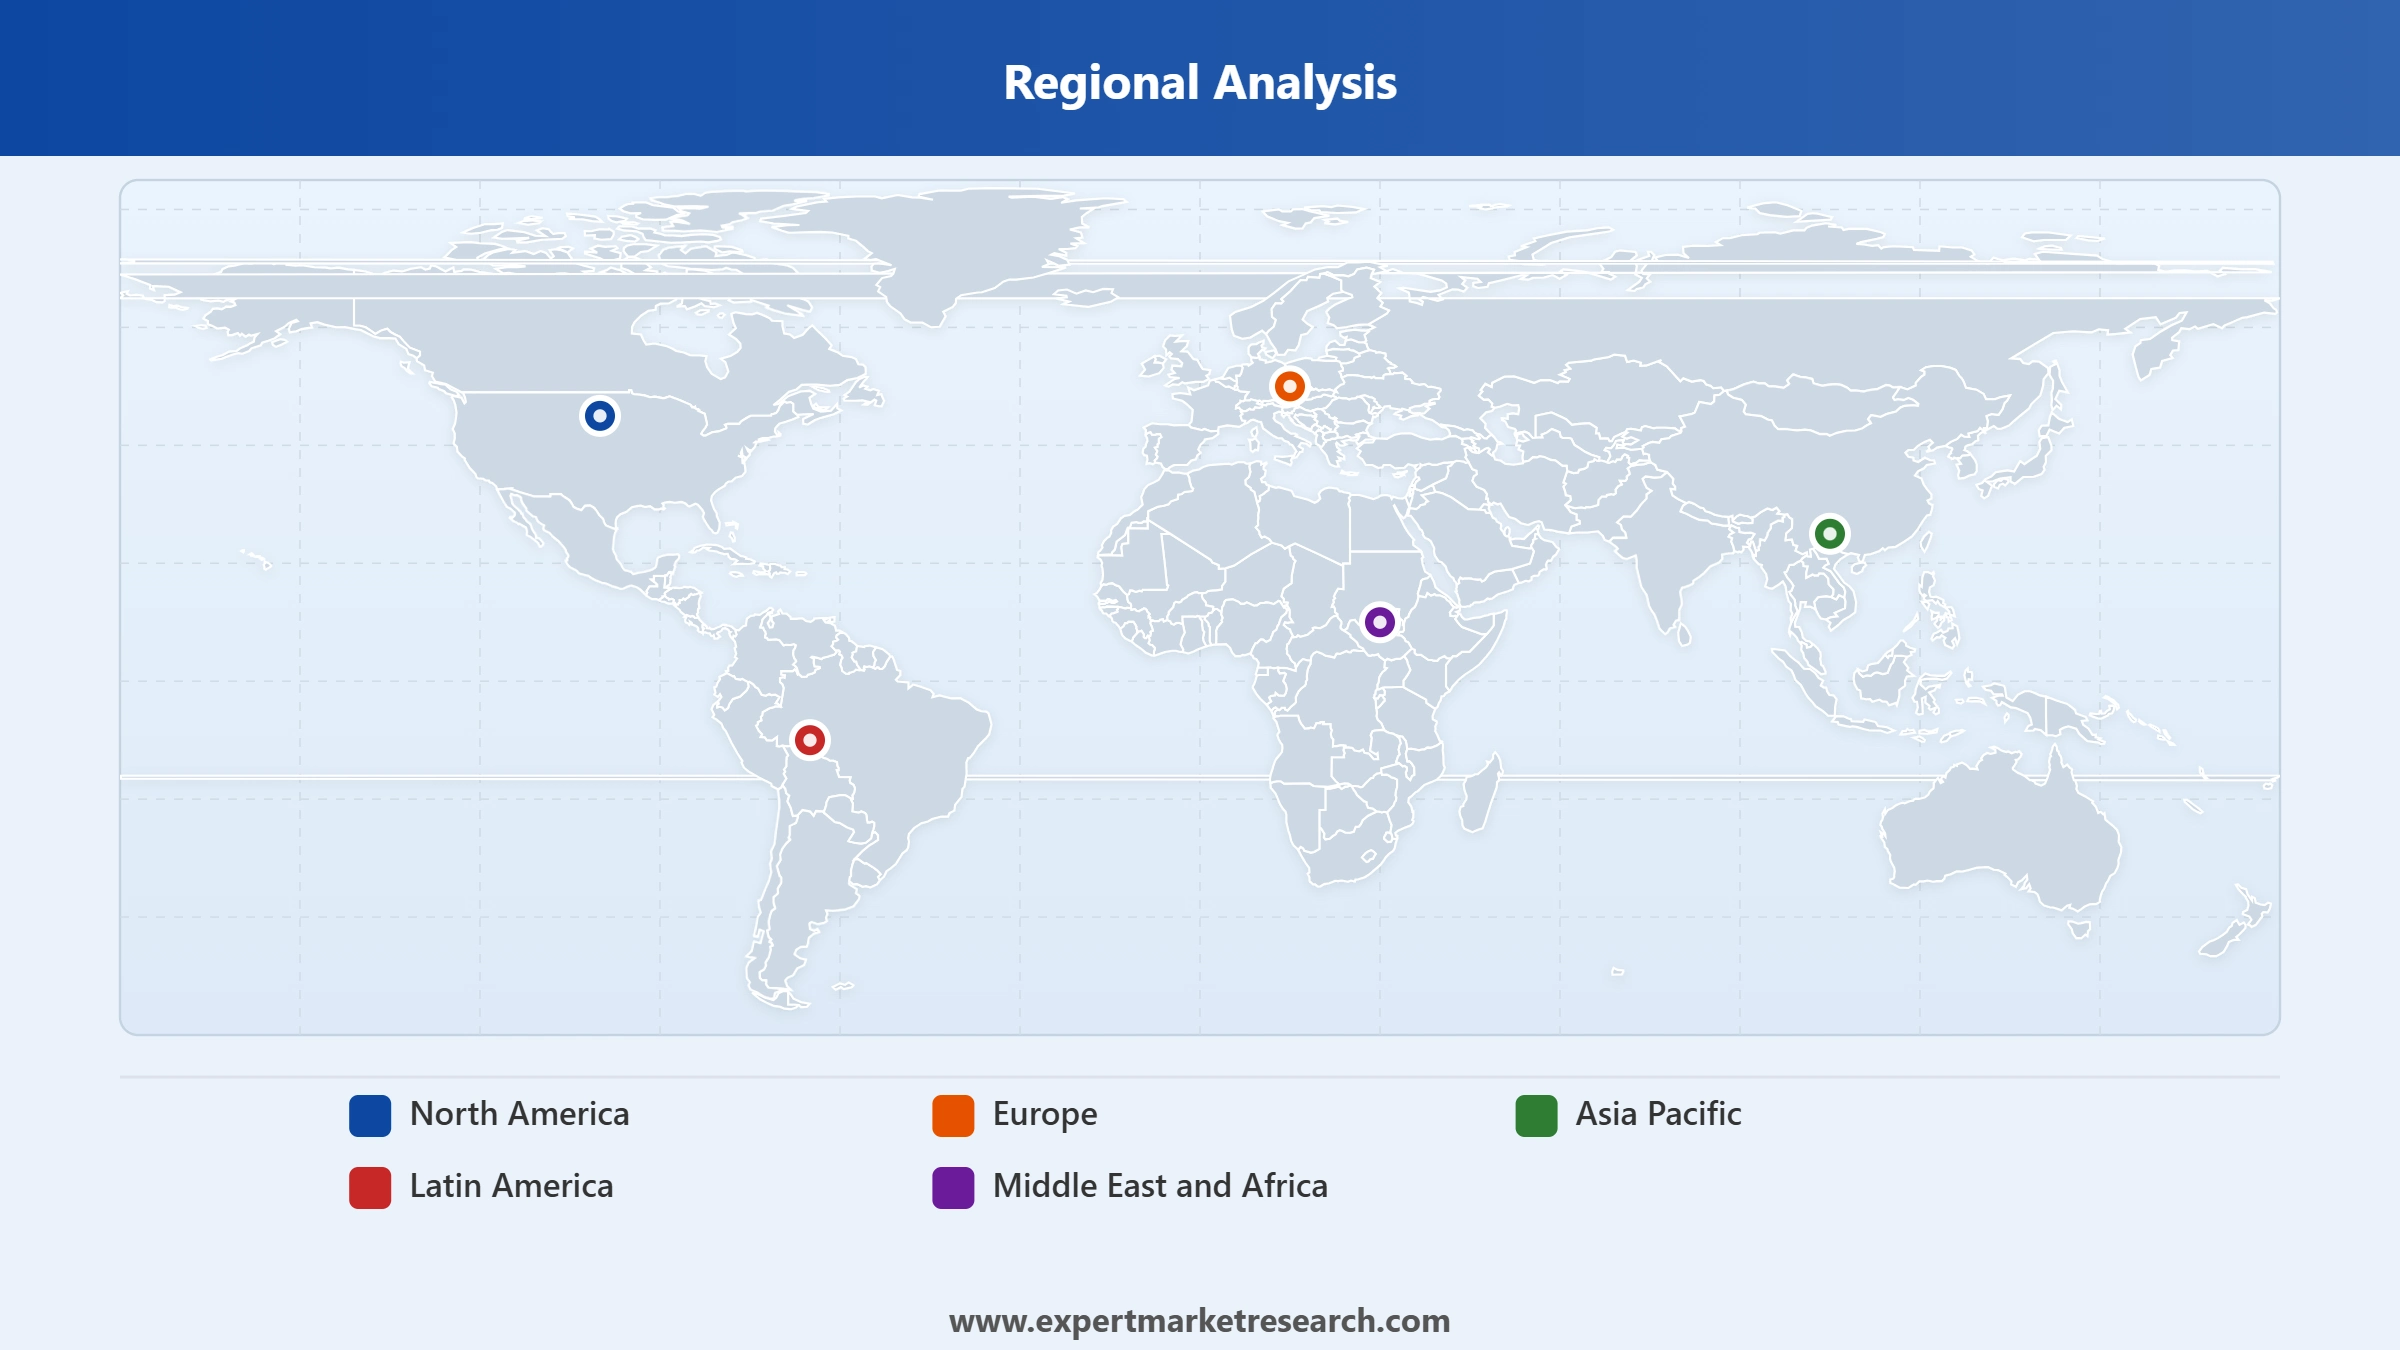
Asia Pacific dominates the global solar power market, led by China's 370 GW of solar PV added in 2025, covering over 60% of global additions per IEA. India's record 49 GW in 2025 further cemented the region's global solar leadership.
The Middle East and Africa is the fastest-growing region in the global solar power market growth story, increasing solar additions by 28.9% in 2025 to over 12 GW per IRENA, with Saudi Arabia reaching 11.9 GW of cumulative solar capacity.
Global solar added a record 510 GW of solar PV in 2025, representing 75% of all new renewable installations per IRENA. This milestone pushed cumulative solar PV to 2.39 TW, making solar the world's leading source of renewable energy capacity.
The report of Expert Market Research's titled "Global Solar Power Market Report and Forecast 2026-2035" offers a detailed analysis of the market based on the following segments:
Market Breakup by Technology
Key Insight: Solar photovoltaic is the dominant technology in the global solar power market, accounting for over 97% of global solar capacity additions in 2025, driven by falling mono-Si and bifacial module costs and scalability across all applications. Major manufacturers including Waaree Energies, JinkoSolar, and LONGi supply solar modules globally. Concentrated solar power represents a smaller but complementary share, serving high-temperature industrial heat and baseload utility applications in the Middle East and North Africa.
Market Breakup by Application
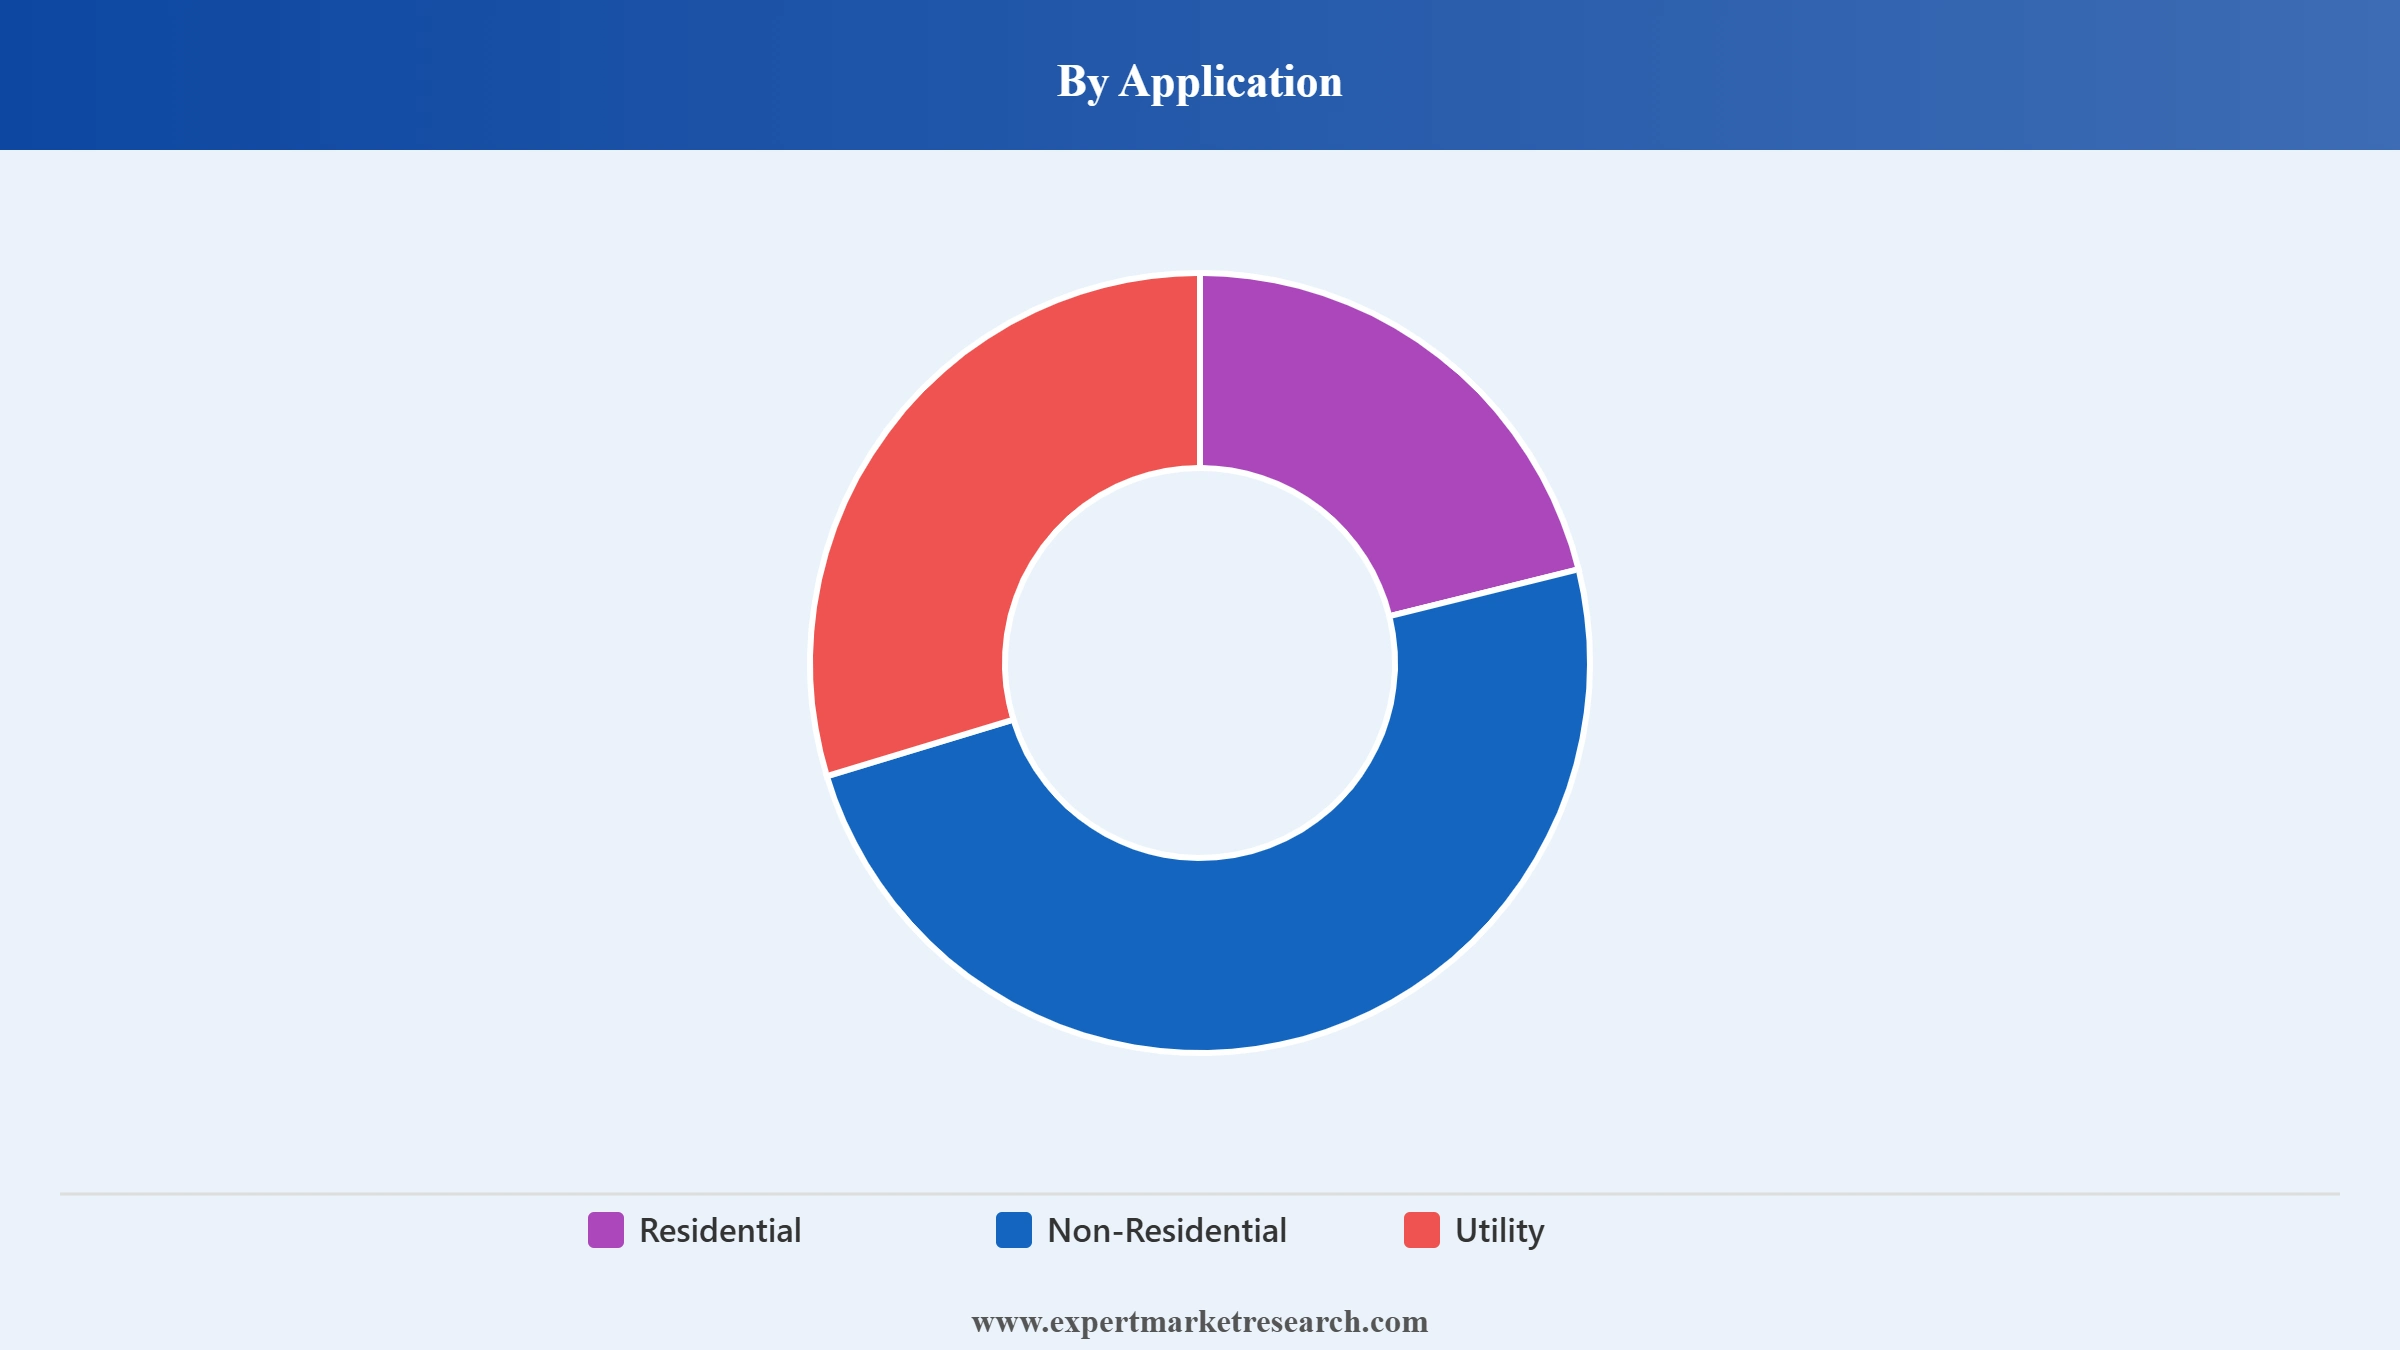
Key Insight: Utility solar is the dominant application in the global solar power market, driven by large government procurement programs, competitive levelised cost of electricity, and grid expansion initiatives. Residential solar is growing rapidly, supported by government incentives and declining installation costs. Tata Power Renewables commissioning a record 752 MW in a single quarter and Masdar's Abu Dhabi 5.2 GWdc project exemplify the scale of global solar power ambition.
Market Breakup by Region
Key Insight: Asia Pacific dominates the global solar power market, led by China's record 370 GW of solar PV added in 2025 and India's record 49 GW, together accounting for over 60% of global capacity additions per the IEA. North America is the second-largest regional market with the US adding 43 GW in 2025. The Middle East and Africa is the fastest-growing region, with solar additions increasing 28.9% in 2025 per IRENA.


Read more about this report - REQUEST FREE SAMPLE COPY IN PDF
By Technology, Solar Photovoltaic dominates the market due to low module costs, proven scalability, and rapid global deployment at all scales
Solar photovoltaic holds the dominant share in the global solar power market by technology, accounting for over 97% of all new solar capacity additions globally, driven by the sustained decline in mono-Si and bifacial module prices, improvements in panel efficiency, and proven scalability from small rooftop systems to gigawatt-scale utility parks. JinkoSolar, LONGi, JA Solar, and Waaree Energies are among the leading global module manufacturers supporting this widespread adoption. The IEA noted that solar PV accounted for more than three-quarters of all new renewable capacity additions globally in 2025, cementing its position as the defining technology of the energy transition.
Read more about this report - REQUEST FREE SAMPLE COPY IN PDF
Concentrated solar power holds a smaller but strategically important share in the global solar power market, valued for its ability to generate dispatchable thermal energy that can be stored and dispatched independently of sunlight. BrightSource Energy and EWEC operate large CSP installations providing high-temperature industrial heat and around-the-clock utility power in arid, high-irradiance environments. Masdar and EWEC's October 2025 announcement of a 5.2 GWdc solar plus 19 GWh battery storage project in Abu Dhabi reflects how CSP and solar-plus-storage are evolving together to deliver the continuous baseload renewable energy that the global economy increasingly demands.
By Application, Utility solar applications account for the dominant share of the market due to large government procurement, competitive LCOE, and grid-scale deployment
Utility-scale solar installations hold the dominant share in the global solar power market by application, driven by large government renewable energy procurement programs, highly competitive levelised cost of electricity making solar the cheapest new power source in most markets, and expanding grid infrastructure investment across Asia, the Middle East, and North America. Masdar and EWEC's 5.2 GWdc Abu Dhabi project, Waaree's 452 MW US supply contract, and Tata Power's record 752 MW commissioning in Q1 FY26 collectively illustrate the scale and momentum of utility solar growth.
Read more about this report - REQUEST FREE SAMPLE COPY IN PDF
Residential solar is the fastest-growing application segment in the global solar power market, driven by government subsidy programmes, net metering policies, falling rooftop installation costs, and growing household energy independence motivations. India's Tata Power Renewables reached 45,500 rooftop solar installations in Q1 FY26 alone, reflecting strong domestic demand. Non-residential solar, serving commercial and industrial customers, benefits from direct renewable energy procurement strategies and corporate net-zero commitments. SEIA reported the US commercial solar segment added 2,345 MWdc in 2025, a 6% year-on-year increase.
Asia Pacific dominates the market due to China's record solar installations, India's rapid capacity expansion, and scale manufacturing advantages
Asia Pacific is the dominant region in the global solar power market, driven primarily by China's extraordinary scale of solar deployment and India's rapidly accelerating installations. China alone commissioned nearly 370 GW of solar PV in 2025, accounting for over 60% of global capacity additions for the year, according to the IEA's Global Energy Review 2026. India added a record 49 GW of solar in 2025, up from 31.9 GW in 2024, cementing its position as the world's second-fastest growing solar market. Waaree Energies, Tata Power Solar, and major Chinese manufacturers including JinkoSolar and LONGi anchor the region's supply chain.
Read more about this report - REQUEST FREE SAMPLE COPY IN PDF
The Middle East and Africa is the fastest-growing region in the global solar power market, with solar additions increasing 28.9% in 2025 to exceed 12 GW, the largest annual solar increase ever recorded for the region per IRENA. Saudi Arabia reached 11.9 GW of cumulative solar capacity after adding more than 5 GW in 2024, while the UAE has become a global showcase for utility-scale solar projects. North America remains the second-largest market, with the United States adding 43 GW of new solar capacity in 2025, marking the fifth consecutive year as the leading new power source, according to SEIA. Europe added nearly 70 GW of solar PV in 2025, a record high per IEA.
The global solar power market features an intensely competitive landscape dominated by Chinese module manufacturers including JinkoSolar, LONGi, JA Solar, and Trina Solar, which collectively account for a substantial share of global solar panel shipments. Indian manufacturers including Waaree Energies and Tata Power Solar are rapidly expanding capacity through backward integration and international supply agreements, while US and European companies differentiate on technology innovation and localised manufacturing.
Strategic acquisitions, manufacturing scale-ups, and international supply contracts are defining the competitive race. Waaree Energies' 452 MW US supply order secured in August 2025 and its Sangam Solar One 1,500 MW facility launch in December 2025, alongside Tata Power Renewable Energy's board approval for a INR 6,500 crore 10 GW ingot and wafer facility in April 2026, reflect the intensifying investment in solar manufacturing capacity to serve growing global demand.
Waaree Energies Ltd., founded in 1990 and headquartered in Mumbai, India, is the country's largest solar module manufacturer and a leading player in the global solar power market. With 22.3 GW of global solar PV module capacity, the company supplies utility, commercial, and residential solar segments across over 20 countries.
BrightSource Energy, Inc., founded in 2004 and headquartered in Oakland, California, USA, is a leading developer of utility-scale concentrated solar power systems using power tower technology. The company's Ivanpah Solar Electric Generating System in California is one of the world's largest CSP facilities, serving utility-scale power generation.
SunPower Corporation, founded in 1985 and headquartered in San Jose, California, USA, is a solar technology and energy services company. It designs and manufactures high-efficiency solar panels for residential and commercial applications and has delivered solar energy systems generating over 15 GW of clean electricity globally.
Enkay Solar Power and Infrastructure Pvt. Ltd., founded in 2010 and headquartered in India, is a solar energy company specialising in design, development, and deployment of solar power systems. The company provides engineering, procurement, and construction services for utility-scale, commercial, and rooftop solar power projects.
Other key players in the market are Tata Power Solar Systems Limited, and Others.
*Please note that this is only a partial list; the complete list of key players is available in the full report. Additionally, the list of key players can be customized to better suit your needs.*
Access comprehensive intelligence on the global solar power market with Expert Market Research's 2026 report. Explore in-depth analysis of solar photovoltaic and concentrated solar power technology dynamics, demand segmentation across residential, non-residential, and utility applications, regional performance across Asia Pacific, North America, Europe, Latin America, and the Middle East and Africa, and competitive profiles of Waaree Energies, BrightSource Energy, SunPower, and Enkay Solar. Whether you are a solar panel manufacturer, utility developer, clean energy investor, or technology provider, this report delivers the clarity needed to capitalise on the global solar power opportunity. Download your free sample today.
Upto 15% Off
USD
$2499 $2249
$3999 $3599
$4999 $4249
$5999 $5099


*While we strive to always give you current and accurate information, the numbers depicted on the website are indicative and may differ from the actual numbers in the main report. At Expert Market Research, we aim to bring you the latest insights and trends in the market. Using our analyses and forecasts, stakeholders can understand the market dynamics, navigate challenges, and capitalize on opportunities to make data-driven strategic decisions.*
At 2025, the market reached an approximate value of USD 248.99 Billion.
The market is projected to grow at a CAGR of 7.10% between 2026 and 2035.
The global market size for solar power is expected to reach a value of USD 494.40 Billion by 2035.
The major market drivers are growing demands for renewable energy sources, improvements in solar power technology, population growth, and usage of solar power in mainstream utility applications.
The key trends of the market are increasing demand for electricity owing to economic development, growing investments in solar power infrastructure, and supportive initiatives by various governments.
The key players include Waaree Energies Ltd., BrightSource Energy, Inc., SunPower Corporation, Enkay Solar Power and Infrastructure Pvt. Ltd., Tata Power Solar Systems Limited, and Others.
Solar power is a form of energy obtained from sun by converting the solar energy into power using direct or indirect methods.
The primary technologies for solar power in the market are solar photovoltaic and concentrated solar power.
The different types of solar photovoltaic technology are mono-Si, thin film, and multi-Si, among others.
The various applications of solar power include residential, non-residential, and utility.
Explore our key highlights of the report and gain a concise overview of key findings, trends, and actionable insights that will empower your strategic decisions.
| REPORT FEATURES | DETAILS |
| Base Year | 2025 |
| Historical Period | 2019-2025 |
| Forecast Period | 2026-2035 |
| Scope of the Report |
Historical and Forecast Trends, Industry Drivers and Constraints, Historical and
|
| Breakup by Technology |
|
| Breakup by Application |
|
| Breakup by Region |
|
| Market Dynamics |
|
| Competitive Landscape |
|
| Companies Covered |
|
Datasheet
One User
USD 2,499
USD 2,249
tax inclusive*
Single User License
One User
USD 3,999
USD 3,599
tax inclusive*
Five User License
Five User
USD 4,999
USD 4,249
tax inclusive*
Corporate License
Unlimited Users
USD 5,999
USD 5,099
tax inclusive*
*Please note that the prices mentioned below are starting prices for each bundle type. Kindly contact our team for further details.*
Flash Bundle
Small Business Bundle
Growth Bundle
Enterprise Bundle
*Please note that the prices mentioned below are starting prices for each bundle type. Kindly contact our team for further details.*
Flash Bundle
Number of Reports: 3
20%
tax inclusive*
Small Business Bundle
Number of Reports: 5
25%
tax inclusive*
Growth Bundle
Number of Reports: 8
30%
tax inclusive*
Enterprise Bundle
Number of Reports: 10
35%
tax inclusive*
How To Order

Select License Type
Choose the right license for your needs and access rights.

Click on ‘Buy Now’
Add the report to your cart with one click and proceed to register.

Select Mode of Payment
Choose a payment option for a secure checkout. You will be redirected accordingly.
Strategic Solutions for Informed Decision-Making
Gain insights to stay ahead and seize opportunities.

Get insights & trends for a competitive edge.

Track prices with detailed trend reports.

Analyse trade data for supply chain insights.

Leverage cost reports for smart savings

Enhance supply chain with partnerships.

Connect For More Information
Our expert team of analysts will offer full support and resolve any queries regarding the report, before and after the purchase.
Our expert team of analysts will offer full support and resolve any queries regarding the report, before and after the purchase.
We employ meticulous research methods, blending advanced analytics and expert insights to deliver accurate, actionable industry intelligence, staying ahead of competitors.
Our skilled analysts offer unparalleled competitive advantage with detailed insights on current and emerging markets, ensuring your strategic edge.
We offer an in-depth yet simplified presentation of industry insights and analysis to meet your specific requirements effectively.


