Explore Our Diverse Range Of Offerings
From detailed reports to experts services offered in 15+ Industry Domains
Report
Press Release
Blogs
Industry Statistics
Add 2 More Reports For 20% off

Report Overview

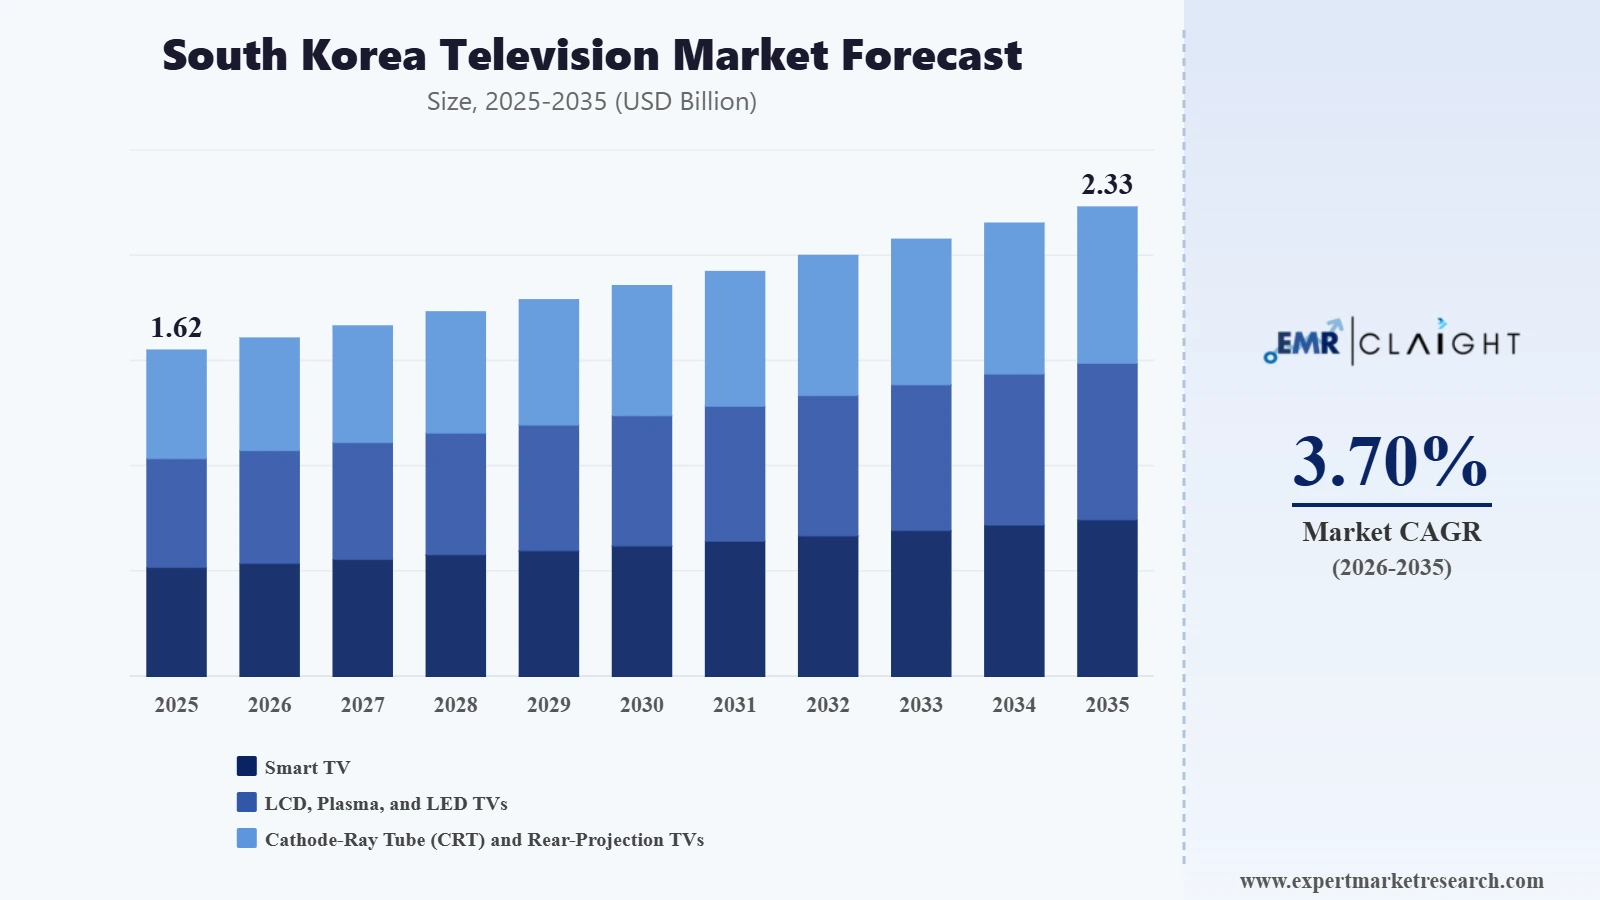
The South Korea television market reached around USD 1.62 Billion in 2025. The market is projected to grow at a CAGR of 3.40% between 2026 and 2035, reaching almost USD 2.26 Billion by 2035.

Q1 2026 Market Updates

Geopolitical Impact of Iran, US, and Israel War on the South Korea Television Market

United States: The South Korea Television Market, a key segment of the global economy, is experiencing a complex operating environment in Q1 2026 as a direct consequence of the US-Israel-Iran war. South Korea imports over 80% of its oil from the Middle East, making it among the most structurally exposed Asian economies to the Strait of Hormuz closure. The government released strategic reserves to cushion the shock. Qatar provides a significant share of South Korea's LNG imports. QatarEnergy's force majeure has created acute LNG supply uncertainty, pushing electricity costs higher for industrial and commercial users. Rising industrial energy costs are filtering through to all manufacturing and consumer sectors in South Korea, while the government's emergency reserve release provides partial but temporary buffer.

Iran: Iran's domestic South Korea Television sector has been effectively suspended by the conflict. US-Israeli strikes on industrial and civilian infrastructure across Tehran, Mashhad, Isfahan, and other major cities have disrupted all commercial activity. Power outages from attacks on electricity generation facilities have halted manufacturing operations, and the collapse of the commercial banking and logistics system has eliminated any residual trade flows. The broader humanitarian crisis, with over 1,900 casualties and 4,000+ civilian buildings damaged, has redirected the entire Iranian economy toward survival rather than production or consumption.

Israel: Israel's South Korea Television sector is experiencing near-term disruption from wartime conditions. Consumer spending on non-essential categories has declined as millions of Israelis regularly shelter from missile and drone alerts. Supply chain logistics are disrupted by regional airspace closures, elevated war-risk insurance premiums, and the suspension of major carrier services through the region. International business partnerships with Israeli companies have been temporarily suspended. Post-conflict reconstruction and recovery demand is expected to provide meaningful demand acceleration across affected market segments once operational conditions normalise.

Key Takeaways

Government

  • South Korean transport authorities should implement emergency fuel cost support mechanisms for commercial freight operators, recognising that 40% diesel cost increases are threatening the viability of smaller carriers and creating inflationary pressure throughout supply chains.
  • Aviation regulators should coordinate with carriers on emergency route optimisation protocols that minimise the operational impact of Middle Eastern airspace closures, reducing the fuel cost penalty for rerouted international services.
  • Trade ministries should assess port and logistics capacity constraints from diverted shipping around the Cape of Good Hope, ensuring that alternative routing does not create bottlenecks at non-Gulf hub ports.

Market

  • Diesel costs up approximately 40% and jet fuel costs nearly doubled are creating the most significant fuel inflation shock for the transport sector since the 2022 commodity cycle, with impacts that are expected to persist throughout the conflict.
  • The suspension of Middle Eastern airspace and the Cape of Good Hope rerouting of container shipping are adding structural cost increases to global logistics chains that cannot be rapidly reversed even if a ceasefire is reached.
  • Electric and alternative fuel transport solutions are receiving a powerful demand signal from the conflict's petroleum cost shock, accelerating fleet electrification planning across commercial transport operators globally.

Procurement

  • Fleet operators and logistics companies should lock in fuel hedging arrangements at current diesel prices ahead of further escalation, and activate variable fuel surcharge mechanisms to protect margins during the conflict period.
  • Procurement teams should build 60-day buffer inventory for critical transport consumables, maintenance parts, and equipment components, given that global freight costs are elevated and lead times extended by the Cape of Good Hope rerouting.
  • Supply chain managers should review routing optimisation for all freight movements, assessing whether multi-modal and nearshoring strategies can reduce the fuel cost and logistics disruption exposure created by Gulf shipping route closures.
2025

Base Year

2019-2025

Historical Period

2026-2035

Forecast Period

  • Smart TVs are expected to gain significant popularity over the forecast period.

  • The export of innovative television sets from South Korea is expected to drive the market growth.

  • Online channels are expected to become a reliable source for purchasing television sets in South Korea.

Compound Annual Growth Rate

3.4%

Value in USD Billion

2026-2035


*this image is indicative*

South Korea Television Market Growth

Major market players in South Korea are introducing free ad-supported streaming services, where consumers can watch OTT shows and movies on their televisions without paying for any subscriptions. Moreover, companies are expected to introduce software updates for their existing web operating systems in smart TVs, to compete with the rising influence of television sets being manufactured and introduced by Chinese companies. With a shift towards smart living solutions, TV manufacturers are expected to revise their production and distribution strategies to maintain profitability in the linear television market.

Smart TVs have eliminated the cost of investing in televisions, set-top boxes, subscription plans, and infrastructure space. An increasing number of consumers in South Korea are watching OTT shows and movies, which is contributing towards the popularity of smart TVs.

Rising internet accessibility and smartphone penetration rates are expected to drive the popularity of online distribution channels among South Korean consumers for purchasing television sets. Online channels provide attractive discount offers with guaranteed refunds in case of delivery of defective products. They also provide doorstep deliveries of bulky electronics goods, which is expected to drive their popularity over the forecast period.

South Korea Television Industry Segmentation

"South Korea Television Market Report and Forecast 2026-2035" offers a detailed analysis of the market based on the following segments:

Market Breakup by Type

  • Smart TV 
  • LCD, Plasma, and LED TVs 
  • Cathode-Ray Tube (CRT) and Rear-Projection TVs

Market Breakup by Distribution Channel

  • Offline
  • Online

South Korea Television Market Share

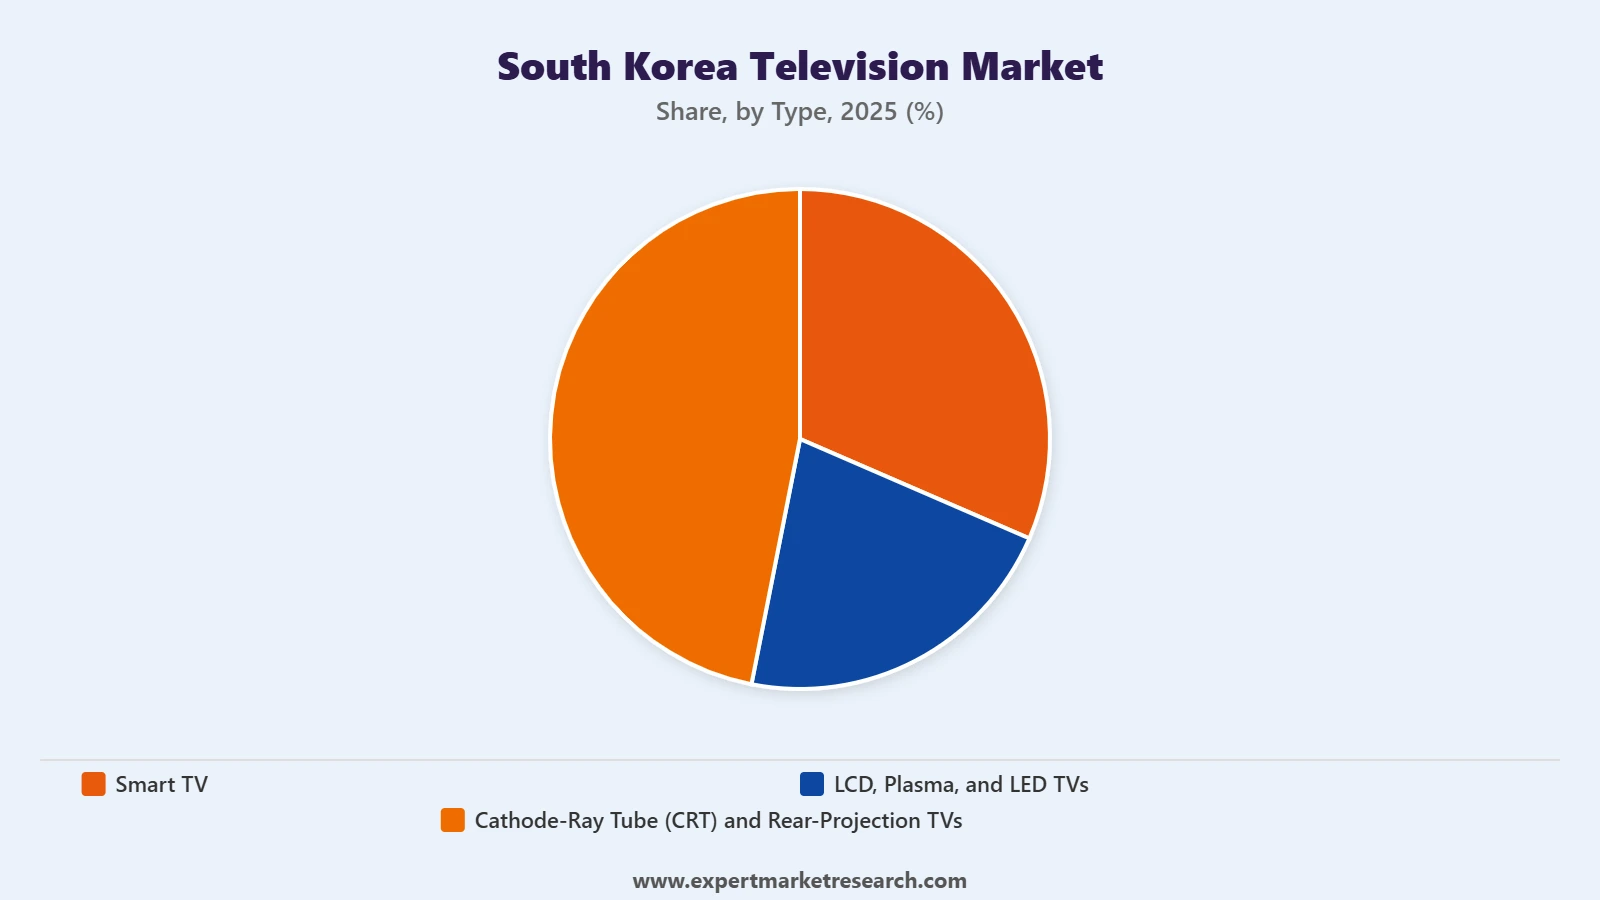
Based on type, the market can be divided into smart TVs, LCD, plasma, and LED TVs, and cathode-ray tube (CRT) and rear-projection TVs. Over the forecast period, LCD, plasma, and LED TVs are expected to remain one of the major market segments, as companies launch innovative models of television sets to appeal to consumers.

Leading Companies in the South Korea Television Market

Major companies are focusing on using sustainable materials in designing modern television sets, including smart TVs or Cathode-Ray Tube (CRT) and Rear-Projection TVs.

  • Samsung Electronics Co. Ltd.
  • LG Corp.
  • Panasonic Holdings Corp.
  • Sony Group Corp.
  • Toshiba Corporation
  • Haier Smart Home Co. Ltd.
  • Others

*While we strive to always give you current and accurate information, the numbers depicted on the website are indicative and may differ from the actual numbers in the main report. At Expert Market Research, we aim to bring you the latest insights and trends in the market. Using our analyses and forecasts, stakeholders can understand the market dynamics, navigate challenges, and capitalize on opportunities to make data-driven strategic decisions.*

Looking for specific insights?

Get in touch with us for a customized solution tailored to your unique requirements and save upto 35%!

Key Questions Answered in the Report

The market reached nearly USD 1.62 Billion in 2025.

The market is projected to grow at a CAGR of 3.40% between 2026 and 2035.

The market is assessed to witness a healthy growth in the forecast period to reach around USD 2.26 Billion in 2035.

The different types of televisions in the market include smart TVs, LCD, plasma, and LED TVs, and cathode-ray tube (CRT) and rear-projection TVs.

The different distribution channels of television in the market include offline and online.

The key market players are Samsung Electronics Co. Ltd., LG Corp., Panasonic Holdings Corp., Sony Group Corp., Toshiba Corporation, and Haier Smart Home Co. Ltd.  among others.

Report Summary

Explore our key highlights of the report and gain a concise overview of key findings, trends, and actionable insights that will empower your strategic decisions.

Key Highlights of the Report

Please note that the figures mentioned in the description serve as estimates and may vary from the actual figures presented in the final report.

REPORT FEATURES DETAILS
Base Year 2025
Historical Period 2019-2025
Forecast Period 2026-2035
Scope of the Report

Historical and Forecast Trends, Industry Drivers and Constraints, Historical and Forecast Market Analysis by Segment:

  • Type
  • Distribution Channel
Breakup by Type
  • Smart TV 
  • LCD, Plasma, and LED TVs
  • Cathode-Ray Tube (CRT) and Rear-Projection TVs
Breakup by Distribution Channel
  • Offline
  • Online
Market Dynamics
  • SWOT Analysis
  • Porter's Five Forces Analysis
  • Key Indicators for Demand
  • Key Indicators for Price
Competitive Landscape
  • Market Structure
  • Company Profiles
    • Company Overview
    • Product Portfolio
    • Demographic Reach and Achievements
    • Certifications
Companies Covered
  • Samsung Electronics Co., Ltd.
  • LG Corp.
  • Panasonic Holdings Corp.
  • Sony Group Corp.
  • Toshiba Corporation
  • Haier Smart Home Co. Ltd.
  • Others

Datasheet

10 % Off

USD

2,499

2,249

Single User License

10 % Off

USD

3,999

3,599

Five User License

15 % Off

USD

4,999

4,249

Corporate License

15 % Off

USD

5,999

5,099

Datasheet

One User

USD 2,499

USD 2,249

tax inclusive*

  • Selected Segments
  • Printing Restrictions
  • Excel Spreadsheet Delivered via Email
  • Full Report
  • Periodic Updates
  • Post Sales Analysts Support
  • Unlimited Prints

Single User License

One User

USD 3,999

USD 3,599

tax inclusive*

  • All Segments
  • Printing Restrictions
  • PDF Delivered via Email
  • Custom Report Layout
  • Post Sales Analysts Support
  • Periodic Updates
  • Unlimited Prints

Five User License

Five User

USD 4,999

USD 4,249

tax inclusive*

  • All Segments
  • Five Prints Available
  • PDF Delivered via Email
  • Limited Free Customization
  • Post Sales Analyst Support
  • Custom Report Layout
  • Periodic Updates
  • Unlimited Prints

Corporate License

Unlimited Users

USD 5,999

USD 5,099

tax inclusive*

  • All Segments
  • Unlimited Prints Available
  • PDF & Excel Delivery via Email
  • Limited Free Customization
  • Post Sales Analysts Support
  • Discount On Next Update
  • Custom Report Layout

*Please note that the prices mentioned below are starting prices for each bundle type. Kindly contact our team for further details.*

Bundle Type

Flash Bundle

20% OFF Number of Reports: 3

Small Business Bundle

25% OFF Number of Reports: 5

Growth Bundle

30% OFF Number of Reports: 8

Enterprise Bundle

35% OFF Number of Reports: 10
Overview
  • Life Time Access
  • Analyst Support Related to Report
  • PDF Version of the Report
  • Complimentary Excel Data Set
  • Free Analyst Hours
  • Complimentary Free 1 Month Subscription to Trade Data Base
  • Complimentary One Month Subscription to Price Database (Chemicals only)
  • Complimentary PPT Version of the Report
  • Complimentary License Upgrade
  • Complimentary Power BI Dashboards
  • Life Time Access
  • Analyst Support Related to Report
  • PDF Version of the Report
  • Complimentary Excel Data Set
  • Free Analyst Hours - 50 Hours
  • Complimentary Free 1 Month Subscription to Trade Data Base
  • Complimentary One Month Subscription to Price Database (Chemicals only)
  • Complimentary PPT Version of the Report
  • Complimentary License Upgrade
  • Complimentary Power BI Dashboards
  • Life Time Access
  • Analyst Support Related to Report
  • PDF Version of the Report
  • Complimentary Excel Data Set
  • Free Analyst Hours - 80 Hours
  • Complimentary Free 1 Month Subscription to Trade Data Base
  • Complimentary One Month Subscription to Price Database (Chemicals only)
  • Complimentary PPT Version of the Report
  • Complimentary License Upgrade
  • Complimentary Power BI Dashboards
  • Life Time Access
  • Analyst Support Related to Report
  • PDF Version of the Report
  • Complimentary Excel Data Set
  • Free Analyst Hours - 100 Hours
  • Complimentary Free 1 Month Subscription to Trade Data Base
  • Complimentary One Month Subscription to Price Database (Chemicals only)
  • Complimentary PPT Version of the Report
  • Complimentary License Upgrade
  • Complimentary Power BI Dashboards

*Please note that the prices mentioned below are starting prices for each bundle type. Kindly contact our team for further details.*

Flash Bundle

Number of Reports: 3

20%

tax inclusive*

  • 3 Reports Included
  • Life Time Acess
  • Analyst Support Related to Report
  • PDF Version of the Report
  • Free 1 Month Subscription to Trade Data Base
  • 1 Month Subscription to Price Database (Chemicals only)
  • Complimentary Excel Data Set
  • PPT Version of the Report
  • Power BI Dashboards
  • License Upgrade
  • Free Analyst Hours

Small Business Bundle

Number of Reports: 5

25%

tax inclusive*

  • 5 Reports Included
  • Life Time Acess
  • Analyst Support Related to Report
  • PDF Version of the Report
  • Complimentary Excel Data Set
  • Free Analyst Hours - 50 Hours
  • Free 1 Month Subscription to Trade Data Base
  • 1 Month Subscription to Price Database (Chemicals only)
  • Complimentary Excel Data Set
  • PPT Version of the Report
  • Power BI Dashboards
  • License Upgrade

Growth Bundle

Number of Reports: 8

30%

tax inclusive*

  • 8 Reports Included
  • Life Time Acess
  • Analyst Support Related to Report
  • PDF Version of the Report
  • Complimentary Excel Data Set
  • Free Analyst Hours - 50 Hours
  • Free 1 Month Subscription to Trade Data Base
  • 1 Month Subscription to Price Database (Chemicals only)
  • License Upgrade
  • Free Analyst Hours - 80 Hours
  • Power BI Dashboards

Enterprise Bundle

Number of Reports: 10

35%

tax inclusive*

  • 10 Reports Included
  • Life Time Acess
  • Analyst Support Related to Report
  • PDF Version of the Report
  • Complimentary Excel Data Set
  • Free Analyst Hours - 50 Hours
  • Free 1 Month Subscription to Trade Data Base
  • 1 Month Subscription to Price Database (Chemicals only)
  • License Upgrade
  • Power BI Dashboards
  • Free Analyst Hours - 100 Hours

How To Order

This is a collaborative report by Avni Johari, Siddharth David and Udeesha Tomar reflecting perspectives and research-driven insights from Expert Market Research.

Our step-by-step guide will help you select, purchase, and access your reports swiftly, ensuring you get the information that drives your decisions, right when you need it.

License Type

Select License Type

Choose the right license for your needs and access rights.

shopping cart

Click on ‘Buy Now’

Add the report to your cart with one click and proceed to register.

Bookmark Icon

Select Mode of Payment

Choose a payment option for a secure checkout. You will be redirected accordingly.

Strategic Solutions for Informed Decision-Making

Connect For More Information

Our expert team of analysts will offer full support and resolve any queries regarding the report, before and after the purchase.

Our expert team of analysts will offer full support and resolve any queries regarding the report, before and after the purchase.

We employ meticulous research methods, blending advanced analytics and expert insights to deliver accurate, actionable industry intelligence, staying ahead of competitors.

Our skilled analysts offer unparalleled competitive advantage with detailed insights on current and emerging markets, ensuring your strategic edge.

We offer an in-depth yet simplified presentation of industry insights and analysis to meet your specific requirements effectively.

We’re here to help answer any questions about our products and services.

Contact us