

Consumer Insights
Uncover trends and behaviors shaping consumer choices today
Procurement Insights
Optimize your sourcing strategy with key market data
Industry Stats
Stay ahead with the latest trends and market analysis.
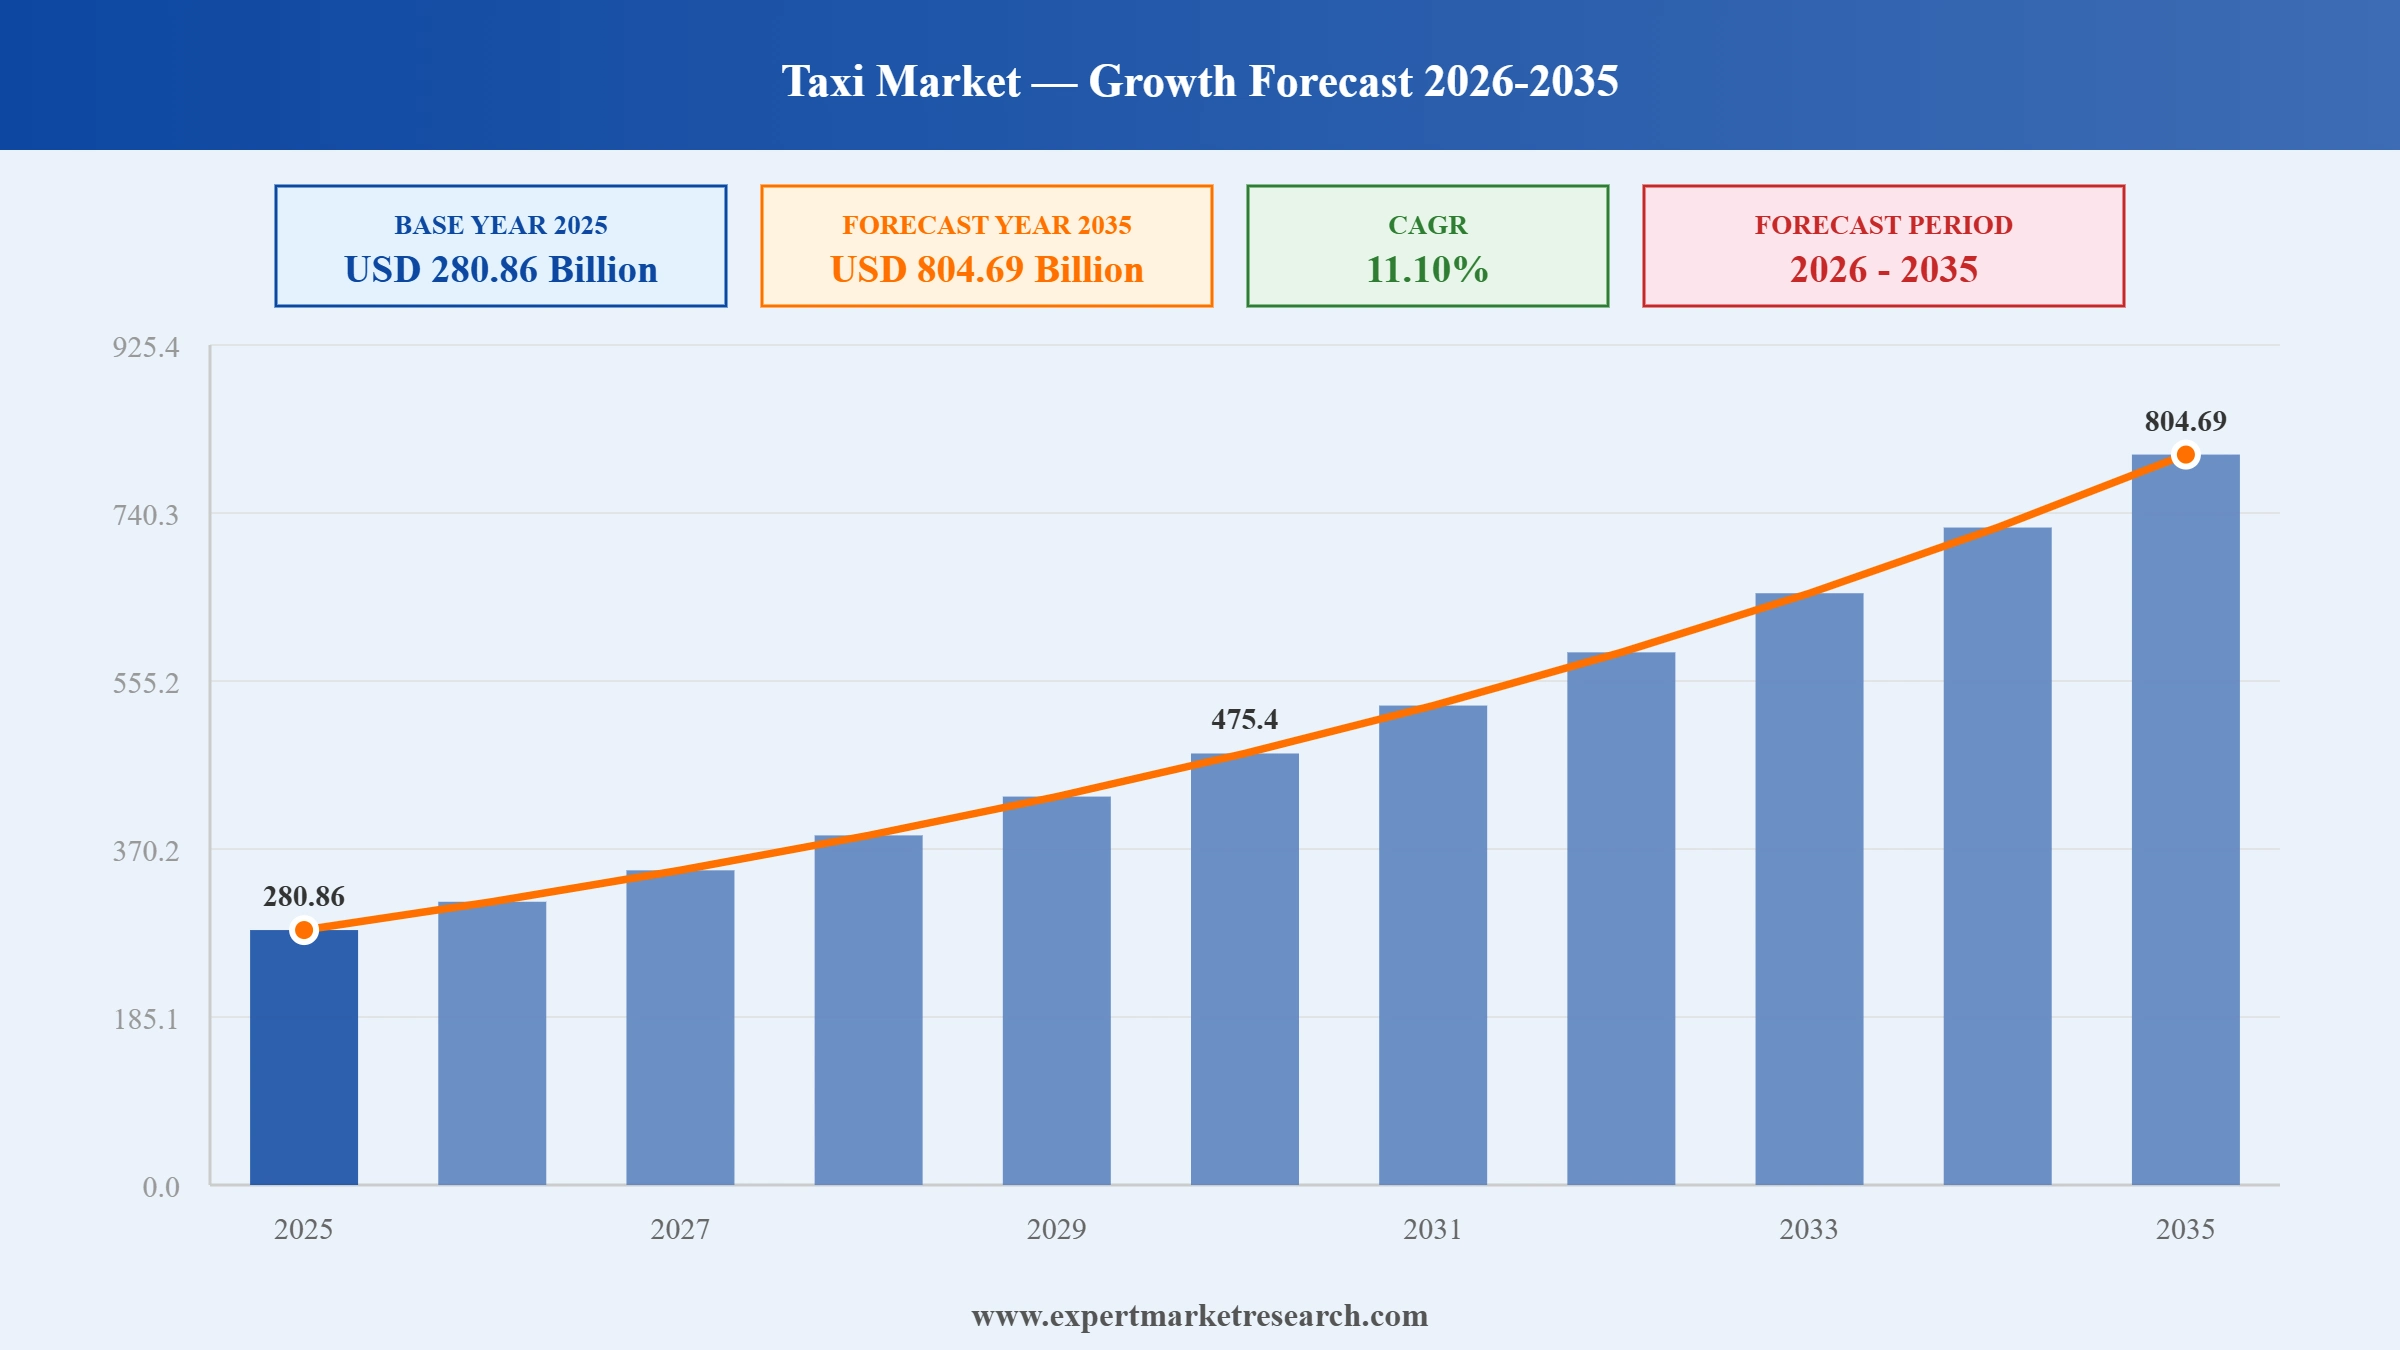
Global Taxi Market reached a value of USD 280.86 Billion in 2025 and is set to grow at a CAGR of around 11.10% through 2026-2035. The expansion of app-based ride-hailing, adoption of electric and autonomous vehicles, strategic partnerships, micro-mobility integration, and AI-driven route optimisation are reinforcing growth momentum. The market is on track to reach USD 804.69 Billion by 2035. Rising urbanisation, smartphone penetration, sustainability goals, and the emergence of air taxis and eVTOL technology are fuelling the global taxi market.
Read more about this report - REQUEST FREE SAMPLE COPY IN PDF
The global taxi market is being shaped by app-based mobility, electrification, autonomy, and micro-mobility. Leading players are expanding across regions, electrifying fleets, integrating two-wheeler services, and pursuing acquisitions and partnerships to capture demand.
In May 2026, Bolt expanded its ride-hailing services into Abu Dhabi in partnership with Dubai Taxi Company. The move built on the integration of 1,823 National Taxi vehicles onto the Bolt platform in Dubai and a 24% rise in DTC e-hailing activity in 2025.
In November 2025, Uber committed to electric vehicle adoption by offering drivers USD 4,000 rebates for switching to electric vehicles. The incentive helps overcome upfront cost barriers and accelerates fleet electrification across the company's global ride-hailing network.
In August 2025, Rapido introduced Bike Direct in Karnataka, India, a non-profit bike taxi service designed to navigate regulatory hurdles. Offering quick, affordable rides through congested streets, the launch underscores the rise of micro-mobility and two-wheeler taxis in urban markets.
In April 2025, Lyft acquired European taxi app Free Now for EUR 175 million (around USD 199 million), marking its first strategic entry into the European market. The deal extends Lyft's reach beyond North America into multiple European cities.
App-based ride-hailing anchors the global taxi market. Rising smartphone penetration, urbanisation, and demand for convenient, cashless, on-demand mobility drive growth, as platforms expand fleets, optimise routes with AI, and convert traditional street-hailing into digital e-hailing trips.
Electrification is reshaping the global taxi market. Environmental concerns and regulatory pressures are driving EV and hybrid adoption, with operators offering incentives, deploying electric fleets, and building charging access to cut emissions and operating costs across major cities.
Autonomous mobility is advancing in the global taxi market. Driverless robotaxi services and trials are expanding in select cities, supported by regulatory approvals, as operators explore autonomous fleets to improve safety, efficiency, and convenience in urban ride-hailing.
Micro-mobility is a key trend in the global taxi market. In congested urban centres, two-wheeler and bike taxis offer quick, affordable, and agile alternatives to cars, helping operators serve dense, traffic-heavy cities, particularly across Asia Pacific and other emerging markets.
Air taxis are an emerging frontier in the global taxi market. The adoption of eVTOL technology promises reduced travel times and enhanced connectivity in densely populated cities, as rising congestion, commuter demand, and sustainability goals push operators to explore aerial alternatives.
The report of Expert Market Research's titled “Global Taxi Market Report and Forecast 2026-2035” offers a detailed analysis of the market based on the following segments:
Market Breakup by Service Type
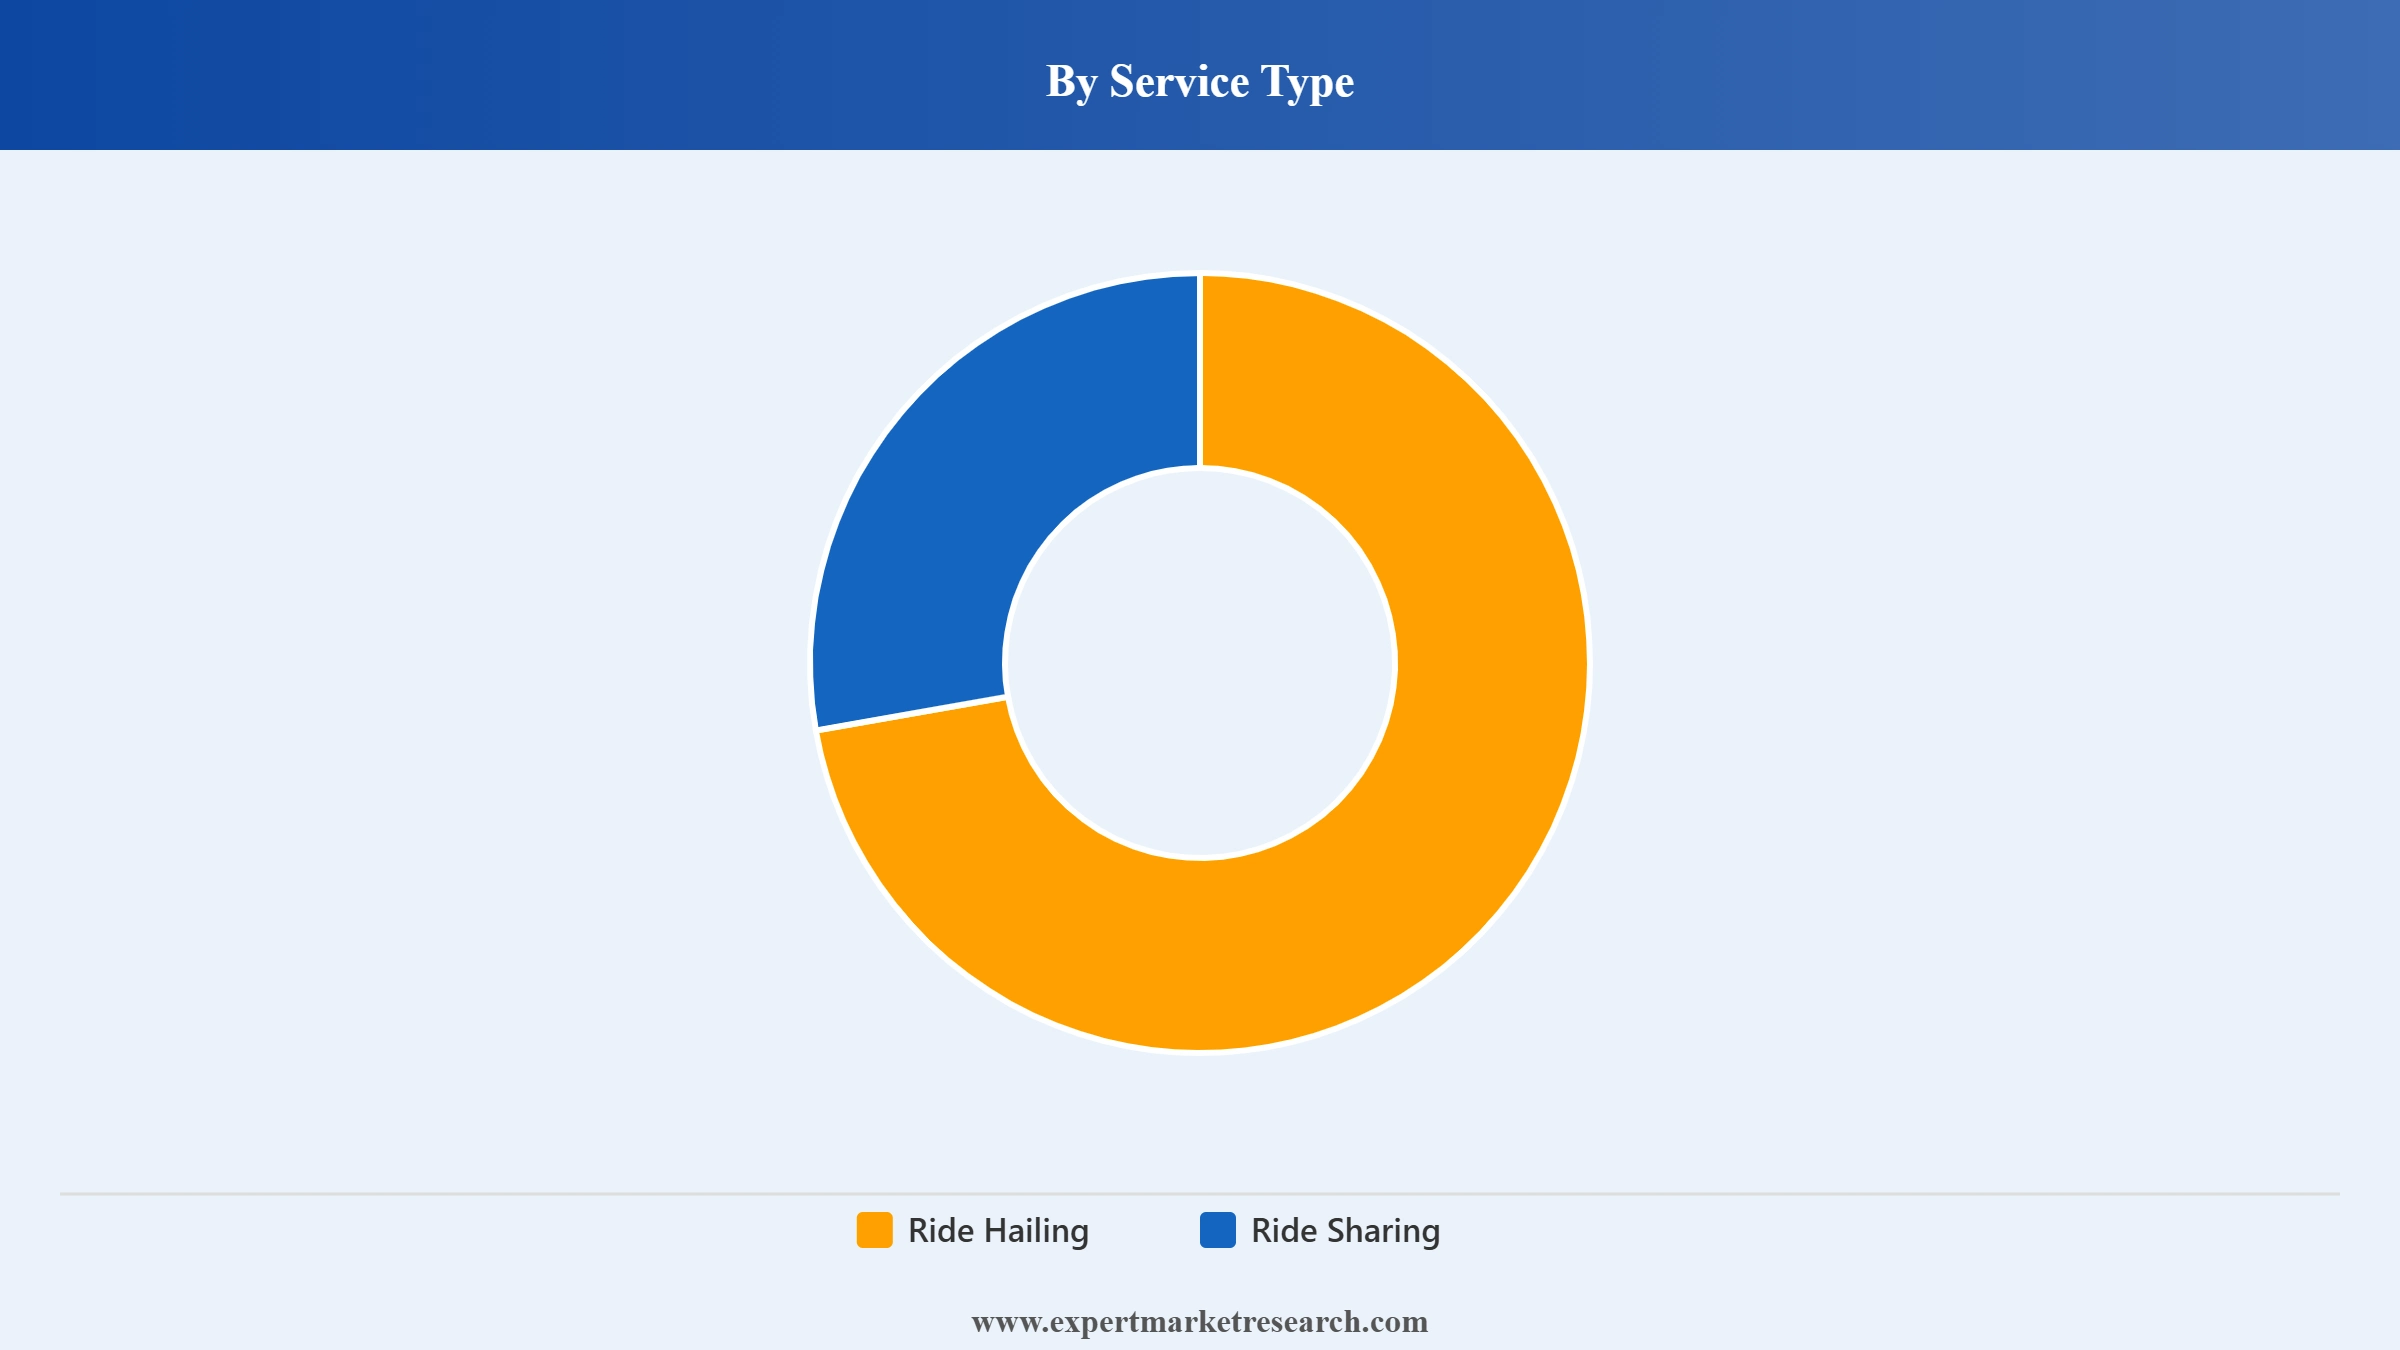
Key Insight: Ride hailing accounts for the largest share of the market, driven by app-based, on-demand convenience, transparent pricing, and door-to-door service. Ride sharing grows on affordability and sustainability, as pooled rides appeal to cost-conscious and environmentally aware commuters in dense urban areas.
Market Breakup by Booking Type
Key Insight: Online booking dominates and grows fastest, supported by smartphones, apps, cashless payments, and real-time tracking. Offline booking, including street-hailing and phone bookings, persists in some regions and segments but is steadily converting to digital e-hailing across global markets.
Market Breakup by Vehicle Type
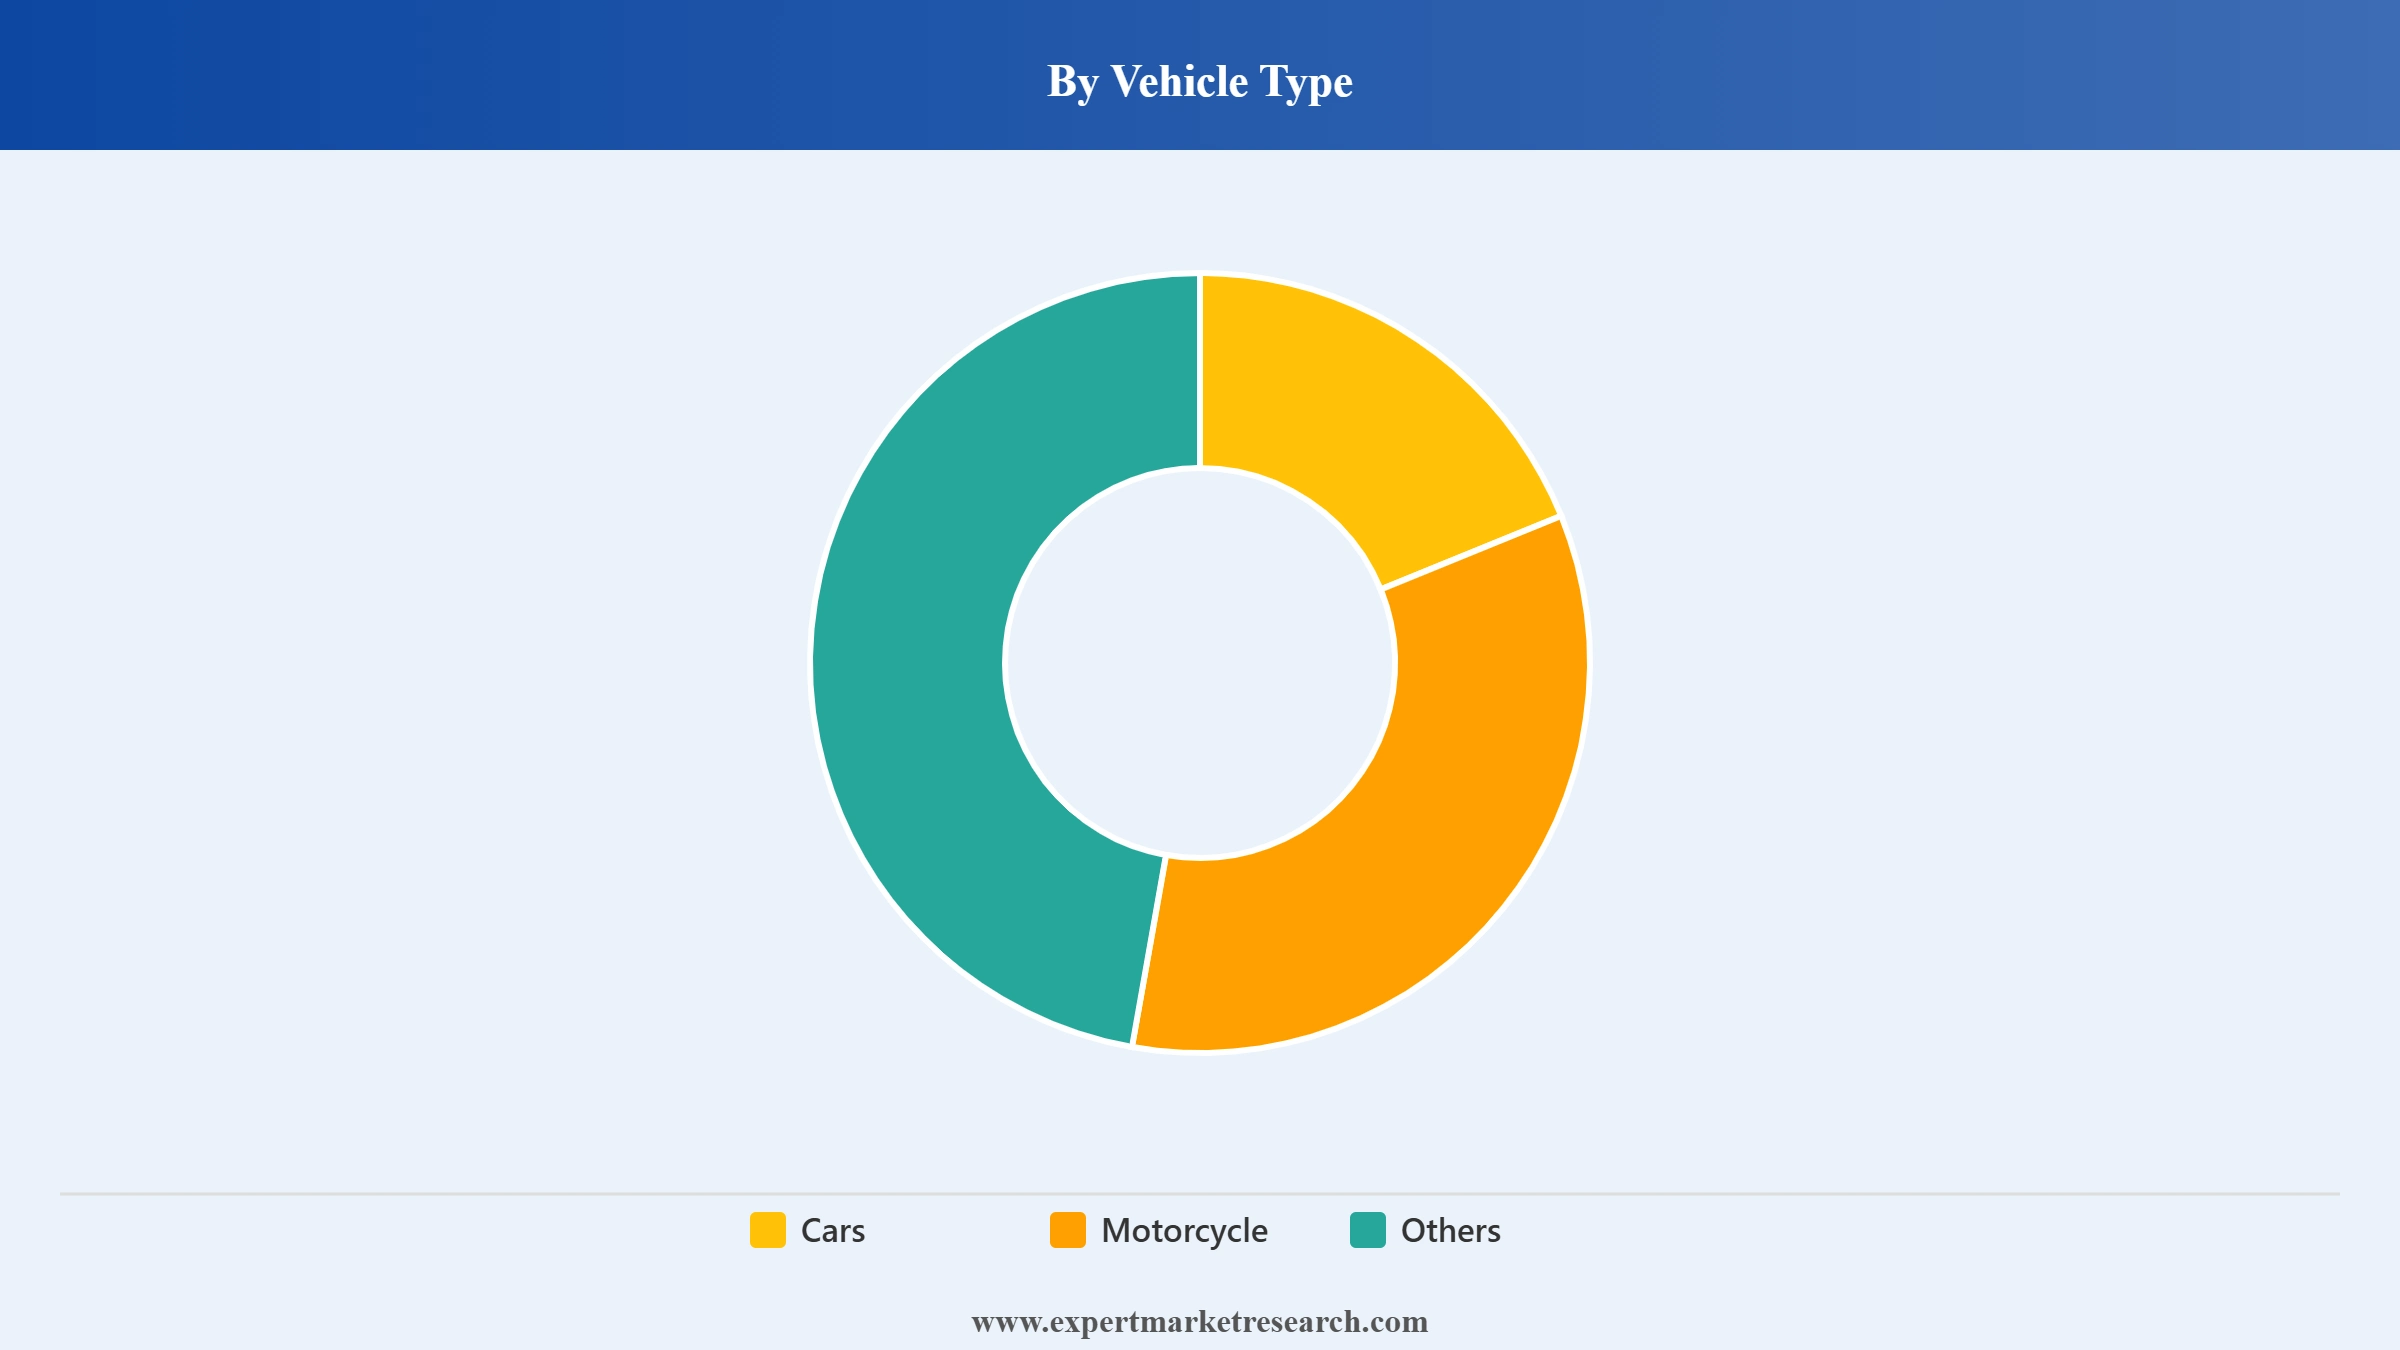
Key Insight: Cars hold the largest share of the market, offering comfort, capacity, and broad applicability across use cases. Motorcycle and two-wheeler taxis grow fast in congested cities, particularly in Asia Pacific, while other vehicle types, including emerging eVTOL air taxis, broaden the mobility mix.
Market Breakup by Region
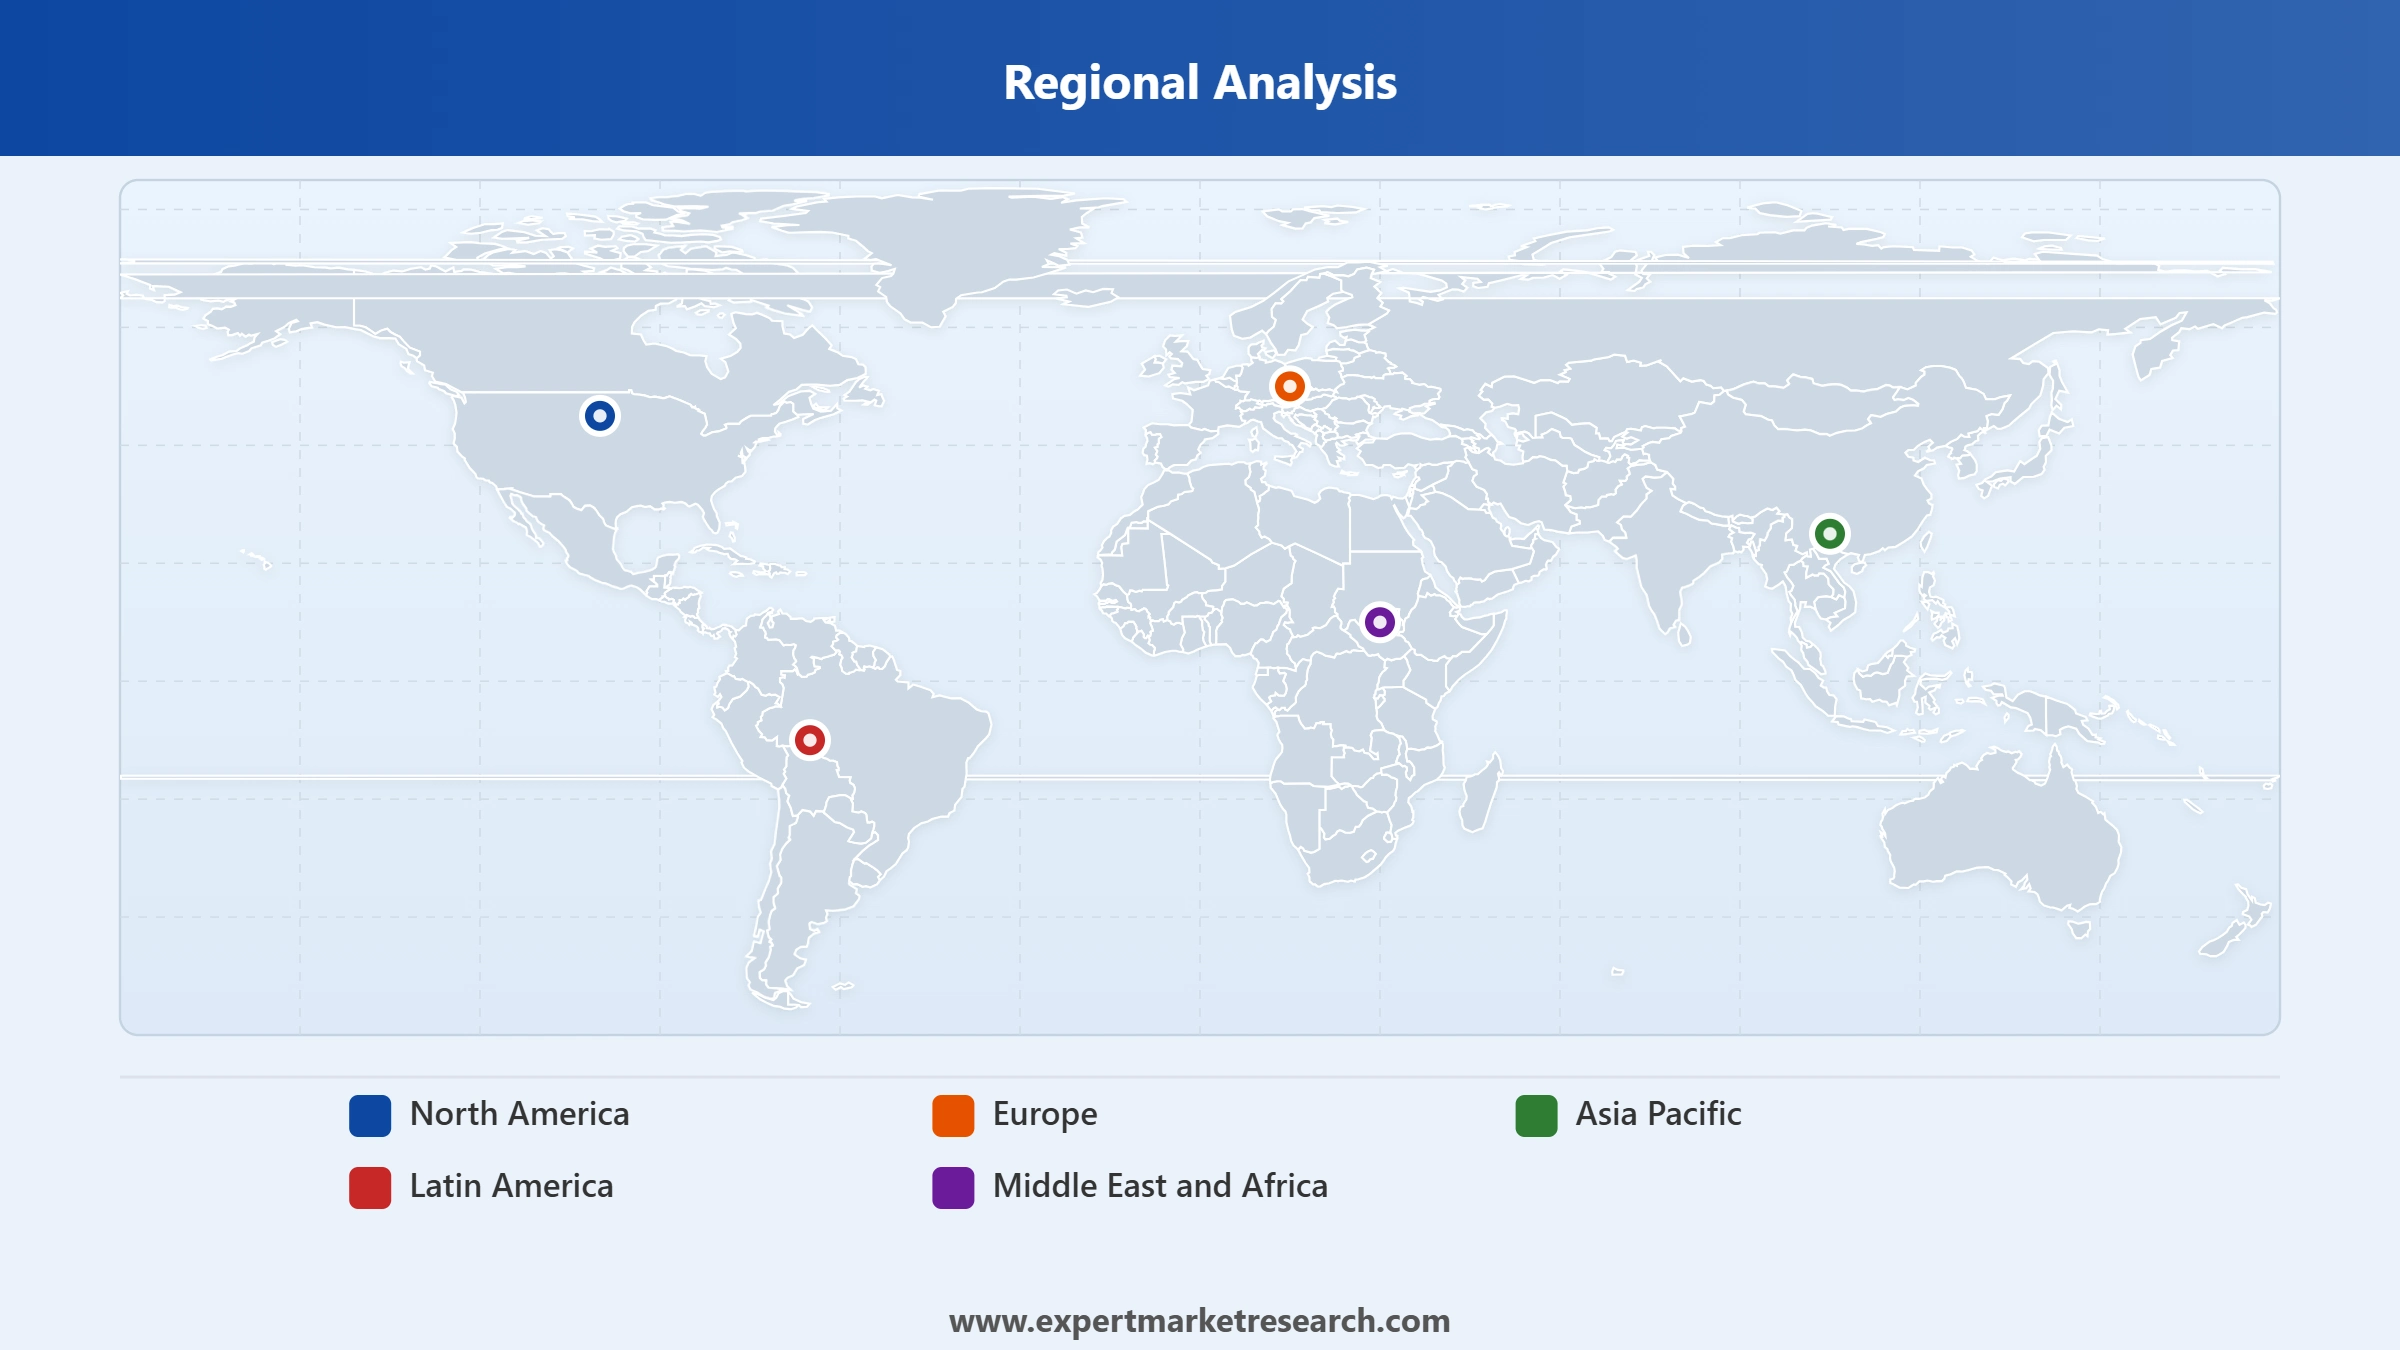
Key Insight: Asia Pacific dominates the market, supported by large populations, rapid urbanisation, and high smartphone adoption. North America is a strong, mature market, Europe grows steadily, and Latin America and the Middle East and Africa are fast-growing on rising app-based mobility adoption.


Read more about this report - REQUEST FREE SAMPLE COPY IN PDF
By Service Type, Ride Hailing dominates the market
Ride hailing commands the market, anchored by app-based, on-demand platforms that offer convenience, transparent pricing, cashless payment, and known driver identity. High smartphone penetration and a shift away from private vehicle ownership reinforce ride hailing as the core of the global taxi market.
Read more about this report - REQUEST FREE SAMPLE COPY IN PDF
Ride sharing grows on affordability and sustainability, with pooled rides appealing to cost-conscious and environmentally aware commuters. Electrification and autonomous technology further shape the service mix, as operators expand EV fleets and pilot robotaxi services to improve efficiency and reduce emissions across major cities.
By Booking Type, Online Booking leads and grows fastest
Online booking leads the market, driven by smartphones, ride-hailing apps, cashless payments, GPS tracking, and real-time analytics. The convenience, transparency, and reliability of digital booking continue to convert traditional trips into e-hailing, cementing online channels at the centre of the global taxi market.

Read more about this report - REQUEST FREE SAMPLE COPY IN PDF
Offline booking, including street-hailing and phone bookings, persists in certain regions and traditional segments, supported by established taxi fleets and customers with limited digital access. However, its share steadily declines as operators and governments accelerate the shift toward digital e-hailing worldwide.
By Vehicle Type, Cars hold the leading share
Cars lead the market, valued for comfort, passenger capacity, and broad applicability across ride hailing, ride sharing, and airport and intercity travel. Fleet electrification is rising within the car segment, as operators adopt electric and hybrid vehicles to meet sustainability goals and reduce operating costs.
Read more about this report - REQUEST FREE SAMPLE COPY IN PDF
Motorcycle and two-wheeler taxis grow fast in congested urban centres, particularly across Asia Pacific, offering quick and affordable mobility. Other vehicle types, including auto-rickshaws, vans, and emerging eVTOL air taxis, broaden the mobility mix and address diverse commuting needs in the global taxi market.
Asia Pacific dominates while North America remains a strong market
Asia Pacific dominates the global taxi market, anchored by large populations, rapid urbanisation, and high smartphone penetration across China, India, ASEAN, Japan, and Australia. Strong adoption of app-based mobility, dense metropolitan travel demand, and the rise of two-wheeler taxis sustain Asia Pacific's leading position in the global market.
North America remains a strong, mature market, supported by high digital payment adoption, disposable incomes, and consumer preference for convenience-based mobility across the United States and Canada. Europe grows steadily, while Latin America and the Middle East and Africa are fast-growing on rising adoption, expanding the depth of the global taxi market.
Read more about this report - REQUEST FREE SAMPLE COPY IN PDF
The global taxi market is competitive and fragmented, combining global ride-hailing platforms with strong regional operators. Leading players include Uber Technologies, ANI Technologies (Ola), Bolt Technology, and Lyft, alongside Curb Mobility, Dubai Taxi Company, Flywheel Software, Free Now, Nihon Kotsu, and Roppen Transportation Services (Rapido).
Competition centres on technology, pricing, coverage, and service quality. Leading players invest in app-based platforms, fleet electrification, autonomous and two-wheeler mobility, and strategic partnerships and acquisitions, while urbanisation, sustainability, and regulation reshape strategy across the global taxi market.
Headquartered in San Francisco, United States, Uber is the world's largest ride-hailing platform, operating across approximately 70 countries. Its portfolio spans ride-hailing, delivery through Uber Eats, and freight, supported by strong technology, fleet electrification, and continuous expansion across the global taxi market.
Headquartered in Bengaluru, India, ANI Technologies operates Ola, a leading ride-hailing platform in India. Its services span cabs, auto-rickshaws, and bike taxis, supported by a strong domestic network, electric mobility initiatives, and a focus on affordable, app-based urban transportation across Indian cities.
Headquartered in Tallinn, Estonia, Bolt is a leading mobility platform offering ride-hailing, micro-mobility, and food delivery. With a strong footprint across Europe, Africa, and the Middle East, including partnerships in the United Arab Emirates, Bolt serves millions of customers with app-based, affordable mobility services.
Headquartered in San Francisco, United States, Lyft is a leading ride-hailing platform in the United States and Canada. Following its acquisition of Free Now, Lyft has expanded into Europe. Its services span ride-hailing, shared rides, and micro-mobility, supported by technology-driven, convenience-focused mobility solutions.
Other key players in the market include Curb Mobility, LLC, Dubai Taxi Company, Flywheel Software, Inc., Free Now, Nihon Kotsu Co., Ltd., Roppen Transportation Services Private Limited, and others.
*Please note that this is only a partial list; the complete list of key players is available in the full report. Additionally, the list of key players can be customized to better suit your needs.*
Our full report for 2026-2035 provides the demand analysis, service type, booking type, vehicle type, and regional segmentation, and competitive benchmarking to navigate the global taxi market with confidence. Reach out to our team to access the complete report or request a customised version.
Electric Vehicle (EV) Taxi Market
Advanced Driver Assistance Systems Trends
Autonomous Vehicle Technology Analysis
EV Charging Infrastructure Industry Outlook
Upto 15% Off
USD
$2499 $2249
$3999 $3599
$4999 $4249
$5999 $5099


*While we strive to always give you current and accurate information, the numbers depicted on the website are indicative and may differ from the actual numbers in the main report. At Expert Market Research, we aim to bring you the latest insights and trends in the market. Using our analyses and forecasts, stakeholders can understand the market dynamics, navigate challenges, and capitalize on opportunities to make data-driven strategic decisions.*
In 2025, the market reached an approximate value of USD 280.86 Billion.
The market is projected to grow at a CAGR of 11.10% between 2026 and 2035.
The market is estimated to witness a healthy growth in the forecast period of 2026-2035 to reach USD 804.69 Billion by 2035.
Key strategies driving the market include expansion of app-based ride-hailing, adoption of electric and autonomous vehicles, strategic partnerships, micro-mobility integration, and AI-driven route optimization.
Key trends aiding the market expansion include the technological advancements, such as ride-hailing apps and digital payment systems, adoption of electric and hybrid taxis, and expansion of taxi services into package delivery.
Regions considered in the market are North America, Europe, Asia Pacific, Latin America, and Middle East and Africa.
Based on service type, the market segmentations include ride hailing, ride sharing.
Cars, motorcycle, and others are considered in the report.
The key players in the market include Uber Technologies Inc., ANI Technologies Private Limited, Bolt Technology OÜ, Curb Mobility, LLC, Dubai Taxi Company, Flywheel Software, Inc., Free Now, Lyft, Inc., Nihon Kotsu Co., Ltd., Roppen Transportation Services Private Limited, and others.
Asia Pacific accounts for the biggest revenue share due to rapid urbanization, high smartphone penetration, growing disposable incomes, and strong adoption of sustainable transport solutions.
Explore our key highlights of the report and gain a concise overview of key findings, trends, and actionable insights that will empower your strategic decisions.
| REPORT FEATURES | DETAILS |
| Base Year | 2025 |
| Historical Period | 2019-2025 |
| Forecast Period | 2026-2035 |
| Scope of the Report |
Historical and Forecast Trends, Industry Drivers and Constraints, Historical and Forecast Market Analysis by Segment:
|
| Breakup by Service Type |
|
| Breakup by Booking Type |
|
| Breakup by Vehicle Type |
|
| Breakup by Region |
|
| Market Dynamics |
|
| Competitive Landscape |
|
| Companies Covered |
|
Datasheet
One User
USD 2,499
USD 2,249
tax inclusive*
Single User License
One User
USD 3,999
USD 3,599
tax inclusive*
Five User License
Five User
USD 4,999
USD 4,249
tax inclusive*
Corporate License
Unlimited Users
USD 5,999
USD 5,099
tax inclusive*
*Please note that the prices mentioned below are starting prices for each bundle type. Kindly contact our team for further details.*
Flash Bundle
Small Business Bundle
Growth Bundle
Enterprise Bundle
*Please note that the prices mentioned below are starting prices for each bundle type. Kindly contact our team for further details.*
Flash Bundle
Number of Reports: 3
20%
tax inclusive*
Small Business Bundle
Number of Reports: 5
25%
tax inclusive*
Growth Bundle
Number of Reports: 8
30%
tax inclusive*
Enterprise Bundle
Number of Reports: 10
35%
tax inclusive*
How To Order

Select License Type
Choose the right license for your needs and access rights.

Click on ‘Buy Now’
Add the report to your cart with one click and proceed to register.

Select Mode of Payment
Choose a payment option for a secure checkout. You will be redirected accordingly.
Strategic Solutions for Informed Decision-Making
Gain insights to stay ahead and seize opportunities.

Get insights & trends for a competitive edge.

Track prices with detailed trend reports.

Analyse trade data for supply chain insights.

Leverage cost reports for smart savings

Enhance supply chain with partnerships.

Connect For More Information
Our expert team of analysts will offer full support and resolve any queries regarding the report, before and after the purchase.
Our expert team of analysts will offer full support and resolve any queries regarding the report, before and after the purchase.
We employ meticulous research methods, blending advanced analytics and expert insights to deliver accurate, actionable industry intelligence, staying ahead of competitors.
Our skilled analysts offer unparalleled competitive advantage with detailed insights on current and emerging markets, ensuring your strategic edge.
We offer an in-depth yet simplified presentation of industry insights and analysis to meet your specific requirements effectively.


