Sale

Telecom Power Systems Market

Global Telecom Power Systems Market Size, Share, Forecast: By Product Type: DC, AC; By Component: Rectifiers, Converters, Controllers, Heat Management Systems, Generators, Others; By Power Source: Diesel-Battery, Diesel-Solar, Diesel-Wind, Multiple Sources; By Grid Type; Regional Analysis; Competitive Landscape; 2024-2032

Global Telecom Power Systems Market Size

The global telecom power systems market value was around USD 4.88 billion in 2023. The market is further expected to grow at a CAGR of 9.90% over the forecast period of 2024-2032 to attain a value of USD 11.39 billion by 2032.


Global Telecom Power Systems Market Report Summary Description Value
Base Year USD Billion 2023
Historical Period USD Billion 2018-2023
Forecast Period USD Billion 2024-2032
Market Size 2023 USD Billion 4.88
Market Size 2032 USD Billion 11.39
CAGR 2018-2023 Percentage XX%
CAGR 2024-2032 Percentage 9.90%
CAGR 2024-2032 - Market by Region Asia Pacific 12.8%
CAGR 2024-2032 - Market by Country India 14.7%
CAGR 2024-2032 - Market by Country Saudi Arabia 11.2%
CAGR 2024-2032 - Market by Power Source Diesel-Solar 10.9%
CAGR 2024-2032 - Market by Component Rectifiers 11.3%
Market Share by Country 2023 USA 18.2%


Global Telecom Power Systems Market Growth

The global market for telecom power systems is being driven by the growing demand for faster network services and increasing penetration of smartphones and the internet across the globe. With the rise in the number of smartphone and internet users, the demand for advanced network services, including 4G and VoLTE is also growing, which is leading to a rise in installation of telecom power systems.


According to the telecom power systems industry analysis, the rapid advancement in technology, growing global population, and rising disposable incomes in emerging nations are the factors that will contribute to the market growth.


Moreover, key industry players are increasingly investing in R&D activities to deliver efficient services to customers, which is expected to accelerate the demand for telecom power systems worldwide. The market players are developing power systems with enhanced flexibility, smarter energy control, improved monitoring standards, and high power density. Although most telecom systems are powered by grids, manufacturers are innovating these systems that can further operate with the help of renewable energy sources like solar and wind, which is expected to drive the telecom power systems demand growth.


Global Telecom Power Systems Market

Read more about this report - REQUEST FREE SAMPLE COPY IN PDF


Industry Outlook

Diesel-Battery Systems

USA:

  • Market Growth: Steady growth with an estimated CAGR of 6-7% from 2018 to 2023 in critical sectors like healthcare, telecom, and data centers.

China:

  • Market Dynamics: Robust growth with an estimated CAGR of 8-9%, driven by government initiatives for emissions reduction and energy security.

India:

  • Deployment and adoption on new systems, supported by favourable government policies, to positively impact the growth of the telecom power systems industry: Significant expansion in rural electrification projects with a growth rate of 7-8% from 2018 to 2023 due to increasing energy demands and unreliable grid infrastructure.


Diesel-Solar Systems

USA:

  • Market Expansion: Considerable adoption in remote and military applications, growing at a CAGR of about 7% from 2018 to 2023.

China:

  • Technological Advancements: Significant growth with an estimated CAGR of 10%, particularly in industrial and agricultural sectors.

India:

  • Government Initiatives: Crucial for rural electrification, growing at a rate of approximately 9-10% annually, supported by government subsidies and incentives.


Diesel-Wind Systems

USA:

  • Implementation: Limited but growing use, especially in coastal and island regions, with a growth rate of 5-6% from 2018 to 2023.

China:

  • Growth Factors: The growth of the telecom power systems market in China is supported by vast wind resources and the need for reliable energy source in remote areas.

India:

  • Adoption: Slow expansion focusing on coastal regions, with a growth rate of about 6-7% annually from 2018 to 2023.


Multiple Sources (Hybrid Systems)

USA:

  • Diverse Applications: Robust growth driven by the need for resilient power solutions, with a growth rate of 8-9% from 2018 to 2023.

China:

  • Integration and Innovation: Significant adoption in industrial and residential sectors, with an estimated CAGR of 10-11%.

India:

  • Market Expansion: Substantial increase in rural and off-grid applications, with a growth rate of 9-10% from 2018 to 2023, supported by favorable government policies and incentives.


Recent Developments

In May 2024, the Site Power Facility Domain of Huawei Digital Power launched the All-Scenario Smart Telecom Power Solutions, featuring modular design, intelligent circuit breakers, and rectifier with 98% efficiency, aimed at meeting operators' requirement for "one-time deployment” and the evolution of ten-years.


Key Drivers Shaping the Telecom Power Systems Market

  • Continuous expansion of telecommunications infrastructure drives strong demand for power systems.
  • Innovations in power system technologies improve efficiency and reliability, which is expected to further increase the telecom power systems market revenue.
  • Telecom power systems are essential for maintaining uninterrupted communication services.
  • Wide range of applications in urban, rural, and remote areas.
  • Collaboration with telecom providers and equipment manufacturers strengthens market presence.


Global Telecom Power Systems Industry Trends

  • Growing telecom infrastructure in emerging markets offers significant growth potential.
  • Increasing adoption of renewable energy sources for telecom power systems.
  • Rapid deployment of 5G networks requires advanced and efficient power solutions.
  • Integration of smart grid technologies enhances system management and efficiency.
  • Supportive government policies and investments in telecom infrastructure development will likely positively influence the telecom power systems demand forecast.


Major Challenges in Implementing Telecom Power Systems Worldwide

  • Significant capital expenditure required for deployment and maintenance.
  • Integrating power systems with existing telecom infrastructure can be challenging.
  • Reliance on consistent and reliable energy sources for optimal performance.
  • Managing environmental impact and meeting regulatory standards can be demanding.
  • Lower awareness and adoption rates in some developing markets.


Risks in the Global Telecom Power Systems Market

  • Economic instability can affect investment in telecom infrastructure and power systems.
  • High competition among market players can lead to price wars and reduced profit margins.
  • Rapid technological changes may render existing systems obsolete, which can have a negative impact on the growth of the telecom power systems industry. 
  • Vulnerability to global supply chain disruptions affecting component availability.
  • Strict regulatory requirements and compliance issues in different regions.


Market Competition Among Telecom Power Systems Providers

The global telecom power systems market is characterized by intense competition among major players such as Huawei, Delta Electronics, Eaton, Vertiv, Schneider Electric, ABB, among others.


Leading companies offer a wide range of telecom power systems, leveraging strong research and development capabilities to introduce innovative and efficient power solutions.


  • Customized power solutions for edge computing and 5G deployment.
  • Integration of smart technologies and IoT for enhanced performance.
  • Cutting-edge technology to improve energy efficiency and system reliability.
  • Advanced power solutions for effective power management.
  • Competitive pricing to attract larger market share.
  • Cost-effective solutions for cost-sensitive regions without quality compromise.
  • Integrated power solutions tailored to telecom operator requirements.
  • Focus on emerging markets in Asia-Pacific and Latin America.
  • Robust solutions for growing telecom infrastructure and strong distribution networks.
  • Adherence to international and regional regulatory standards.
  • Integration of renewable energy sources for eco-friendly power solutions is expected to support the telecom power systems market dynamics and trends.


Key Pricing Indicators for Telecom Power Systems

  • Price and availability of metals, plastics, and electronic components influence costs.
  • Innovations drive initial costs up but lead to long-term savings.
  • Economies of scale reduce per-unit costs with larger volumes.
  • Manufacturing and operational energy costs impact overall pricing.
  • Regional variations in skilled labor costs affect final prices.
  • Shipping and handling fees contribute to final pricing, especially for global distribution.
  • Meeting standards adds costs due to specialized materials and processes.
  • Intense competition results in aggressive pricing strategies.
  • Customized solutions come at a premium due to additional costs.


Telecom Power Systems Market By Power Source

Read more about this report - REQUEST FREE SAMPLE COPY IN PDF


Telecom Power Systems Industry Segmentation


On the basis of product type, the market can be divided into:

  • DC
  • AC


CAGR 2024-2032 - Market by Power Source
Diesel-Solar 10.9%
Diesel-Wind 10.5%
Diesel-Battery XX%
Multiple Sources XX%


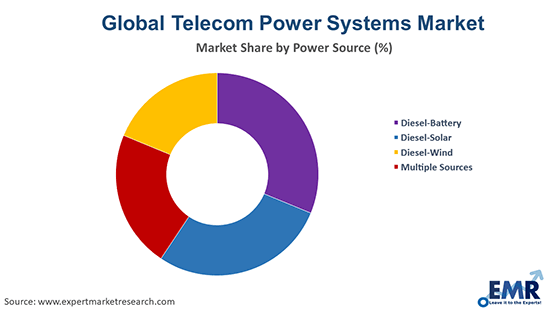
Based on the power source, the market is divided into:

  • Diesel-Battery
  • Diesel-Solar
  • Diesel-Wind 
  • Multiple Sources 


On the basis of grid-type, the market is categorised into:

  • On Grid
  • Off Grid
  • Bad Grid


CAGR 2024-2032 - Market by Component
Rectifiers 11.3%
Converters 10.6%
Controllers 10.2%
Heat Management Systems XX%
Generators XX%
Others XX%


Based on component, the market has been segmented into:

  • Rectifiers
  • Converters
  • Controllers
  • Heat Management Systems
  • Generators
  • Others


CAGR 2024-2032 - Market by Region
Asia Pacific 12.8%
Middle East and Africa 10.7%
North America 8.2%
Europe XX%
Latin America XX%


The report also covers key regional markets, which are:

  • North America
  • Europe
  • Asia Pacific
  • Latin America
  • Middle East and Africa


Telecom Power Systems Market Share


Market Share by Country
USA 18%
Canada XX%
UK XX%
Germany XX%


The direct current systems segment, among various product types, leads the telecom power systems market, accounting for the largest share. Currently, diesel-batteries are one of the most preferred source-types among consumers. Amongst various components, rectifiers dominate the market for telecom power systems, holding the largest share. Further, the growing demand for telecom power systems in bad grid areas, aiming to fulfill the requirements of mobile subscribers, is supporting the market growth.


Telecom Power Systems Market by Region

Read more about this report - REQUEST FREE SAMPLE COPY IN PDF


Global Telecom Power Systems Market Regional Insight

Region-wise, the Asia Pacific is the leading market for telecom power systems, accounting for a significant share. The major factors driving the market growth in the region include the growing internet and smartphone penetration and the presence of a large population in the region. Telecom power systems offer a stable electricity supply to telecom towers in case of fluctuations or interruptions in grid power, thus, forming an essential part of communication networks. They help in the maintenance of a number of services like fixed-lines and high-speed internet data.


The growing demand for telecom services, particularly in emerging regions such as Asia and the Middle East and Africa, is expected to further increase the telecom power systems market opportunities in the forecast period.


CAGR 2024-2032 - Market by Country
India 14.7%
China 12.3%
Saudi Arabia 11.2%
Canada 9.3%
Australia 8.7%
USA XX%
UK XX%
Germany XX%
France XX%
Italy XX%
Japan XX%
Brazil XX%
Mexico XX%


Competitive Landscape

The report gives a detailed analysis of the following key players in the global telecom power systems market, covering their competitive landscape and latest developments like mergers and acquisitions and product launches:


  • Delta Electronics, Inc.
  • Eaton Corporation plc
  • Huawei Technologies Co., Ltd.
  • ABB Group
  • Cummins Inc.
  • Schneider Electric
  • ABB Ltd.
  • ZTE Corporation
  • GE Vernova Group
  • Nokia Corporation
  • Telefonaktiebolaget LM Ericsson
  • Flexenclosure AB
  • Others


The comprehensive EMR report provides an in-depth assessment of the market based on the Porter's five forces model along with giving a SWOT analysis.


Key Highlights of the Report

REPORT FEATURES DETAILS
Base Year 2023
Historical Period 2018-2023
Forecast Period 2024-2032
Scope of the Report

Historical and Forecast Trends, Industry Drivers and Constraints, Historical and Forecast Market Analysis by Segment:

  • Product Type
  • Component
  • Power Source
  • Grid Type
  • Region
Breakup by Product Type
  • DC
  • AC
Breakup by Component
  • Rectifiers
  • Converters
  • Controllers
  • Heat Management Systems
  • Generators
  • Others
Breakup by Power Source
  • Diesel-Battery
  • Diesel-Solar
  • Diesel-Wind
  • Multiple Sources
Breakup by Grid Type
  • On Grid
  • Off Grid
  • Bad Grid
Breakup by Region
  • North America
    • United States of America 
    • Canada
  • Europe
    • United Kingdom
    • Germany
    • France
    • Italy
    • Others
  • Asia Pacific
    • China
    • Japan
    • India
    • ASEAN
    • Australia
    • Others
  • Latin America
    • Brazil
    • Argentina
    • Mexico
    • Others
  • Middle East and Africa
    • Saudi Arabia
    • United Arab Emirates
    • Nigeria
    • South Africa
    • Others
Market Dynamics
  • SWOT Analysis
  • Porter's Five Forces Analysis
  • Key Indicators for Demand
  • Key Indicators for Price
Competitive Landscape
  • Market Structure
  • Company Profiles
    • Company Overview
    • Product Portfolio
    • Demographic Reach and Achievements
    • Certifications
Companies Covered
  • Delta Electronics, Inc.
  • Eaton Corporation plc
  • Huawei Technologies Co., Ltd.
  • ABB Group
  • Cummins Inc.
  • Schneider Electric
  • ABB Ltd.
  • ZTE Corporation
  • GE Vernova Group
  • Nokia Corporation
  • Telefonaktiebolaget LM Ericsson
  • Flexenclosure AB
  • Others
Report Price and Purchase Option Explore our purchase options that are best suited to your resources and industry needs.
Delivery Format Delivered as an attached PDF and Excel through email, with an option of receiving an editable PPT, according to the purchase option.


Telecom Power Systems Market Report Snapshots

Telecom Power Systems Market Size

Telecom Power Systems Market Growth

Telecom Power Systems Market Share

Telecom Power Systems Companies

Telecom Power Systems Market Regional Analysis


*While we strive to always give you current and accurate information, the numbers depicted on the website are indicative and may differ from the actual numbers in the main report. At Expert Market Research, we aim to bring you the latest insights and trends in the market. Using our analyses and forecasts, stakeholders can understand the market dynamics, navigate challenges, and capitalize on opportunities to make data-driven strategic decisions.

1    Preface
2    Report Coverage – Key Segmentation and Scope
3    Report Description

    3.1    Market Definition and Outlook
    3.2    Properties and Applications
    3.3    Market Analysis
    3.4    Key Players
4    Key Assumptions
5    Executive Summary

    5.1    Overview
    5.2    Key Drivers
    5.3    Key Developments
    5.4    Competitive Structure
    5.5    Key Industrial Trends
6    Snapshot
    6.1    Global
    6.2    Regional
7    Opportunities and Challenges in the Market
8    Global Telecom Power Systems Market Analysis

    8.1    Key Industry Highlights
    8.2    Global Telecom Power Systems Historical Market (2018-2023) 
    8.3    Global Telecom Power Systems Market Forecast (2024-2032)
    8.4    Global Telecom Power Systems Market by Product Type
        8.4.1    DC
            8.4.1.1    Historical Trend (2018-2023)
            8.4.1.2    Forecast Trend (2024-2032)
        8.4.2    AC
            8.4.2.1    Historical Trend (2018-2023)
            8.4.2.2    Forecast Trend (2024-2032)
    8.5    Global Telecom Power Systems Market by Component
        8.5.1    Rectifiers
            8.5.1.1    Historical Trend (2018-2023)
            8.5.1.2    Forecast Trend (2024-2032)
        8.5.2    Converters
            8.5.2.1    Historical Trend (2018-2023)
            8.5.2.2    Forecast Trend (2024-2032)
        8.5.3    Controllers
            8.5.3.1    Historical Trend (2018-2023)
            8.5.3.2    Forecast Trend (2024-2032)
        8.5.4    Heat Management Systems
            8.5.4.1    Historical Trend (2018-2023)
            8.5.4.2    Forecast Trend (2024-2032)
        8.5.5    Generators
            8.5.5.1    Historical Trend (2018-2023)
            8.5.5.2    Forecast Trend (2024-2032)
        8.5.6    Others
    8.6    Global Telecom Power Systems Market by Power Source
        8.6.1    Diesel-Battery
            8.6.1.1    Historical Trend (2018-2023)
            8.6.1.2    Forecast Trend (2024-2032)
        8.6.2    Diesel-Solar
            8.6.2.1    Historical Trend (2018-2023)
            8.6.2.2    Forecast Trend (2024-2032)
        8.6.3    Diesel-Wind
            8.6.3.1    Historical Trend (2018-2023)
            8.6.3.2    Forecast Trend (2024-2032)
        8.6.4    Multiple Sources
            8.6.4.1    Historical Trend (2018-2023)
            8.6.4.2    Forecast Trend (2024-2032)
    8.7    Global Telecom Power Systems Market by Grid Type
        8.7.1    On Grid
            8.7.1.1    Historical Trend (2018-2023)
            8.7.1.2    Forecast Trend (2024-2032)
        8.7.2    Off Grid
            8.7.2.1    Historical Trend (2018-2023)
            8.7.2.2    Forecast Trend (2024-2032)
        8.7.3    Bad Grid
            8.7.3.1    Historical Trend (2018-2023)
            8.7.3.2    Forecast Trend (2024-2032)
    8.8    Global Telecom Power Systems Market by Region
        8.8.1    North America
            8.8.1.1    Historical Trend (2018-2023)
            8.8.1.2    Forecast Trend (2024-2032)
        8.8.2    Europe
            8.8.2.1    Historical Trend (2018-2023)
            8.8.2.2    Forecast Trend (2024-2032)
        8.8.3    Asia Pacific
            8.8.3.1    Historical Trend (2018-2023)
            8.8.3.2    Forecast Trend (2024-2032)
        8.8.4    Latin America
            8.8.4.1    Historical Trend (2018-2023)
            8.8.4.2    Forecast Trend (2024-2032)
        8.8.5    Middle East and Africa
            8.8.5.1    Historical Trend (2018-2023)
            8.8.5.2    Forecast Trend (2024-2032)
9    North America Telecom Power Systems Market Analysis
    9.1    United States of America
        9.1.1    Historical Trend (2018-2023)
        9.1.2    Forecast Trend (2024-2032)
    9.2    Canada
        9.2.1    Historical Trend (2018-2023)
        9.2.2    Forecast Trend (2024-2032)
10    Europe Telecom Power Systems Market Analysis
    10.1    United Kingdom
        10.1.1    Historical Trend (2018-2023)
        10.1.2    Forecast Trend (2024-2032)
    10.2    Germany
        10.2.1    Historical Trend (2018-2023)
        10.2.2    Forecast Trend (2024-2032)
    10.3    France
        10.3.1    Historical Trend (2018-2023)
        10.3.2    Forecast Trend (2024-2032)
    10.4    Italy
        10.4.1    Historical Trend (2018-2023)
        10.4.2    Forecast Trend (2024-2032)
    10.5    Others
11    Asia Pacific Telecom Power Systems Market Analysis
    11.1    China
        11.1.1    Historical Trend (2018-2023)
        11.1.2    Forecast Trend (2024-2032)
    11.2    Japan
        11.2.1    Historical Trend (2018-2023)
        11.2.2    Forecast Trend (2024-2032)
    11.3    India
        11.3.1    Historical Trend (2018-2023)
        11.3.2    Forecast Trend (2024-2032)
    11.4    ASEAN
        11.4.1    Historical Trend (2018-2023)
        11.4.2    Forecast Trend (2024-2032)
    11.5    Australia
        11.5.1    Historical Trend (2018-2023)
        11.5.2    Forecast Trend (2024-2032)
    11.6    Others
12    Latin America Telecom Power Systems Market Analysis
    12.1    Brazil
        12.1.1    Historical Trend (2018-2023)
        12.1.2    Forecast Trend (2024-2032)
    12.2    Argentina
        12.2.1    Historical Trend (2018-2023)
        12.2.2    Forecast Trend (2024-2032)
    12.3    Mexico
        12.3.1    Historical Trend (2018-2023)
        12.3.2    Forecast Trend (2024-2032)
    12.4    Others
13    Middle East and Africa Telecom Power Systems Market Analysis
    13.1    Saudi Arabia
        13.1.1    Historical Trend (2018-2023)
        13.1.2    Forecast Trend (2024-2032)
    13.2    United Arab Emirates
        13.2.1    Historical Trend (2018-2023)
        13.2.2    Forecast Trend (2024-2032)
    13.3    Nigeria
        13.3.1    Historical Trend (2018-2023)
        13.3.2    Forecast Trend (2024-2032)
    13.4    South Africa
        13.4.1    Historical Trend (2018-2023)
        13.4.2    Forecast Trend (2024-2032)
    13.5    Others
14    Market Dynamics
    14.1    SWOT Analysis
        14.1.1    Strengths
        14.1.2    Weaknesses
        14.1.3    Opportunities
        14.1.4    Threats
    14.2    Porter’s Five Forces Analysis
        14.2.1    Supplier’s Power
        14.2.2    Buyer’s Power
        14.2.3    Threat of New Entrants
        14.2.4    Degree of Rivalry
        14.2.5    Threat of Substitutes
    14.3    Key Indicators for Demand
    14.4    Key Indicators for Price
15    Value Chain Analysis
16    Competitive  Landscape

    16.1    Market Structure
    16.2    Company Profiles
        16.2.1    Delta Electronics, Inc.
            16.2.1.1    Company Overview
            16.2.1.2    Product Portfolio
            16.2.1.3    Demographic Reach and Achievements
            16.2.1.4    Certifications
        16.2.2    Eaton Corporation plc
            16.2.2.1    Company Overview
            16.2.2.2    Product Portfolio
            16.2.2.3    Demographic Reach and Achievements
            16.2.2.4    Certifications
        16.2.3    Huawei Technologies Co., Ltd.
            16.2.3.1    Company Overview
            16.2.3.2    Product Portfolio
            16.2.3.3    Demographic Reach and Achievements
            16.2.3.4    Certifications
        16.2.4    ABB Group
            16.2.4.1    Company Overview
            16.2.4.2    Product Portfolio
            16.2.4.3    Demographic Reach and Achievements
            16.2.4.4    Certifications
        16.2.5    Cummins Inc.
            16.2.5.1    Company Overview
            16.2.5.2    Product Portfolio
            16.2.5.3    Demographic Reach and Achievements
            16.2.5.4    Certifications
        16.2.6    Schneider Electric
            16.2.6.1    Company Overview
            16.2.6.2    Product Portfolio
            16.2.6.3    Demographic Reach and Achievements
            16.2.6.4    Certifications
        16.2.7    ABB Ltd.
            16.2.7.1    Company Overview
            16.2.7.2    Product Portfolio
            16.2.7.3    Demographic Reach and Achievements
            16.2.7.4    Certifications
        16.2.8    ZTE Corporation
            16.2.8.1    Company Overview
            16.2.8.2    Product Portfolio
            16.2.8.3    Demographic Reach and Achievements
            16.2.8.4    Certifications
        16.2.9    GE Vernova Group
            16.2.9.1    Company Overview
            16.2.9.2    Product Portfolio
            16.2.9.3    Demographic Reach and Achievements
            16.2.9.4    Certifications
        16.2.10    Nokia Corporation
            16.2.10.1    Company Overview
            16.2.10.2    Product Portfolio
            16.2.10.3    Demographic Reach and Achievements
            16.2.10.4    Certifications
        16.2.11    Telefonaktiebolaget LM Ericsson
            16.2.11.1    Company Overview
            16.2.11.2    Product Portfolio
            16.2.11.3    Demographic Reach and Achievements
            16.2.11.4    Certifications
        16.2.12    Flexenclosure AB
            16.2.12.1    Company Overview
            16.2.12.2    Product Portfolio
            16.2.12.3    Demographic Reach and Achievements
            16.2.12.4    Certifications
        16.2.13    Others
17    Key Trends and Developments in the Market
 

List of Key Figures and Tables

1.    Global Telecom Power Systems Market: Key Industry Highlights, 2018 and 2032
2.    Global Telecom Power Systems Historical Market: Breakup by Product Type (USD Billion), 2018-2023
3.    Global Telecom Power Systems Market Forecast: Breakup by Product Type (USD Billion), 2024-2032
4.    Global Telecom Power Systems Historical Market: Breakup by Component (USD Billion), 2018-2023
5.    Global Telecom Power Systems Market Forecast: Breakup by Component (USD Billion), 2024-2032
6.    Global Telecom Power Systems Historical Market: Breakup by Power Source (USD Billion), 2018-2023
7.    Global Telecom Power Systems Market Forecast: Breakup by Power Source (USD Billion), 2024-2032
8.    Global Telecom Power Systems Historical Market: Breakup by Grid Type (USD Billion), 2018-2023
9.    Global Telecom Power Systems Market Forecast: Breakup by Grid Type (USD Billion), 2024-2032
10.    Global Telecom Power Systems Historical Market: Breakup by Region (USD Billion), 2018-2023
11.    Global Telecom Power Systems Market Forecast: Breakup by Region (USD Billion), 2024-2032
12.    North America Telecom Power Systems Historical Market: Breakup by Country (USD Billion), 2018-2023
13.    North America Telecom Power Systems Market Forecast: Breakup by Country (USD Billion), 2024-2032
14.    Europe Telecom Power Systems Historical Market: Breakup by Country (USD Billion), 2018-2023
15.    Europe Telecom Power Systems Market Forecast: Breakup by Country (USD Billion), 2024-2032
16.    Asia Pacific Telecom Power Systems Historical Market: Breakup by Country (USD Billion), 2018-2023
17.    Asia Pacific Telecom Power Systems Market Forecast: Breakup by Country (USD Billion), 2024-2032
18.    Latin America Telecom Power Systems Historical Market: Breakup by Country (USD Billion), 2018-2023
19.    Latin America Telecom Power Systems Market Forecast: Breakup by Country (USD Billion), 2024-2032
20.    Middle East and Africa Telecom Power Systems Historical Market: Breakup by Country (USD Billion), 2018-2023
21.    Middle East and Africa Telecom Power Systems Market Forecast: Breakup by Country (USD Billion), 2024-2032
22.    Global Telecom Power Systems Market Structure

Key Questions Answered in the Report

In 2023, the market reached an approximate value of USD 4.88 billion.

The market for telecom power systems is expected to grow at a CAGR of 9.90% between 2024 and 2032.

The market for telecom power systems is estimated to witness a healthy growth in the forecast period of 2024-2032 to reach USD 11.39 billion by 2032.

The major drivers of the market are rising disposable incomes, increasing demand for faster network services, growing penetration of internet and smartphones, and rising research and development activities.

Key trends aiding the market expansion include the rapid deployment of 5G networks, integration of smart grid technologies, and supportive government policies.

North America, Europe, the Asia Pacific, Latin America, and the Middle East and Africa are the significant markets for telecom power systems.

The various product types of telecom power systems in the market are DC and AC.

The leading power sources in the market are diesel-battery, diesel-solar, diesel-wind, and multiple sources.

The major grid-types in the market are bad grid, on grid, and off grid.

The various components of telecom power systems in the market are rectifiers, converters, controllers, heat management systems, and generators, among others.

Key players in the market are Delta Electronics, Inc., Eaton Corporation plc, Huawei Technologies Co., Ltd., ABB Group, Cummins Inc., Schneider Electric, ABB Ltd., ZTE Corporation, GE Vernova Group, Nokia Corporation, Telefonaktiebolaget LM Ericsson, Flexenclosure AB and among others.

The telecom power systems demand is being driven by the rise in the number of smartphone users, coupled with the growing demand for faster network services.

Significant capital expenditure required for deployment and maintenance, complexities associated with integrating power systems with existing telecom infrastructure, and stringent regulatory guidelines are the key challenges in the market.

Purchase Full Report

Datasheet

$ 2199     $1999
  • Selected Sections, One User
  • Printing Not Allowed
  • Email Delivery in PDF
  • Free Limited Customisation
  • Post Sales Analyst Support
  • 50% Discount on Next Update

Single User License

$ 3299     $2999
  • All Sections, One User
  • One Print Allowed
  • Email Delivery in PDF
  • Free Limited Customisation
  • Post Sales Analyst Support
  • 50% Discount on Next Update
most popular

Five User License

$ 4399     $3999
  • All Sections, Five Users
  • Five Prints Allowed
  • Email Delivery in PDF
  • Free Limited Customisation
  • Post Sales Analyst Support
  • 50% Discount on Next Update

Corporate License

$ 5499     $4999
  • All Sections, Unlimited Users
  • Unlimited Prints Allowed
  • Email Delivery in PDF + Excel
  • Free Limited Customisation
  • Post Sales Analyst Support
  • 50% Discount on Next Update

Any Question? Speak With An Analyst

Contact Analyst

View A Sample

Request Sample

Did You Miss Anything, Ask Now

Request Customisation
Why Expert Market Research?

Right People

We are technically excellent, strategic, practical, experienced and efficient; our analysts are hand-picked based on having the right attributes to work successfully and execute projects based on your expectations.

Right Methodology

We leverage our cutting-edge technology, our access to trusted databases, and our knowledge of the current models used in the market to deliver you research solutions that are tailored to your needs and put you ahead of the curve.

Right Price

We deliver in-depth and superior quality research in prices that are reasonable, unmatchable, and shows our understanding of your resource structure. We, additionally, offer attractive discounts on our upcoming reports.

Right Support

Our team of expert analysts are at your beck and call to deliver you optimum results that are customised to meet your precise needs within the specified timeframe and help you form a better understanding of the industry.

NEWSLETTER