

Consumer Insights
Uncover trends and behaviors shaping consumer choices today
Procurement Insights
Optimize your sourcing strategy with key market data
Industry Stats
Stay ahead with the latest trends and market analysis.
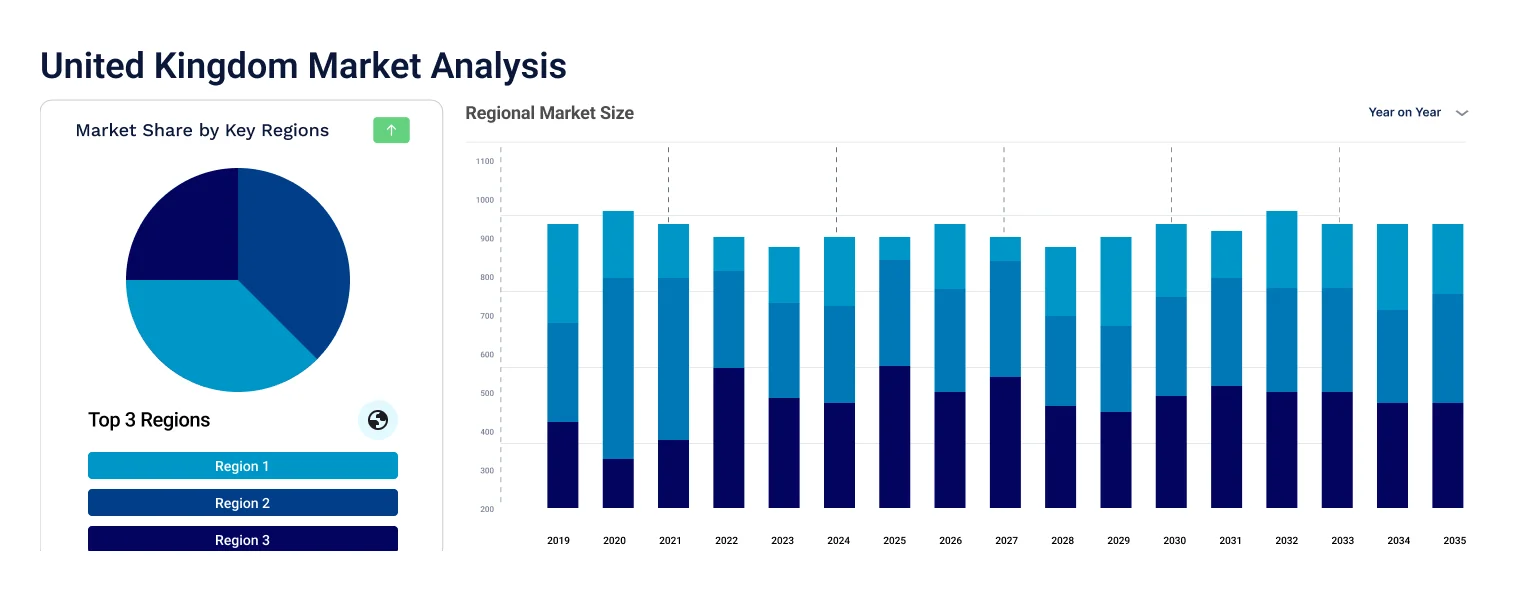
The United Kingdom power rental market size reached approximately USD 819.48 Million in 2025. The market is projected to grow at a CAGR of 3.60% between 2026 and 2035, reaching a value of around USD 1167.17 Million by 2035.
Sustainable backup power is gaining traction as it helps in reducing carbon emissions and combat climate change.
The electrification of various end-use sectors in the UK such as manufacturing and construction is increasing the demand for power backups, at a significant rate.
During October–December 2023, the manufacturing sector of the UK accounted for 9.3% of total UK economic output (Gross Value Added).
Compound Annual Growth Rate
3.6%
Value in USD Million
2026-2035
The United Kingdom power rental market is being driven by the expanding manufacturing sector. With an annual output of about GBP 183 billion, the UK stands as the ninth-largest manufacturing nation in the world. Manufacturing processes greatly rely on electricity, hence consistent power is key to the facilities. Power generators have gained traction as an indispensable backup solution, safeguarding organisations and manufacturing facilities from unexpected outages and ensuring uninterrupted productivity.
Renting diesel generators provides cost efficiency as they reduce maintenance costs as compared to regular generators. Diesel generators are developed to withstand higher power loads and can operate for longer periods, making them durable and reliable. Furthermore, the fuel efficiency offered by diesel generators and lower expenses are increasing its adoption significantly, thereby supporting the United Kingdom power rental market growth.
Reportedly, the construction volume output from June 2022 to June 2023 in Northern Ireland increased by 7.8% year on year. The growth was majorly driven by repair and maintenance work, which in 2023 witnessed a year-on-year increase of 17%. The frequent occurrences of power outages in various parts of the UK including Northern Ireland and England due to severe storms and other climatic conditions are necessitating the adoption of power backups.
"United Kingdom Power Rental Market Report and Forecast 2026-2035" offers a detailed analysis of the market based on the following segments:
Market Breakup by Fuel Type
Market Breakup by Rating
Market Breakup by Application
Market Breakup by End Use
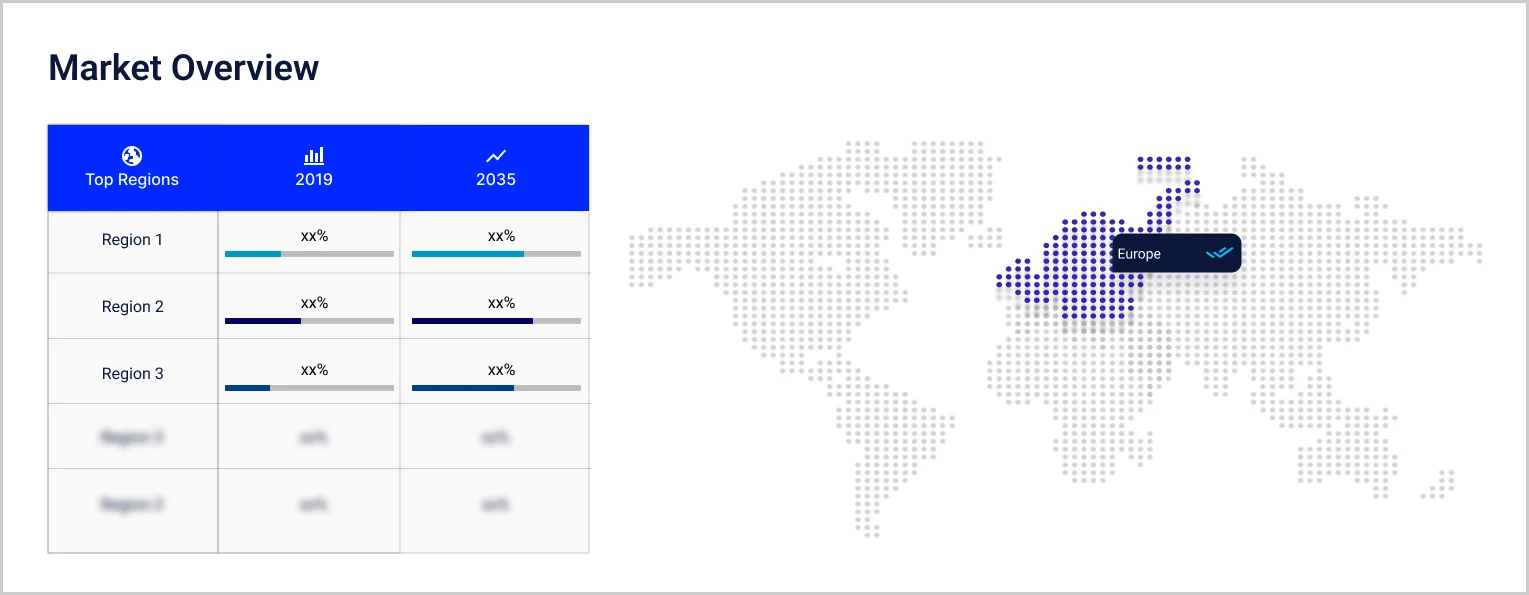
Market Breakup by Region
Companies are increasingly providing power rental solutions with alternate renewable fuels as part of the country’s transition towards net zero economy.
Upto 15% Off
USD
$2499 $2249
$3999 $3599
$4999 $4249
$5999 $5099


*While we strive to always give you current and accurate information, the numbers depicted on the website are indicative and may differ from the actual numbers in the main report. At Expert Market Research, we aim to bring you the latest insights and trends in the market. Using our analyses and forecasts, stakeholders can understand the market dynamics, navigate challenges, and capitalize on opportunities to make data-driven strategic decisions.*
The market reached a value of approximately USD 819.48 Million in 2025.
The market is estimated to grow at a CAGR of 3.60% between 2026 and 2035.
The market is estimated to witness a healthy growth during 2026-2035 to reach around USD 1167.17 Million by 2035.
The growth of the power rental market in the United Kingdom is due to the expansion of the manufacturing and construction sector, the electrification of industries, and the occurrences of power outages.
The major end uses are utilities, oil and gas, events, construction, mining, manufacturing, data centres, and others.
The different fuel types for power rentals are diesel, gas, and alternative fuel.
The key markets include England, Wales, Scotland, and Northern Ireland.
The major players in the market are Atlas Copco AB, Aggreko Ltd, Ashtead Group plc, Caterpillar Inc, Cummins Inc, LOXAM Group, Johnson Controls International Plc, United Rentals, Inc, Stuart Power Ltd, and Finning International Inc, among others.
Explore our key highlights of the report and gain a concise overview of key findings, trends, and actionable insights that will empower your strategic decisions.
| REPORT FEATURES | DETAILS |
| Base Year | 2025 |
| Historical Period | 2019-2025 |
| Forecast Period | 2026-2035 |
| Scope of the Report |
Historical and Forecast Trends, Industry Drivers and Constraints, Historical and Forecast Market Analysis by Segment:
|
| Breakup by Fuel Type |
|
| Breakup by Rating |
|
| Breakup by Application |
|
| Breakup by End Use |
|
| Breakup by Region |
|
| Market Dynamics |
|
| Competitive Landscape |
|
| Companies Covered |
|
Datasheet
One User
USD 2,499
USD 2,249
tax inclusive*
Single User License
One User
USD 3,999
USD 3,599
tax inclusive*
Five User License
Five User
USD 4,999
USD 4,249
tax inclusive*
Corporate License
Unlimited Users
USD 5,999
USD 5,099
tax inclusive*
*Please note that the prices mentioned below are starting prices for each bundle type. Kindly contact our team for further details.*
Flash Bundle
Small Business Bundle
Growth Bundle
Enterprise Bundle
*Please note that the prices mentioned below are starting prices for each bundle type. Kindly contact our team for further details.*
Flash Bundle
Number of Reports: 3
20%
tax inclusive*
Small Business Bundle
Number of Reports: 5
25%
tax inclusive*
Growth Bundle
Number of Reports: 8
30%
tax inclusive*
Enterprise Bundle
Number of Reports: 10
35%
tax inclusive*
How To Order

Select License Type
Choose the right license for your needs and access rights.

Click on ‘Buy Now’
Add the report to your cart with one click and proceed to register.

Select Mode of Payment
Choose a payment option for a secure checkout. You will be redirected accordingly.
Strategic Solutions for Informed Decision-Making
Gain insights to stay ahead and seize opportunities.

Get insights & trends for a competitive edge.

Track prices with detailed trend reports.

Analyse trade data for supply chain insights.

Leverage cost reports for smart savings

Enhance supply chain with partnerships.

Connect For More Information
Our expert team of analysts will offer full support and resolve any queries regarding the report, before and after the purchase.
Our expert team of analysts will offer full support and resolve any queries regarding the report, before and after the purchase.
We employ meticulous research methods, blending advanced analytics and expert insights to deliver accurate, actionable industry intelligence, staying ahead of competitors.
Our skilled analysts offer unparalleled competitive advantage with detailed insights on current and emerging markets, ensuring your strategic edge.
We offer an in-depth yet simplified presentation of industry insights and analysis to meet your specific requirements effectively.


