

Consumer Insights
Uncover trends and behaviors shaping consumer choices today
Procurement Insights
Optimize your sourcing strategy with key market data
Industry Stats
Stay ahead with the latest trends and market analysis.
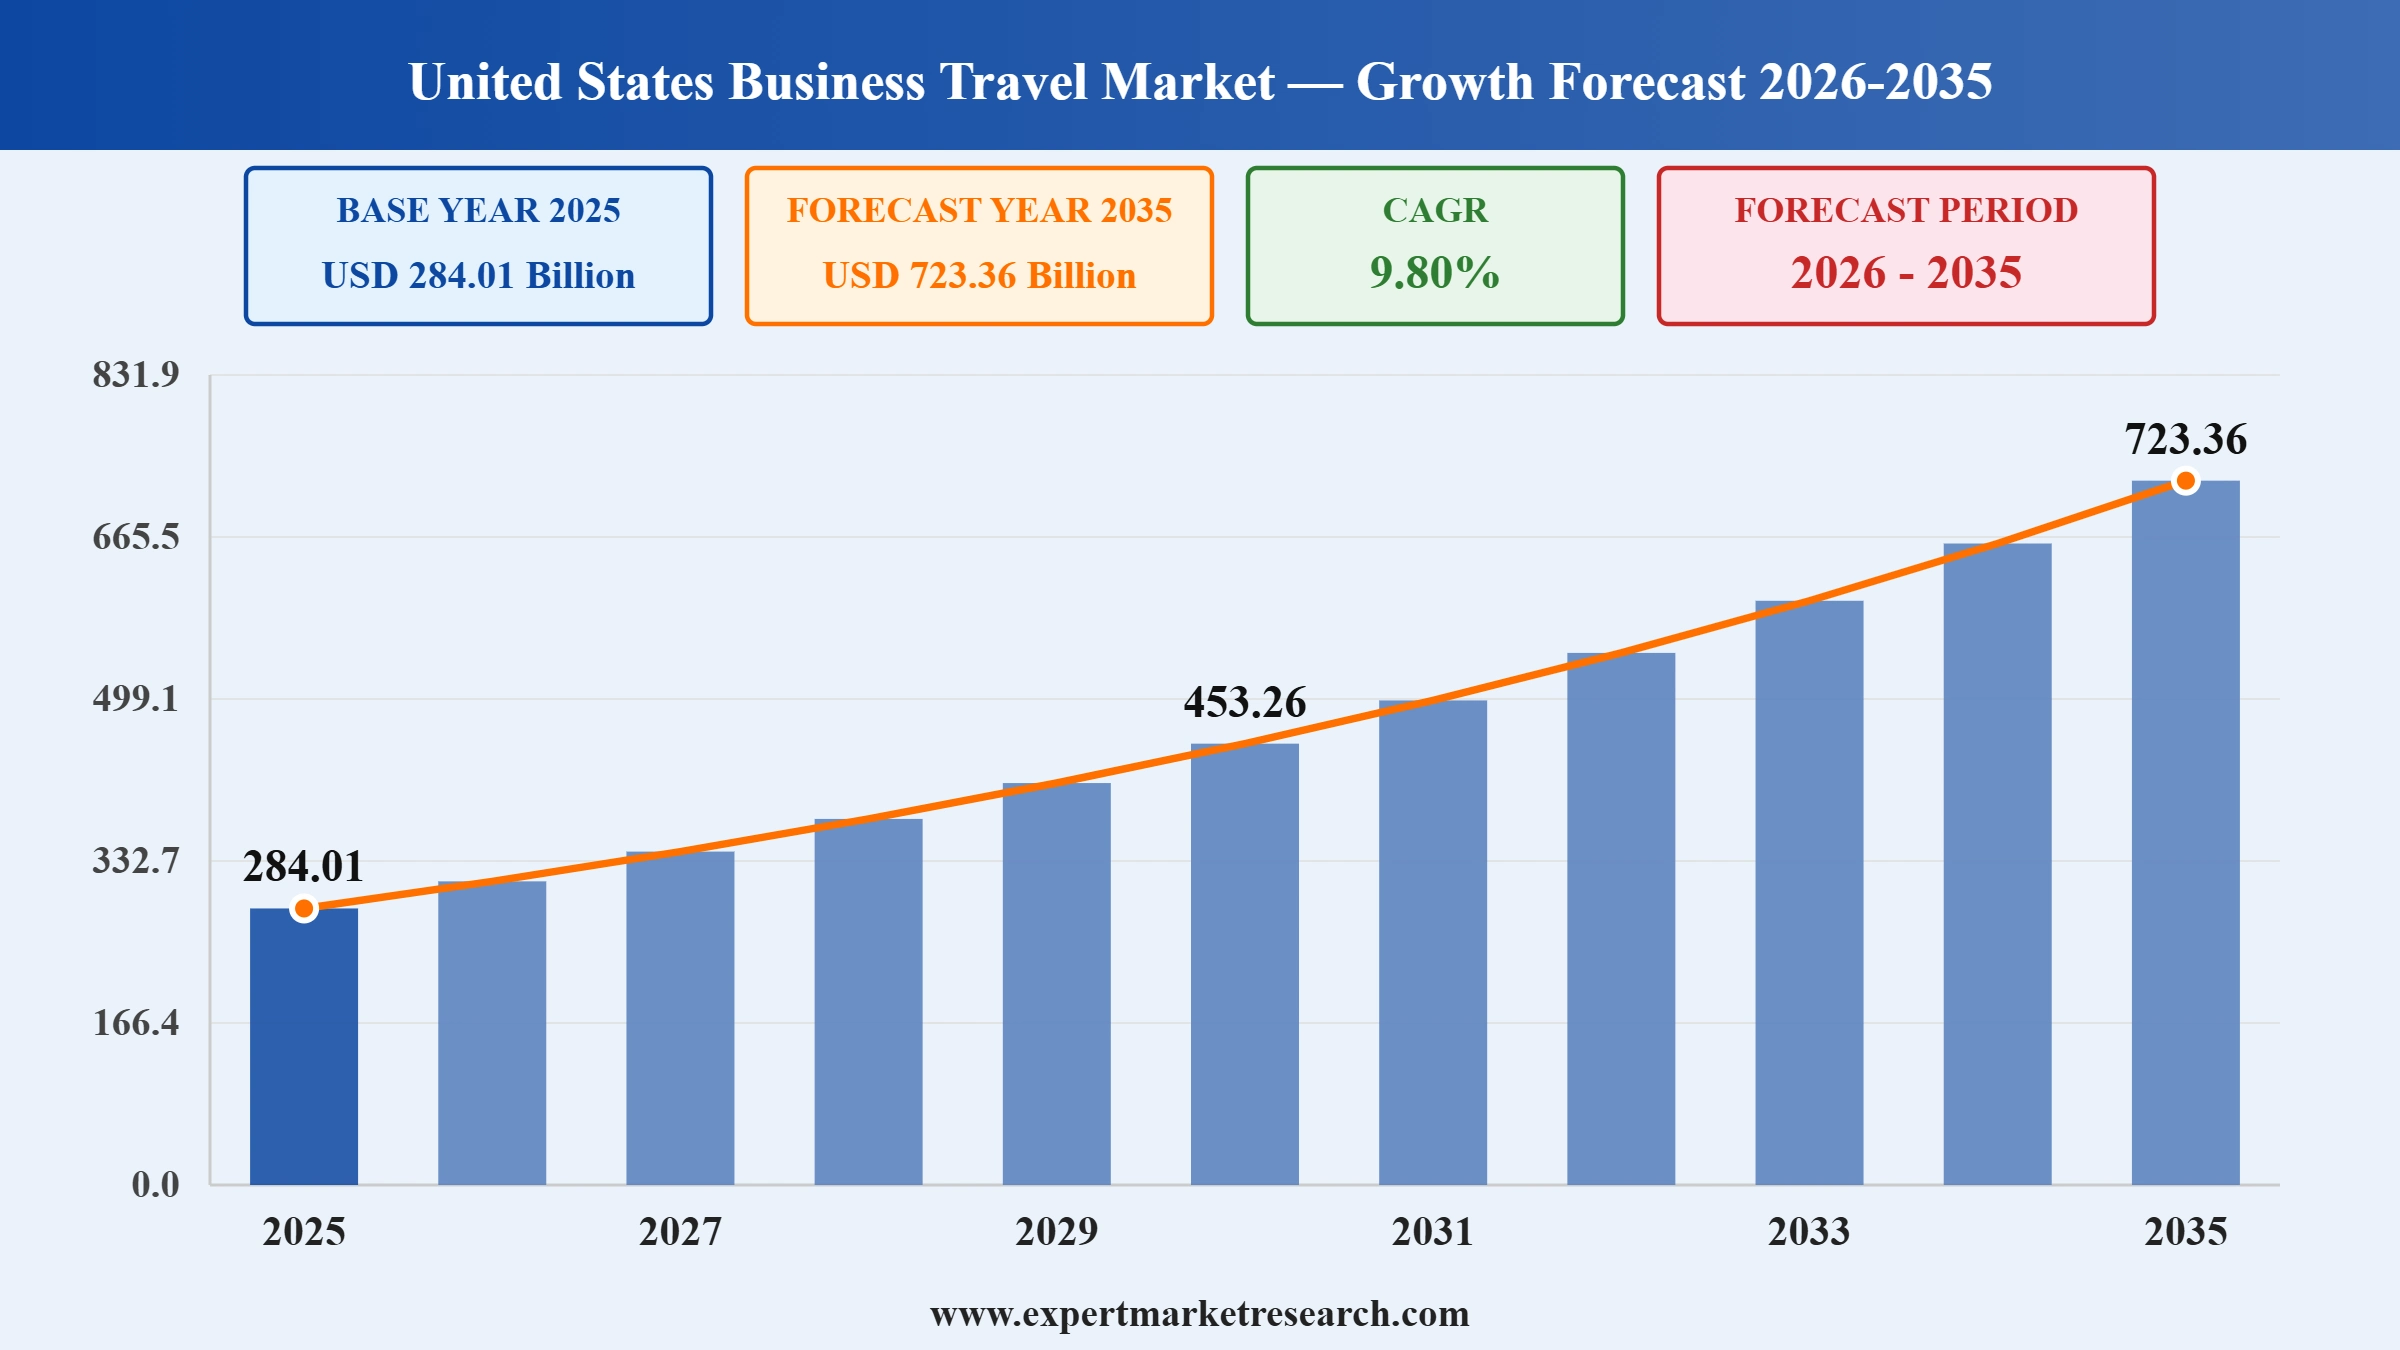
The United States business travel market value reached approximately USD 284.01 Billion in 2025. The market is further projected to grow at a CAGR of 9.80% between 2026 and 2035, reaching a value of USD 723.36 Billion by 2035.
Read more about this report - REQUEST FREE SAMPLE COPY IN PDF
| United States Business Travel Market Report Summary | Description | Value |
| Base Year | USD Billion | 2025 |
| Historical Period | USD Billion | 2019-2025 |
| Forecast Period | USD Billion | 2026-2035 |
| Market Size 2025 | USD Billion | 284.01 |
| Market Size 2035 | USD Billion | 723.36 |
| CAGR 2019-2025 | Percentage | XX% |
| CAGR 2026-2035 | Percentage | 9.80% |
| CAGR 2026-2035 - Market by Region | Southeast | 11.2% |
| CAGR 2026-2035 - Market by Region | Great Lakes | 10.5% |
| CAGR 2026-2035 - Market by Type | Managed Business Travel | 10.4% |
| CAGR 2026-2035 - Market by Expenditure | Travel Fare | 10.8% |
| 2025 Market Share by Region | Mideast | 18.2% |
Business travel refers to travelling activities that are specifically undertaken for work purposes. The different purposes of business travel include networking, attending events and meetings, assessment of products or services before investing, and travelling for client and vendor meetings.
The rising emphasis on employee well-being is supporting the United States business travel industry growth. To encourage employees and foster team cohesion, many companies are actively investing in leisure activities. These activities help alleviate stress and enhance work productivity.
Read more about this report - REQUEST FREE SAMPLE COPY IN PDF
The growing initiatives by various companies to embrace sustainable travel practices and increasing consciousness about their carbon footprint are supporting the market expansion. These initiatives motivate environmentally conscious employees to engage in business travel, which in turn boosts the United States business travel industry revenue.
The expansion of the travel and tourism sector and the increasing penetration of Airbnb have resulted in the availability of enhanced travel experiences for individuals, providing lucrative growth. These initiatives inspire environmentally conscious employees to participate in business travel, thereby enhancing revenue and creating the United States business travel market opportunities.
According to Tourism Economics, internal meetings saw high participation among business travellers, with 85% taking at least one trip in both Q2 and Q4 of 2022, and 80% in Q3 of 2022. Similarly, customer, supplier, or stakeholder meetings maintained strong figures, with 80% in Q2 2022, 75% in Q3 2022, and 78% in Q4 2022. Conferences, conventions, or trade shows showed consistent participation, with 83% pre-pandemic, 81% in Q2 2022, 78% in Q3 2022, and 80% in Q4 2022. In Q1 2023, 82% of business travellers took at least one trip for internal meetings, 74% planned trips for customer, supplier, or other stakeholder meetings, and 79% attended conferences, conventions, or trade shows.
Read more about this report - REQUEST FREE SAMPLE COPY IN PDF
According to Industry reports, corporate travel spending in H2 2020 was at 3%, rising to 7% in H1 2021 and 11% in H2 2021. In H1 2022, spending saw a significant increase to 27% and continued to grow to 42% in H2 2022. The upward trend continued in 2023, with corporate travel spending hitting 57% in the first half and 71% in the second half. It is anticipated to recover significantly, with projections of 85% in the first half and 95% in the second half of 2024, boosting the United States business travel market revenue.
The United States business travel market dynamics and trends are being strengthened during to the growing tourism sector. The U.S. is leading the Americas in inbound leisure travel, with spending hitting USD 83 billion in 2023, signalling a robust recovery. In Q2 2023, 42% of US consumers earning below USD 50k planned to travel within six months. This percentage increased to 67% for those earning between USD 50k and USD 99k. For households with incomes between USD 100k and USD 149k, 78% intended to travel within the same period. The trend is even more pronounced in higher income brackets, with 81% of individuals earning between USD 150k and USD 249k and 82% of those earning over USD 250k planning to travel, showing the highest travel intentions among all income groups.
“United States Business Travel Market Report and Forecast 2026-2035” offers a detailed analysis of the market based on the following segments:
Market Breakup by Type
Key Insight: Managed business travel is growing at the fastest pace within the United States business travel market, driven by companies seeking greater visibility into spending, stronger duty-of-care compliance, and AI-assisted booking efficiency.A study found that new business initiatives, in-person stakeholder engagement, and conferences rank among the top four drivers of business travel growth, all of which typically fall under structured, managed travel programmes. However, the managed segment faces a compliance challenge: GBTA's 2024 survey found that 41% of US business travellers reported booking outside their company's preferred supplier arrangements in the past 12 months, the highest non-compliance rate since managed travel programmes became standard, adding an estimated USD 750 per traveller per year in unmanaged cost leakage. Meanwhile, unmanaged travel remains widespread, particularly among small and mid-size businesses that prioritise flexibility and speed over programme discipline, reflecting the decentralised and entrepreneurial nature of much of the US corporate landscape.
Market Breakup by Purpose Type
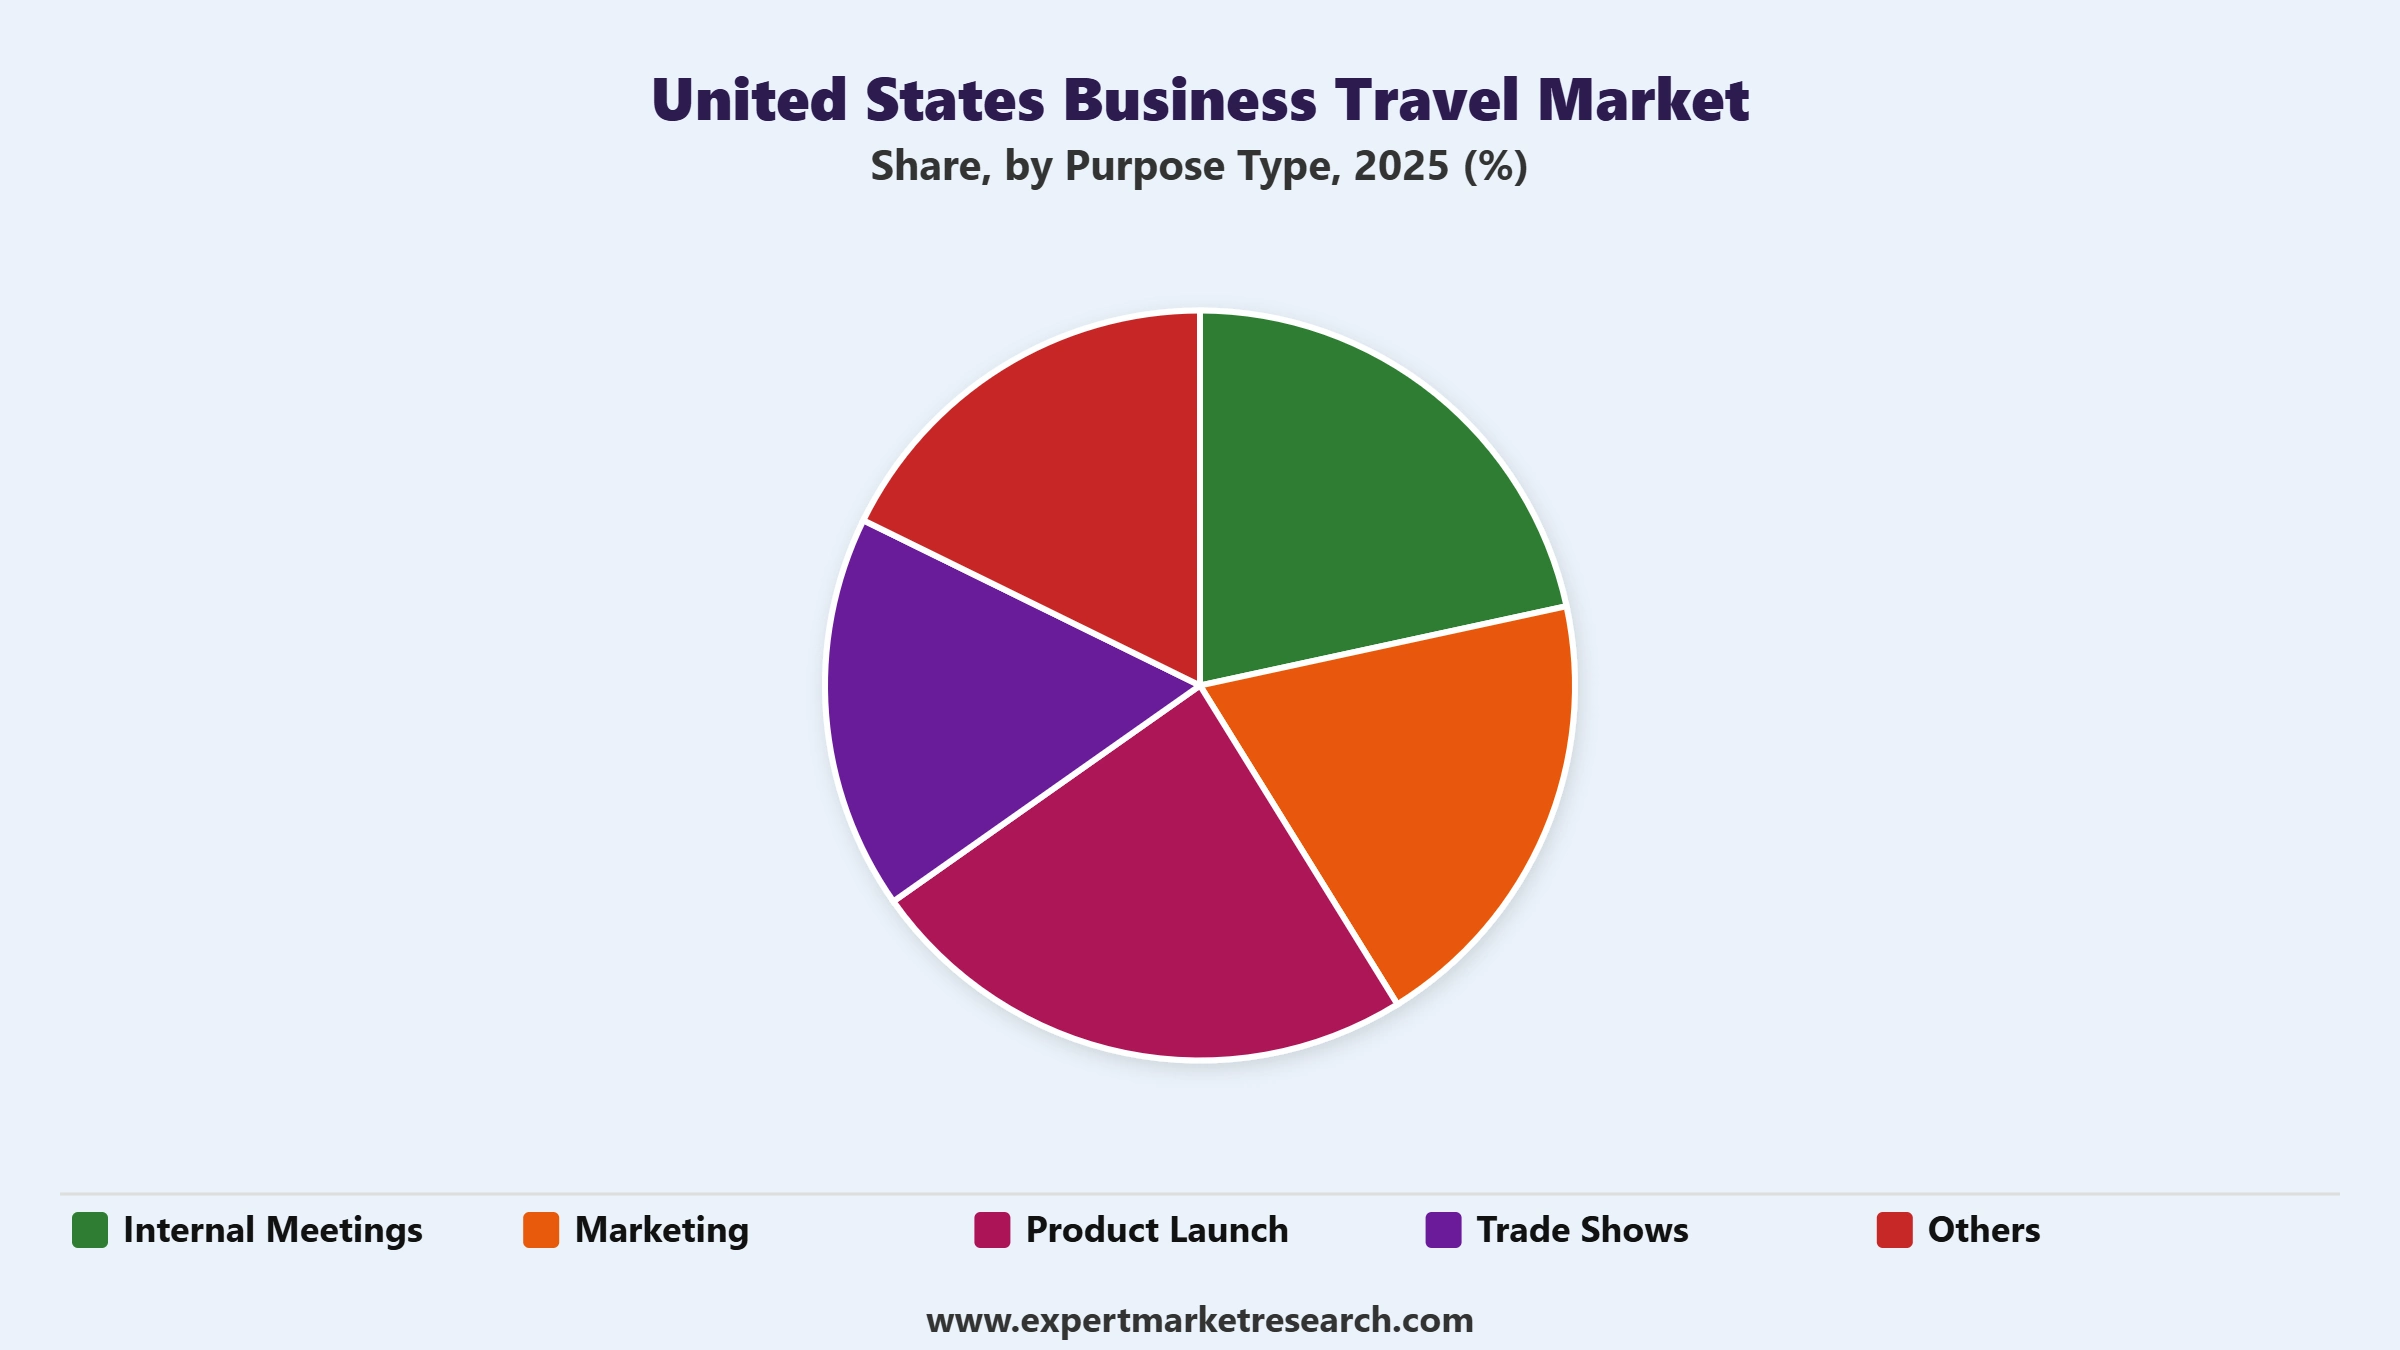
Key Insight: The purpose of business travel in the United States has shifted meaningfully in the post-pandemic period, with live events and conferences now overtaking routine client visits as the primary driver of corporate trip volume. A 2025 Corporate Travel Study found that nearly two-thirds (65%) of business travellers expected to attend a conference during the year, making it the single largest driver of travel volume. Training and development travel rose sharply to second place (47%), tied to the growing need for upskilling as AI and new technologies reshape the workplace. A March 2025 global survey by Corporate Travel Management (CTM) found that among Millennial and Gen Z employees, 44% ranked conferences, events, and trade shows as the main purpose behind their business travel, followed by internal team meetings and client or partner engagement, highlighting how face-to-face collaboration at scale continues to anchor the United States business travel market.
Market Breakup by Age Group
Key Insight: Travellers under 40 years old, primarily Millennials and younger Gen X professionals, represent the most active and commercially influential age group in the United States business travel market. According to a 2025 study from Globetrender cited across industry research, 83% of Gen Z business travellers believe travel creates more promotion opportunities at their company, and 76% say it influences their decision to stay with their employer, making travel access a meaningful factor in talent attraction and retention. Booking.com's research found that Gen Z employees are 44% more likely than older generations to increase travel frequency through hybrid working arrangements. Among travellers above 40, travel remains purposeful and concentrated in senior decision-making roles, with average trip costs for senior decision-makers running close to USD 2,000 per trip according to Booking.com for Business data, significantly above the overall US average of USD 1,446 per domestic trip, reflecting the premium services this group demands.
Market Breakup by Travel Type
Key Insight: The United States business travel market is split relatively evenly between individual and group travel, with distinct economic profiles for each. According to GBTA's 2024 economic impact study, approximately 59% of all business trips in 2024 were for transient solo purposes including client service, sales meetings, and project work, while 41% were group travel related to conventions, training sessions, and seminars. Group travel commands disproportionate economic weight: meetings, conventions, and events generated USD 217.8 billion in expenditure, representing over 40% of total US business travel spending in 2024 despite accounting for a smaller share of trip volume. The US Travel Association's May 2026 Travel Forecast projects domestic group travel to grow faster than overall business travel in 2026, reaching USD 118 billion, with demand supported by the continued prioritisation of in-person team collaboration and the rising use of corporate events as a retention and culture-building tool.
Market Breakup by Expenditure
Key Insight: Lodging is the single largest expenditure category in US business travel, consistently accounting for the greatest share of per-trip spending. According to GBTA data, the average US domestic business trip cost USD 1,446 in 2024, with airfare at approximately USD 658, lodging at USD 419 covering an average 2.1 nights, ground transportation at USD 158, and meals at USD 190. Hotels, motels, and bed and breakfasts remained the leading lodging choice of US business travellers in 2024, used on 81.2% of all business trips, according to GBTA's June 2026 study. Travel fares are the fastest-growing expenditure sub-segment, with the average corporate airfare in the US rising from USD 668 in 2023 to USD 701 in 2024 and projected to reach USD 705 in 2025, driven by fuel costs, constrained airline capacity, and rising demand for flexible fares. GBTA projects airfare growth will stabilise at just 0.4% in 2026, while corporate hotel daily rates continue accelerating at 4% to 6% annually.
Market Breakup by Service
Key Insight: Transportation and food and lodging together account for the overwhelming majority of business travel service expenditure in the United States, with recreation activity representing the fastest-growing sub-segment as bleisure travel becomes mainstream. The average managed business trip in North America cost USD 1,425 in 2025, according to Emburse Certify's 2025 Travel Trends Report, with airfare and lodging collectively representing over 75% of that total. Recreation activity spending within business trips is increasing as companies formalise bleisure policies: GBTA's 2024 survey found that 65% of business travellers extended work trips for personal leisure, while an American Express survey reported that 67% of US business travellers are interested in bleisure. This trend is not only increasing total trip spend but also creating new demand for hospitality providers that offer bundled work-and-play service packages, reshaping how transportation and lodging providers position their corporate offerings.
Market Breakup by End Use
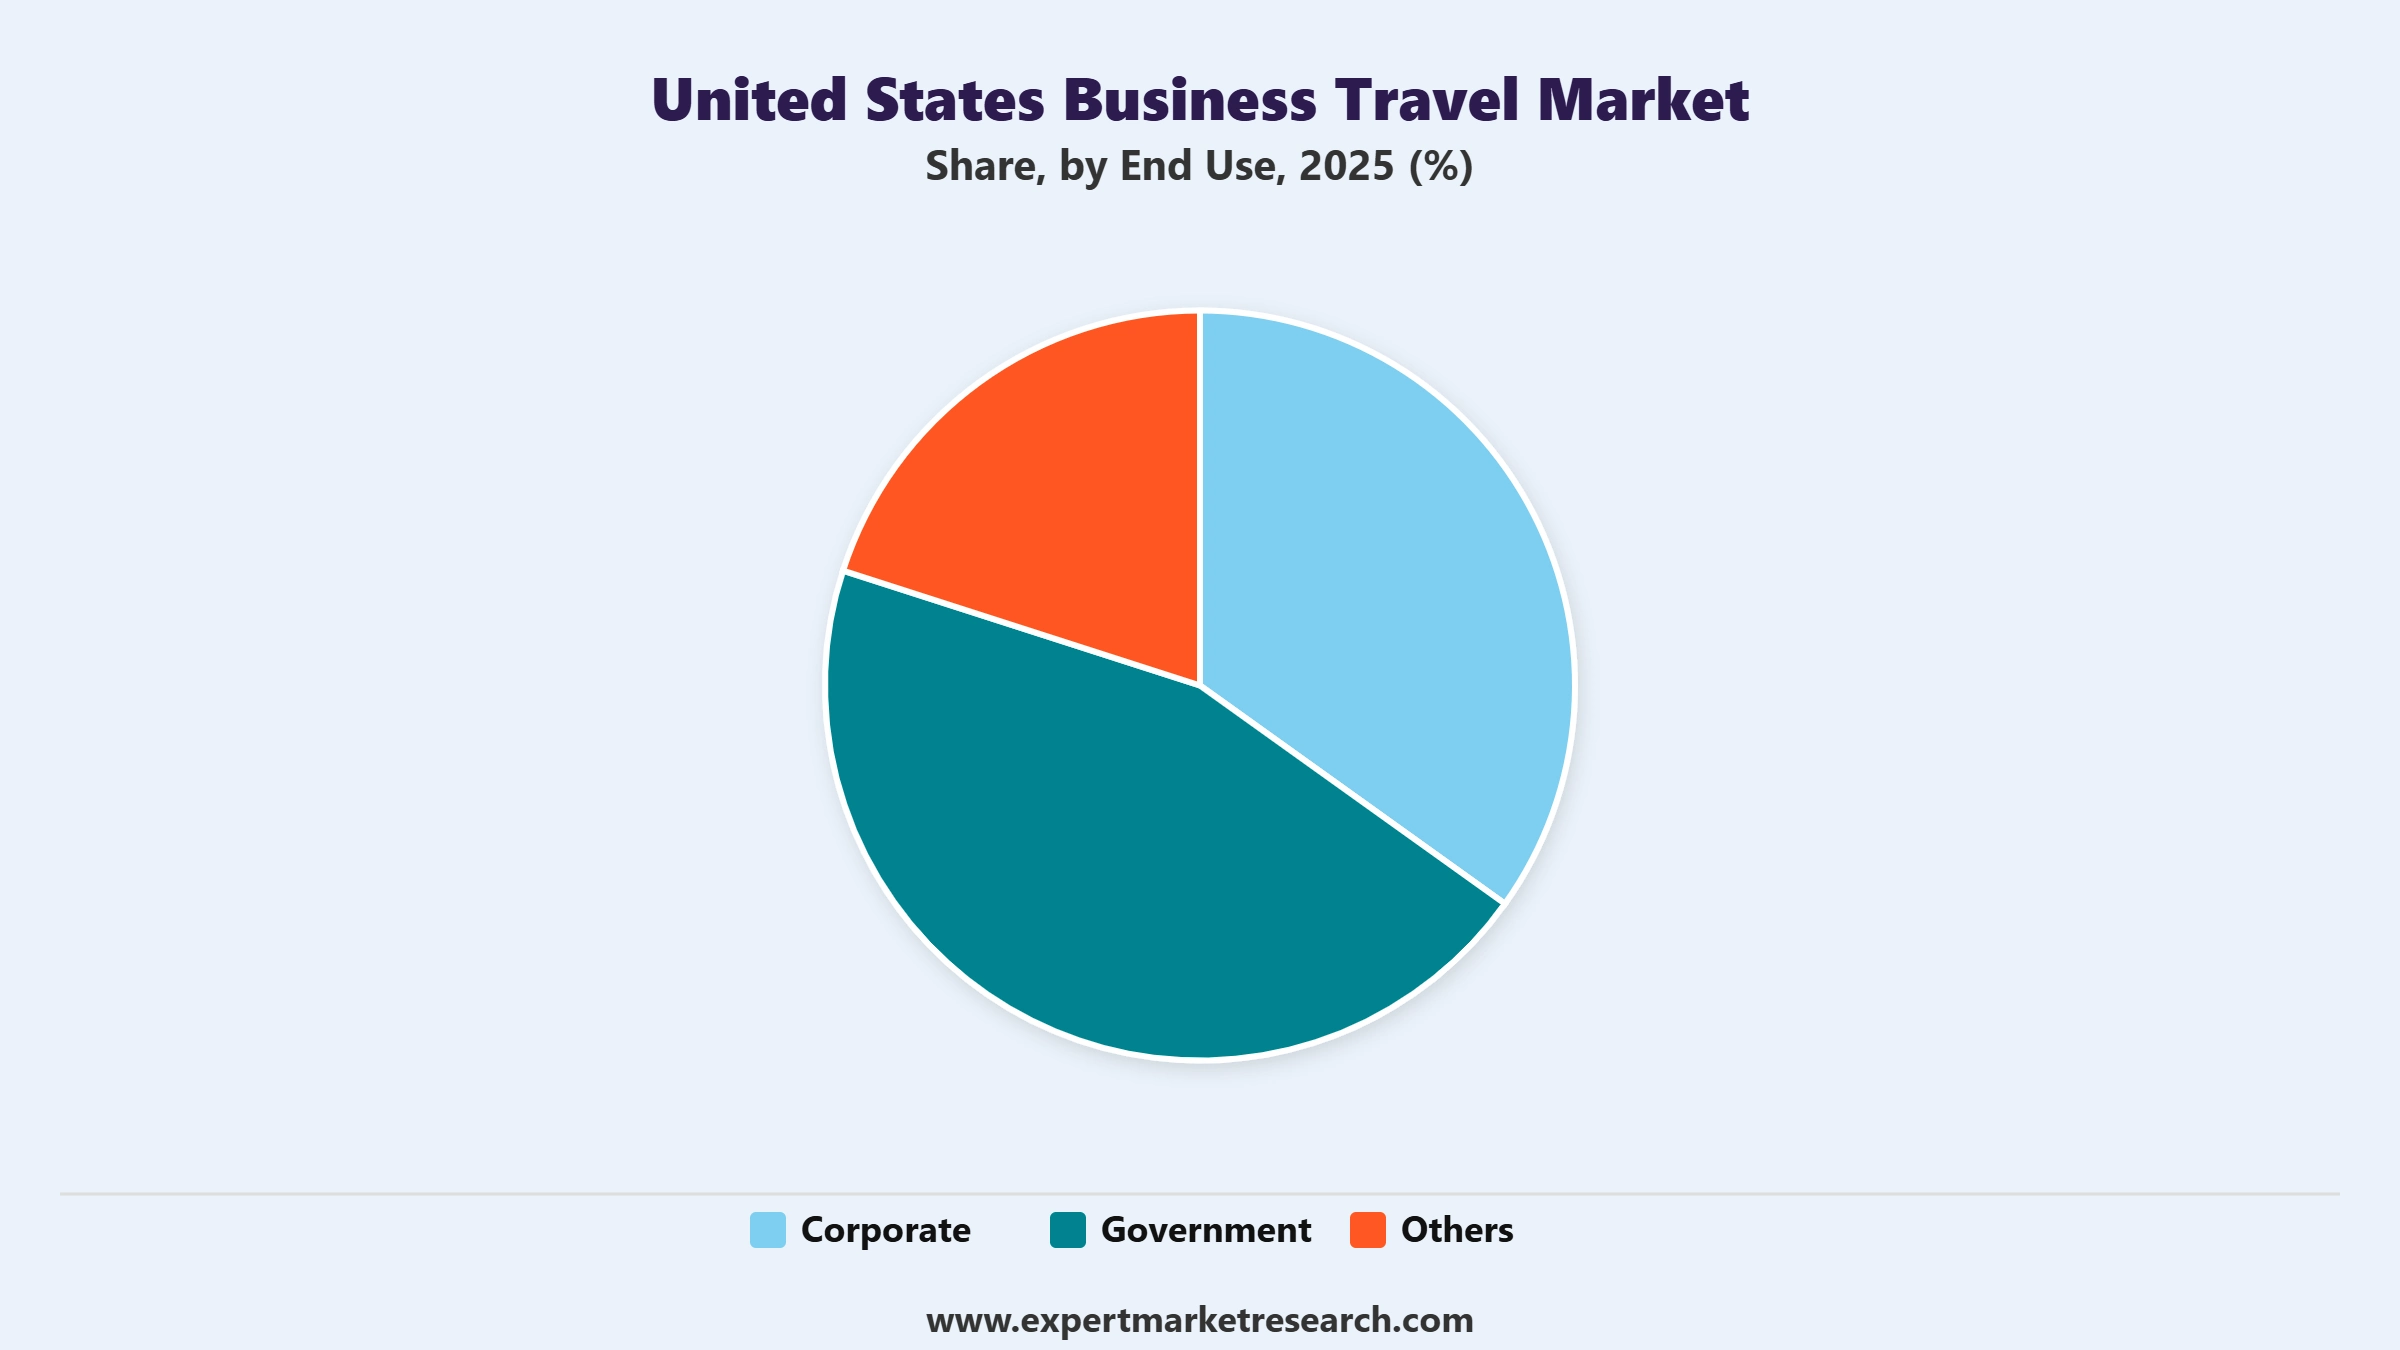
Key Insight: The corporate sector is the dominant end-use category in the United States business travel market, accounting for the vast majority of the nearly 488 million business trips taken in 2024. According to GBTA's 2024 economic impact study, domestic corporate travel accounted for USD 270 billion in spending, while meeting and event-related corporate expenditure contributed a further USD 217.8 billion, together representing nearly 90% of the total USD 538.5 billion US business travel spend recorded that year. Government travel is a structurally stable segment, governed by General Services Administration (GSA) per diem rates, with the standard Continental US meals and incidental expenses rate set at USD 68 per day for fiscal year 2025 according to GSA.gov. While government travel budgets are subject to policy-driven fluctuations, the corporate sector's continued investment in in-person engagement, training, and global expansion ensures it remains the primary growth engine of the United States business travel market through the forecast period.
Market Breakup by Region
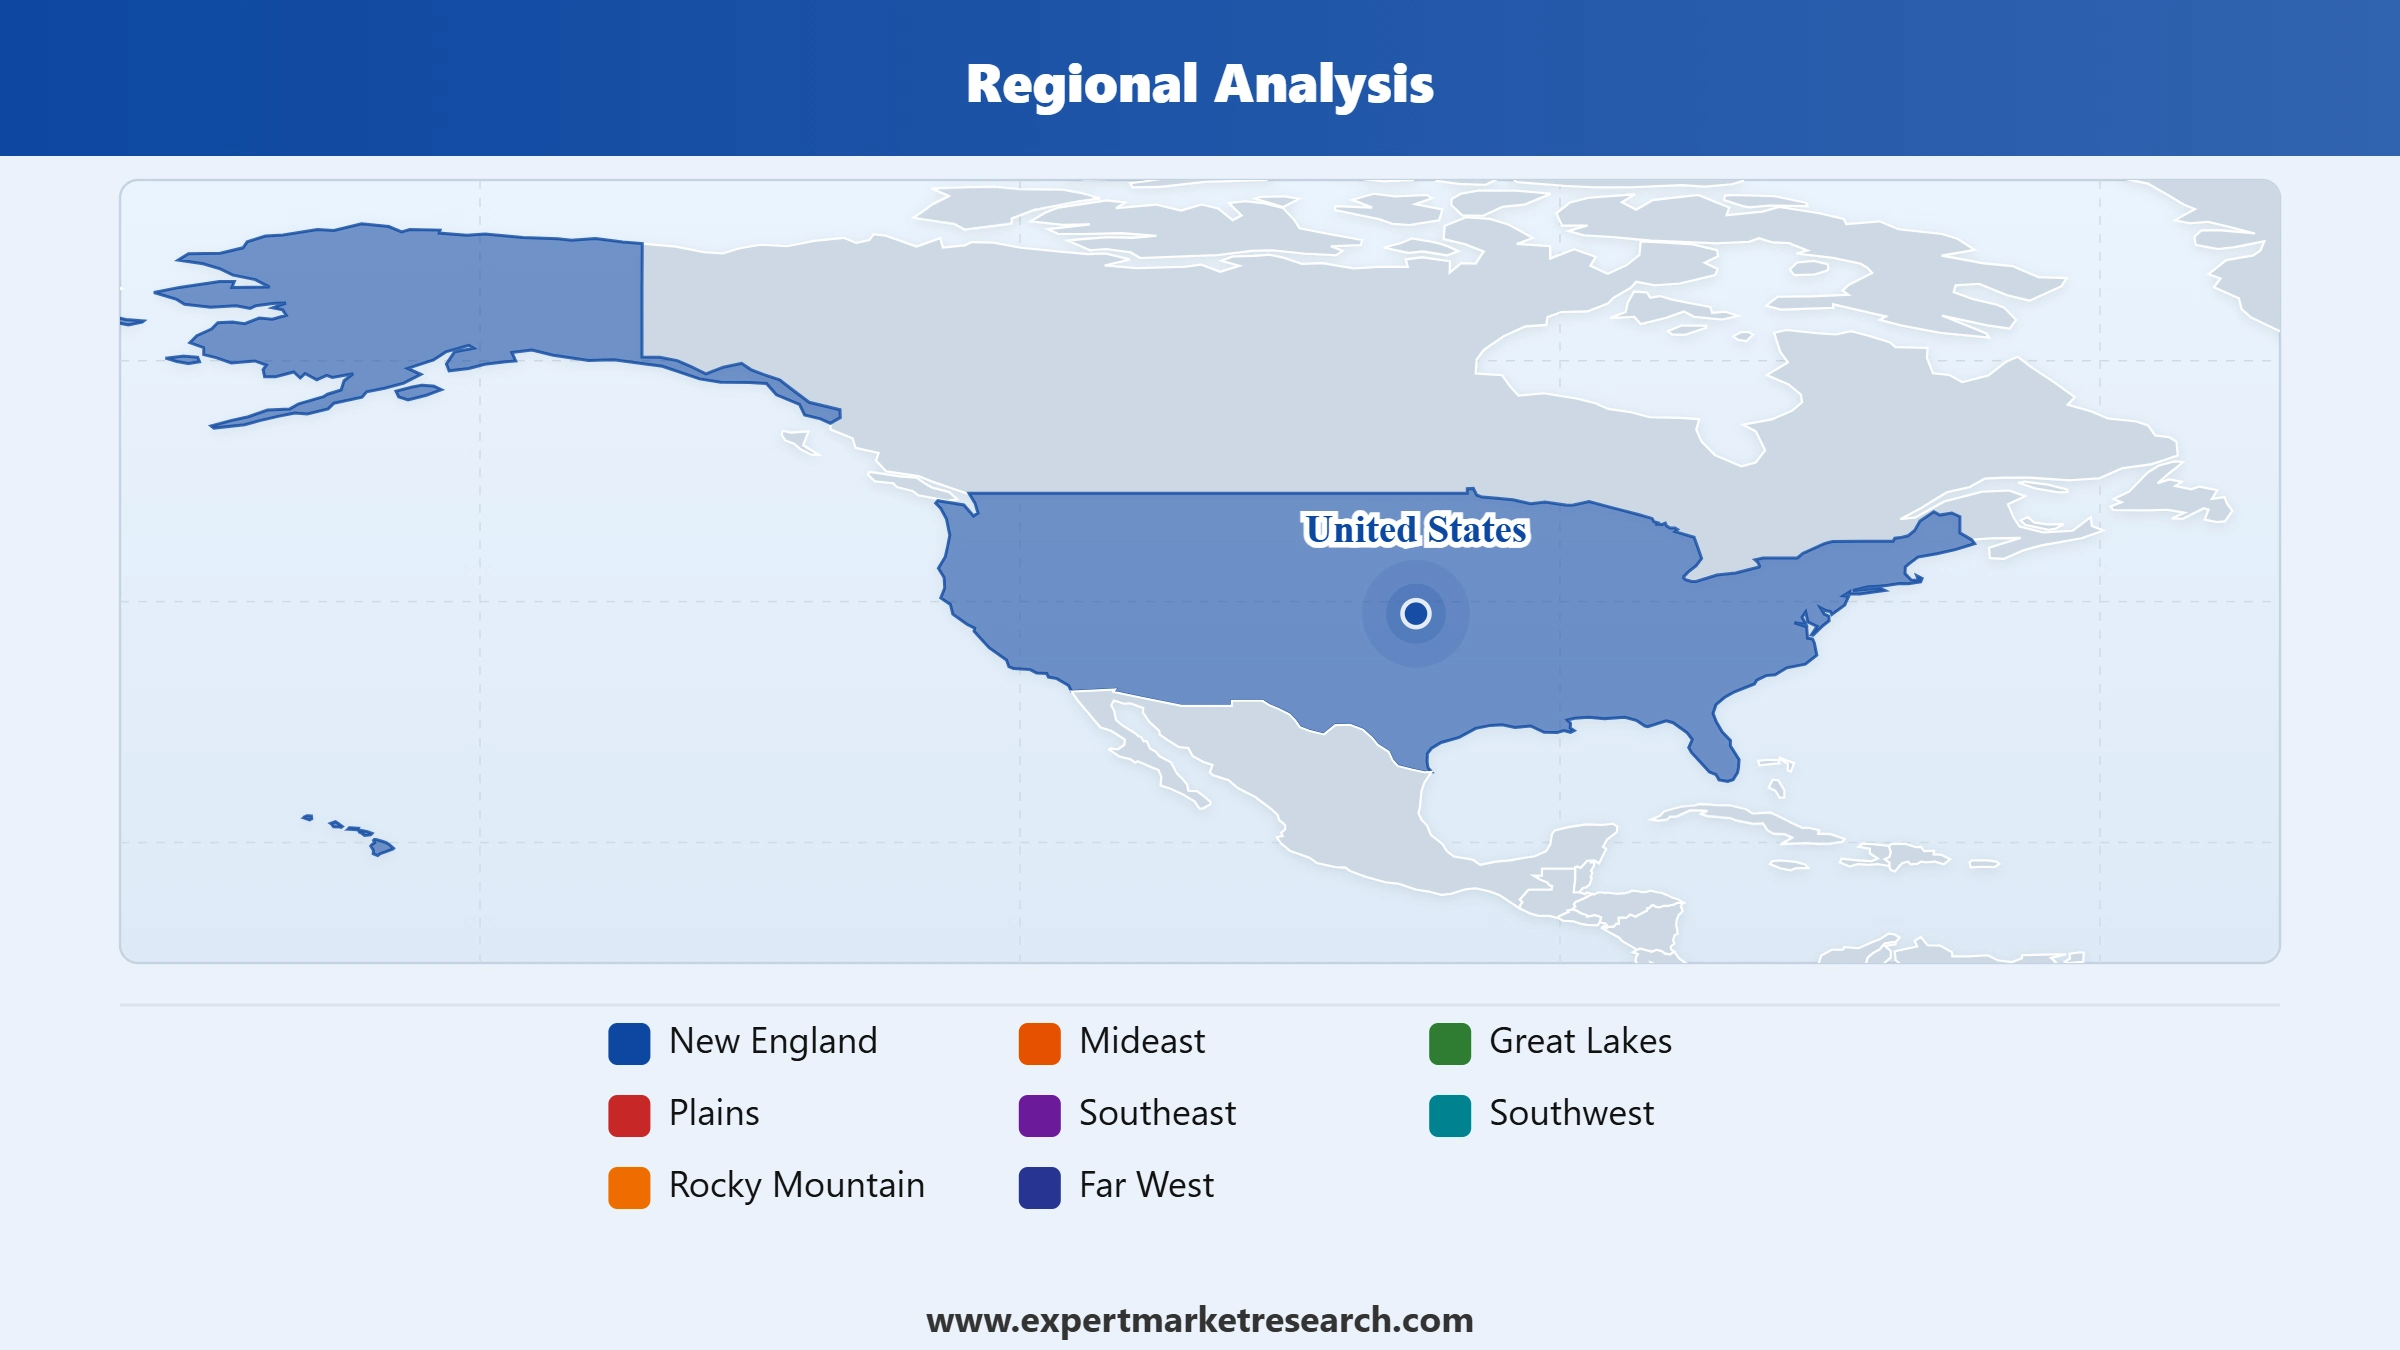
Key Insight: The United States business travel market shows meaningful regional differentiation, with established financial and commercial hubs driving volume and emerging tech and logistics corridors contributing disproportionate growth. The Mideast region, which includes New York, Pennsylvania, and Washington DC, held the largest market share at 18.2% in 2025, reflecting the concentration of financial services, media, government, and multinational corporate headquarters in that geography. The Southeast is the fastest-growing region at a projected CAGR of 11.2% through 2035, underpinned by rapid population growth, corporate relocation activity, expanding airport infrastructure, and the growth of financial technology and life sciences clusters across Atlanta, Charlotte, Miami, and Nashville. The Great Lakes region follows at a CAGR of 10.5%, driven by the automotive, manufacturing, and professional services sectors anchored in Detroit, Chicago, and Columbus. The Far West, anchored by California's technology and entertainment industries, and the Southwest, shaped by energy and logistics activity, also represent structurally significant demand bases for the United States business travel market over the forecast period.
Read more about this report - REQUEST FREE SAMPLE COPY IN PDF
The corporate sector drives substantial United States business travel demand growth due to the essential role of corporate travel in strengthening professional relationships, forging new partnerships, and supporting global company expansion.
The growing awareness about the various benefits associated with business travel including the development of decision-making skills and exposure to newer environments are bolstering the United States business travel market demand.
Read more about this report - REQUEST FREE SAMPLE COPY IN PDF
The companies are travel management firms delivering extensive business travel solutions. They offer services such as travel booking, expense management, and policy compliance, utilising advanced technology and global expertise to improve efficiency and streamline corporate travel experiences for clients.


Upto 15% Off
USD
$2499 $2249
$3999 $3599
$4999 $4249
$5999 $5099


*While we strive to always give you current and accurate information, the numbers depicted on the website are indicative and may differ from the actual numbers in the main report. At Expert Market Research, we aim to bring you the latest insights and trends in the market. Using our analyses and forecasts, stakeholders can understand the market dynamics, navigate challenges, and capitalize on opportunities to make data-driven strategic decisions.*
The market reached a value of approximately USD 284.01 Billion in 2025.
The market is projected to grow at a CAGR of 9.80% between 2026 and 2035.
The market is estimated to witness healthy growth in the forecast period of 2026-2035 to reach USD 723.36 Billion by 2035.
The major market drivers include growing awareness about the various benefits associated with business travel including development of decision-making skills and expansion of the travel and tourism sector.
The key trends fuelling the growth of the market include rising emphasis on employee wellbeing and adoption of sustainable business travel practices.
The market is broken down into New England, Mideast, Great Lakes, Plains, Southeast, Southwest, Rocky Mountain, and Far West.
The services include transportation, food and lodging, and recreation activity.
The competitive landscape consists of Expedia, Inc., TravelPerk S.L.U., American Express Global Business Travel (GBT), Navan, Inc., Booking Holdings Inc., BCD Travel Services B.V., World Travel, Inc, Corporate Travel Management, Travel Leaders Group, and CLC Lodging, among others.
The market is categorised according to its type, which includes managed business travel and unmanaged business travel.
The market is categorised according to its travel type, which includes solo travel and group travel.
Explore our key highlights of the report and gain a concise overview of key findings, trends, and actionable insights that will empower your strategic decisions.
| REPORT FEATURES | DETAILS |
| Base Year | 2025 |
| Historical Period | 2019-2025 |
| Forecast Period | 2026-2035 |
| Scope of the Report |
Historical and Forecast Trends, Industry Drivers and Constraints, Historical and Forecast Market Analysis by Segment:
|
| Breakup by Type |
|
| Breakup by Purpose Type |
|
| Breakup by Age Group |
|
| Breakup by Travel Type |
|
| Breakup by Expenditure |
|
| Breakup by Service |
|
| Breakup by End Use |
|
| Breakup by Region |
|
| Market Dynamics |
|
| Competitive Landscape |
|
| Companies Covered |
|
Datasheet
One User
USD 2,499
USD 2,249
tax inclusive*
Single User License
One User
USD 3,999
USD 3,599
tax inclusive*
Five User License
Five User
USD 4,999
USD 4,249
tax inclusive*
Corporate License
Unlimited Users
USD 5,999
USD 5,099
tax inclusive*
*Please note that the prices mentioned below are starting prices for each bundle type. Kindly contact our team for further details.*
Flash Bundle
Small Business Bundle
Growth Bundle
Enterprise Bundle
*Please note that the prices mentioned below are starting prices for each bundle type. Kindly contact our team for further details.*
Flash Bundle
Number of Reports: 3
20%
tax inclusive*
Small Business Bundle
Number of Reports: 5
25%
tax inclusive*
Growth Bundle
Number of Reports: 8
30%
tax inclusive*
Enterprise Bundle
Number of Reports: 10
35%
tax inclusive*
How To Order

Select License Type
Choose the right license for your needs and access rights.

Click on ‘Buy Now’
Add the report to your cart with one click and proceed to register.

Select Mode of Payment
Choose a payment option for a secure checkout. You will be redirected accordingly.
Strategic Solutions for Informed Decision-Making
Gain insights to stay ahead and seize opportunities.

Get insights & trends for a competitive edge.

Track prices with detailed trend reports.

Analyse trade data for supply chain insights.

Leverage cost reports for smart savings

Enhance supply chain with partnerships.

Connect For More Information
Our expert team of analysts will offer full support and resolve any queries regarding the report, before and after the purchase.
Our expert team of analysts will offer full support and resolve any queries regarding the report, before and after the purchase.
We employ meticulous research methods, blending advanced analytics and expert insights to deliver accurate, actionable industry intelligence, staying ahead of competitors.
Our skilled analysts offer unparalleled competitive advantage with detailed insights on current and emerging markets, ensuring your strategic edge.
We offer an in-depth yet simplified presentation of industry insights and analysis to meet your specific requirements effectively.




