

Consumer Insights
Uncover trends and behaviors shaping consumer choices today
Procurement Insights
Optimize your sourcing strategy with key market data
Industry Stats
Stay ahead with the latest trends and market analysis.
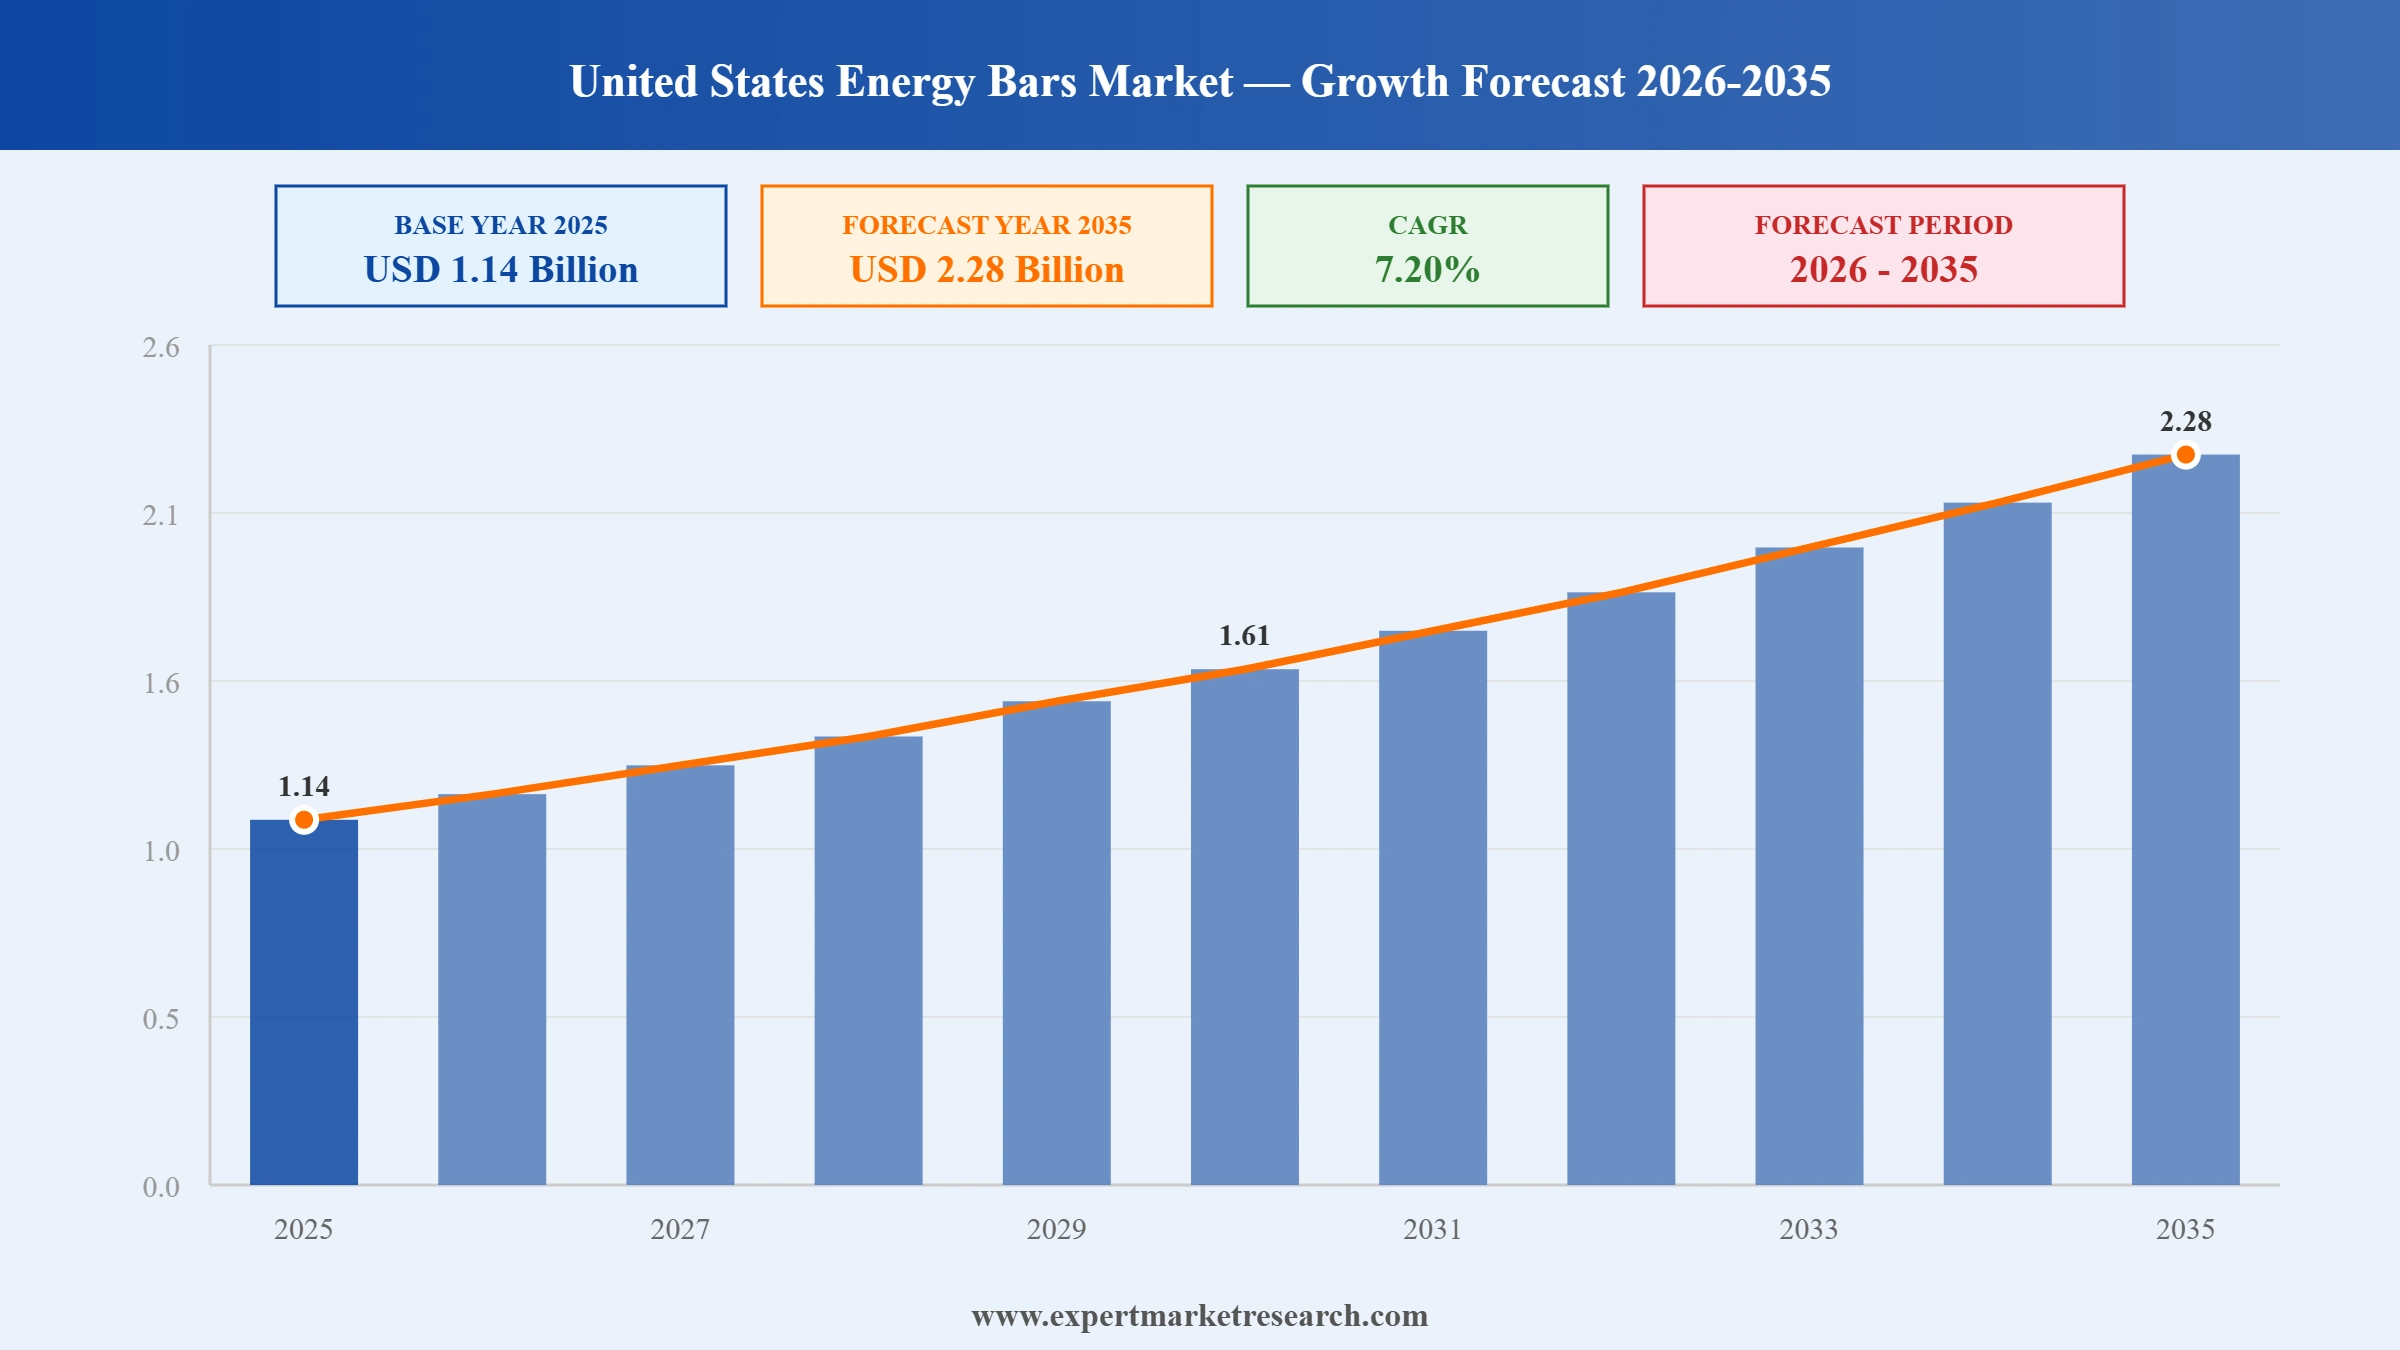
The United States energy bars market was valued at USD 1.14 Billion in 2025. It is poised to grow at a CAGR of 7.20% during the forecast period of 2026-2035, and reach USD 2.28 Billion by 2035. The market growth is driven by rising health awareness, increasing demand for convenient nutrition, expanding fitness culture, and growing preference for protein-rich, on-the-go snack options among consumers.
Read more about this report - REQUEST FREE SAMPLE COPY IN PDF
| United States Energy Bars Market Report Summary | Description | Value |
| Base Year | USD Billion | 2025 |
| Historical Period | USD Billion | 2019-2025 |
| Forecast Period | USD Billion | 2026-2035 |
| Market Size 2025 | USD Billion | 1.14 |
| Market Size 2035 | USD Billion | 2.28 |
| CAGR 2019-2025 | Percentage | XX% |
| CAGR 2026-2035 | Percentage | 7.20% |
| CAGR 2026-2035 - Market by Region | Southeast | 6.2% |
| CAGR 2026-2035 - Market by Region | New England | 5.8% |
| CAGR 2026-2035 - Market by Type | Organic | 6.9% |
| CAGR 2026-2035 - Market by Distribution Channel | Online Retail Stores | 7.1% |
| Market Share by Region | Plains | 6.8% |
The market reached a value of approximately USD 1.14 Billion in 2025. The market is witnessing steady expansion driven by rising health awareness, increasing demand for convenient nutrition, and growing fitness-oriented lifestyles among consumers. The market includes protein, nutrition, cereal, and fiber bars distributed through supermarkets, convenience stores, specialty outlets, and online platforms. Product innovation, clean-label ingredients, and demand for high-protein snacks continue to shape consumer preferences, while manufacturers focus on functional benefits and flavor variety to strengthen market penetration across diverse demographic groups.\
Read more about this report - REQUEST FREE SAMPLE COPY IN PDF
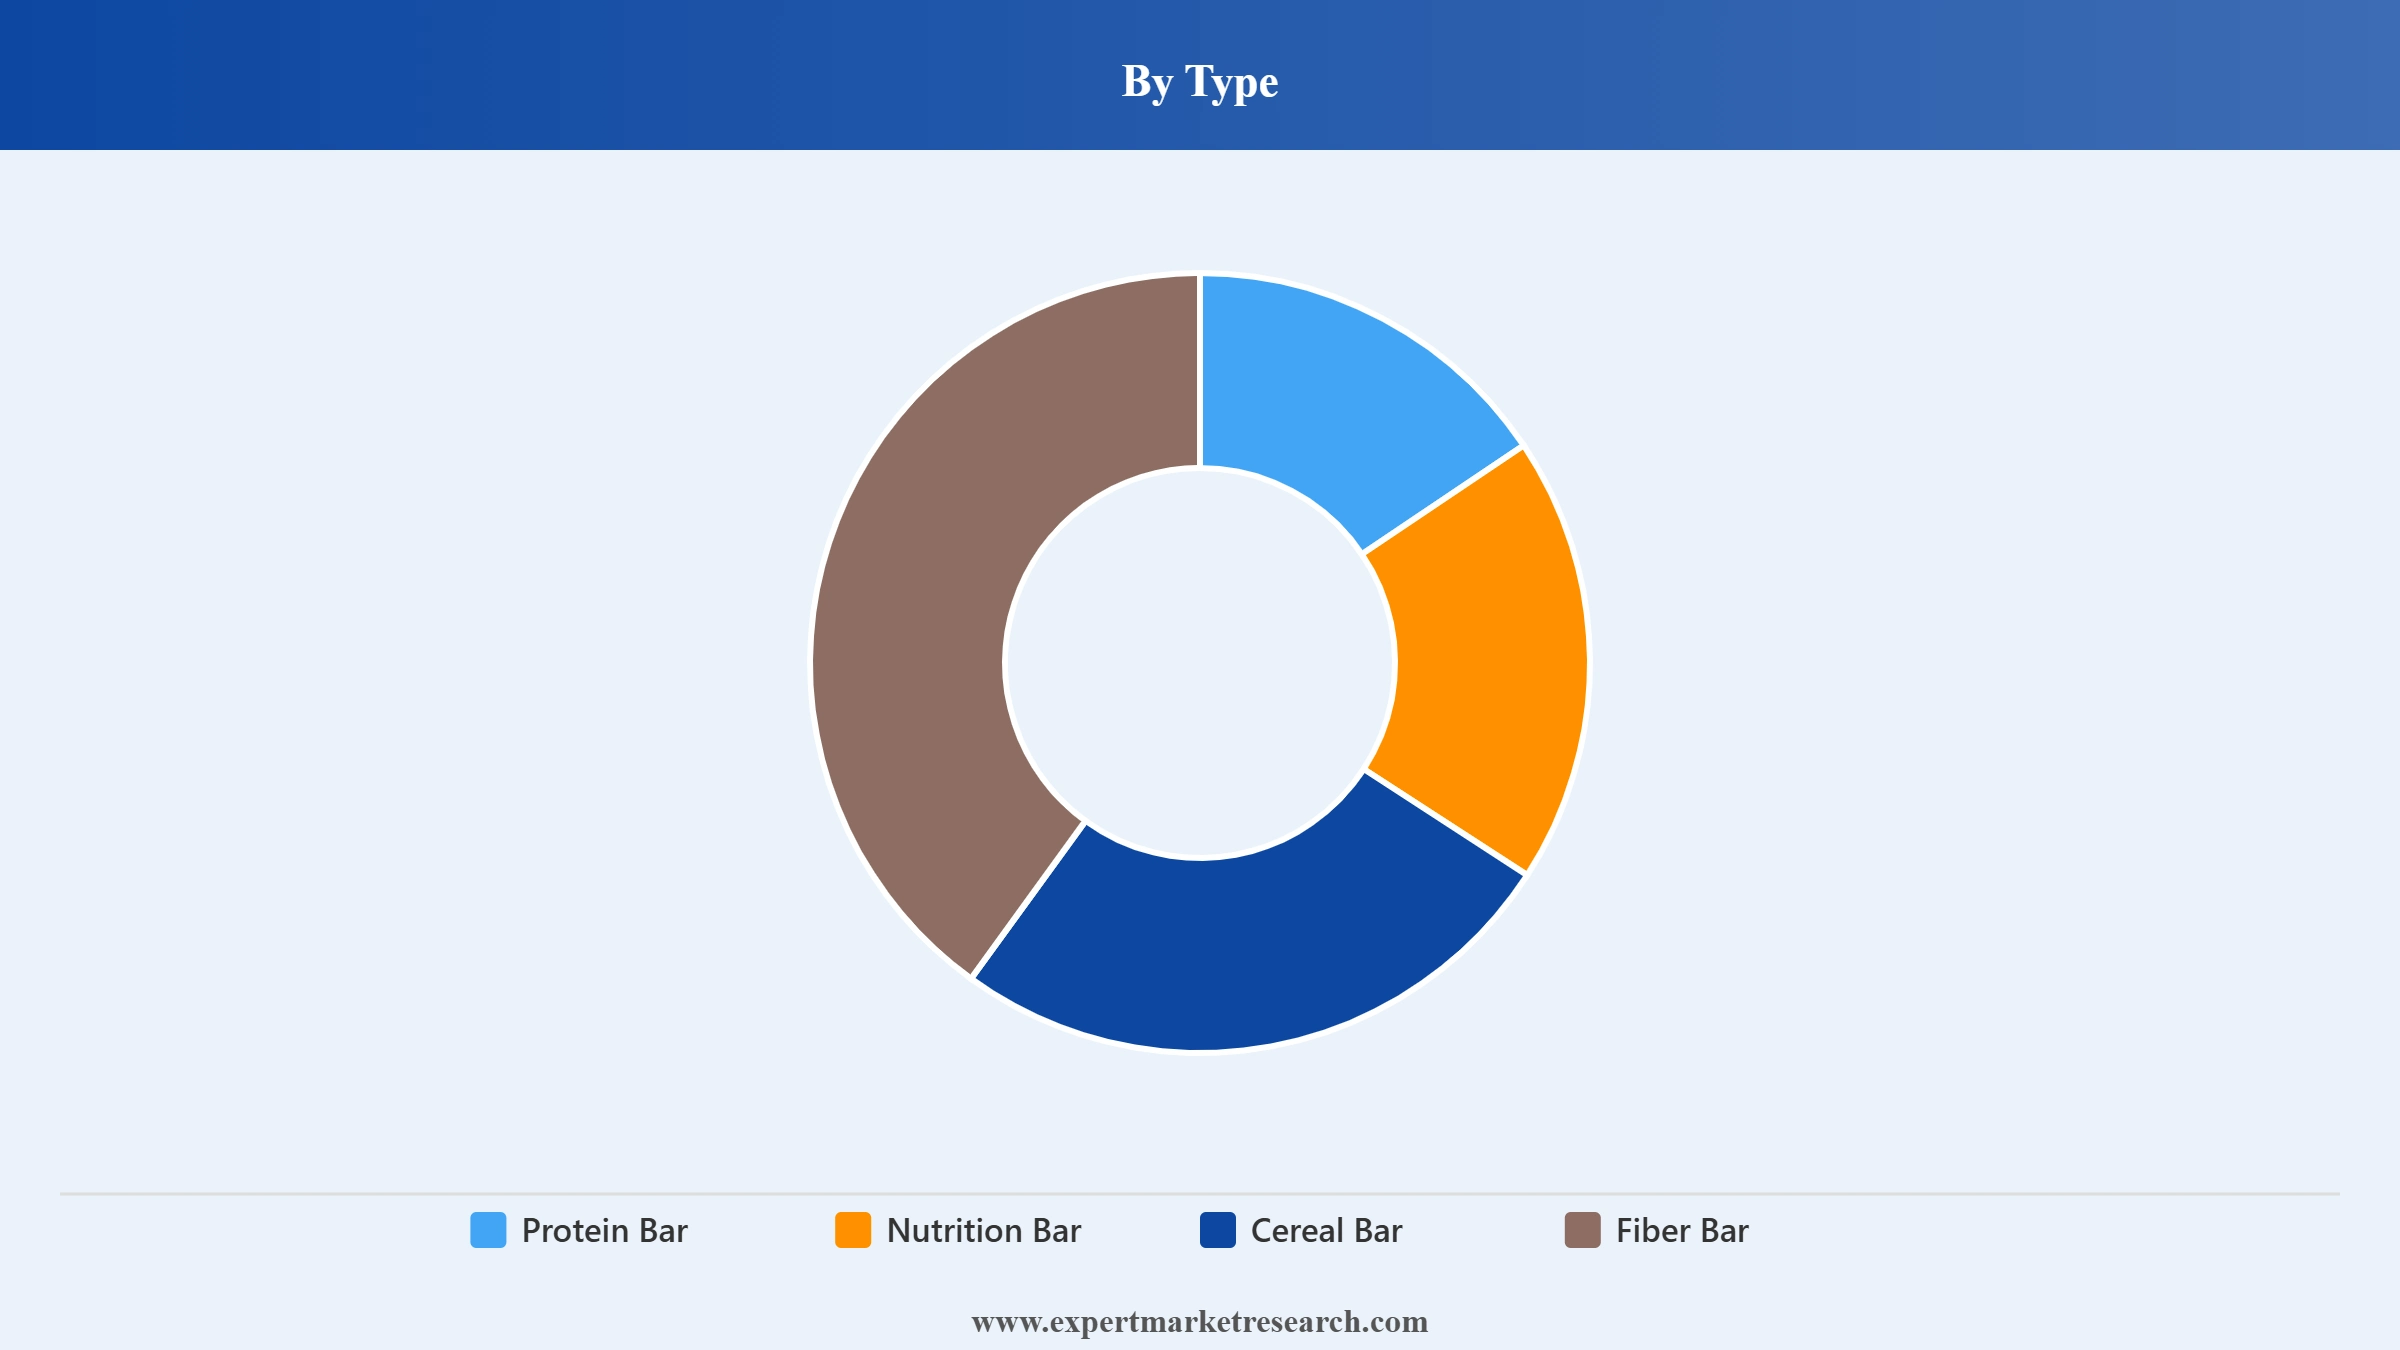
Market Breakup by Type
The type segmentation covers protein bars, nutrition bars, cereal bars, and fiber bars, reflecting varied positioning across performance nutrition, meal support, snacking convenience, and digestive wellness demand.
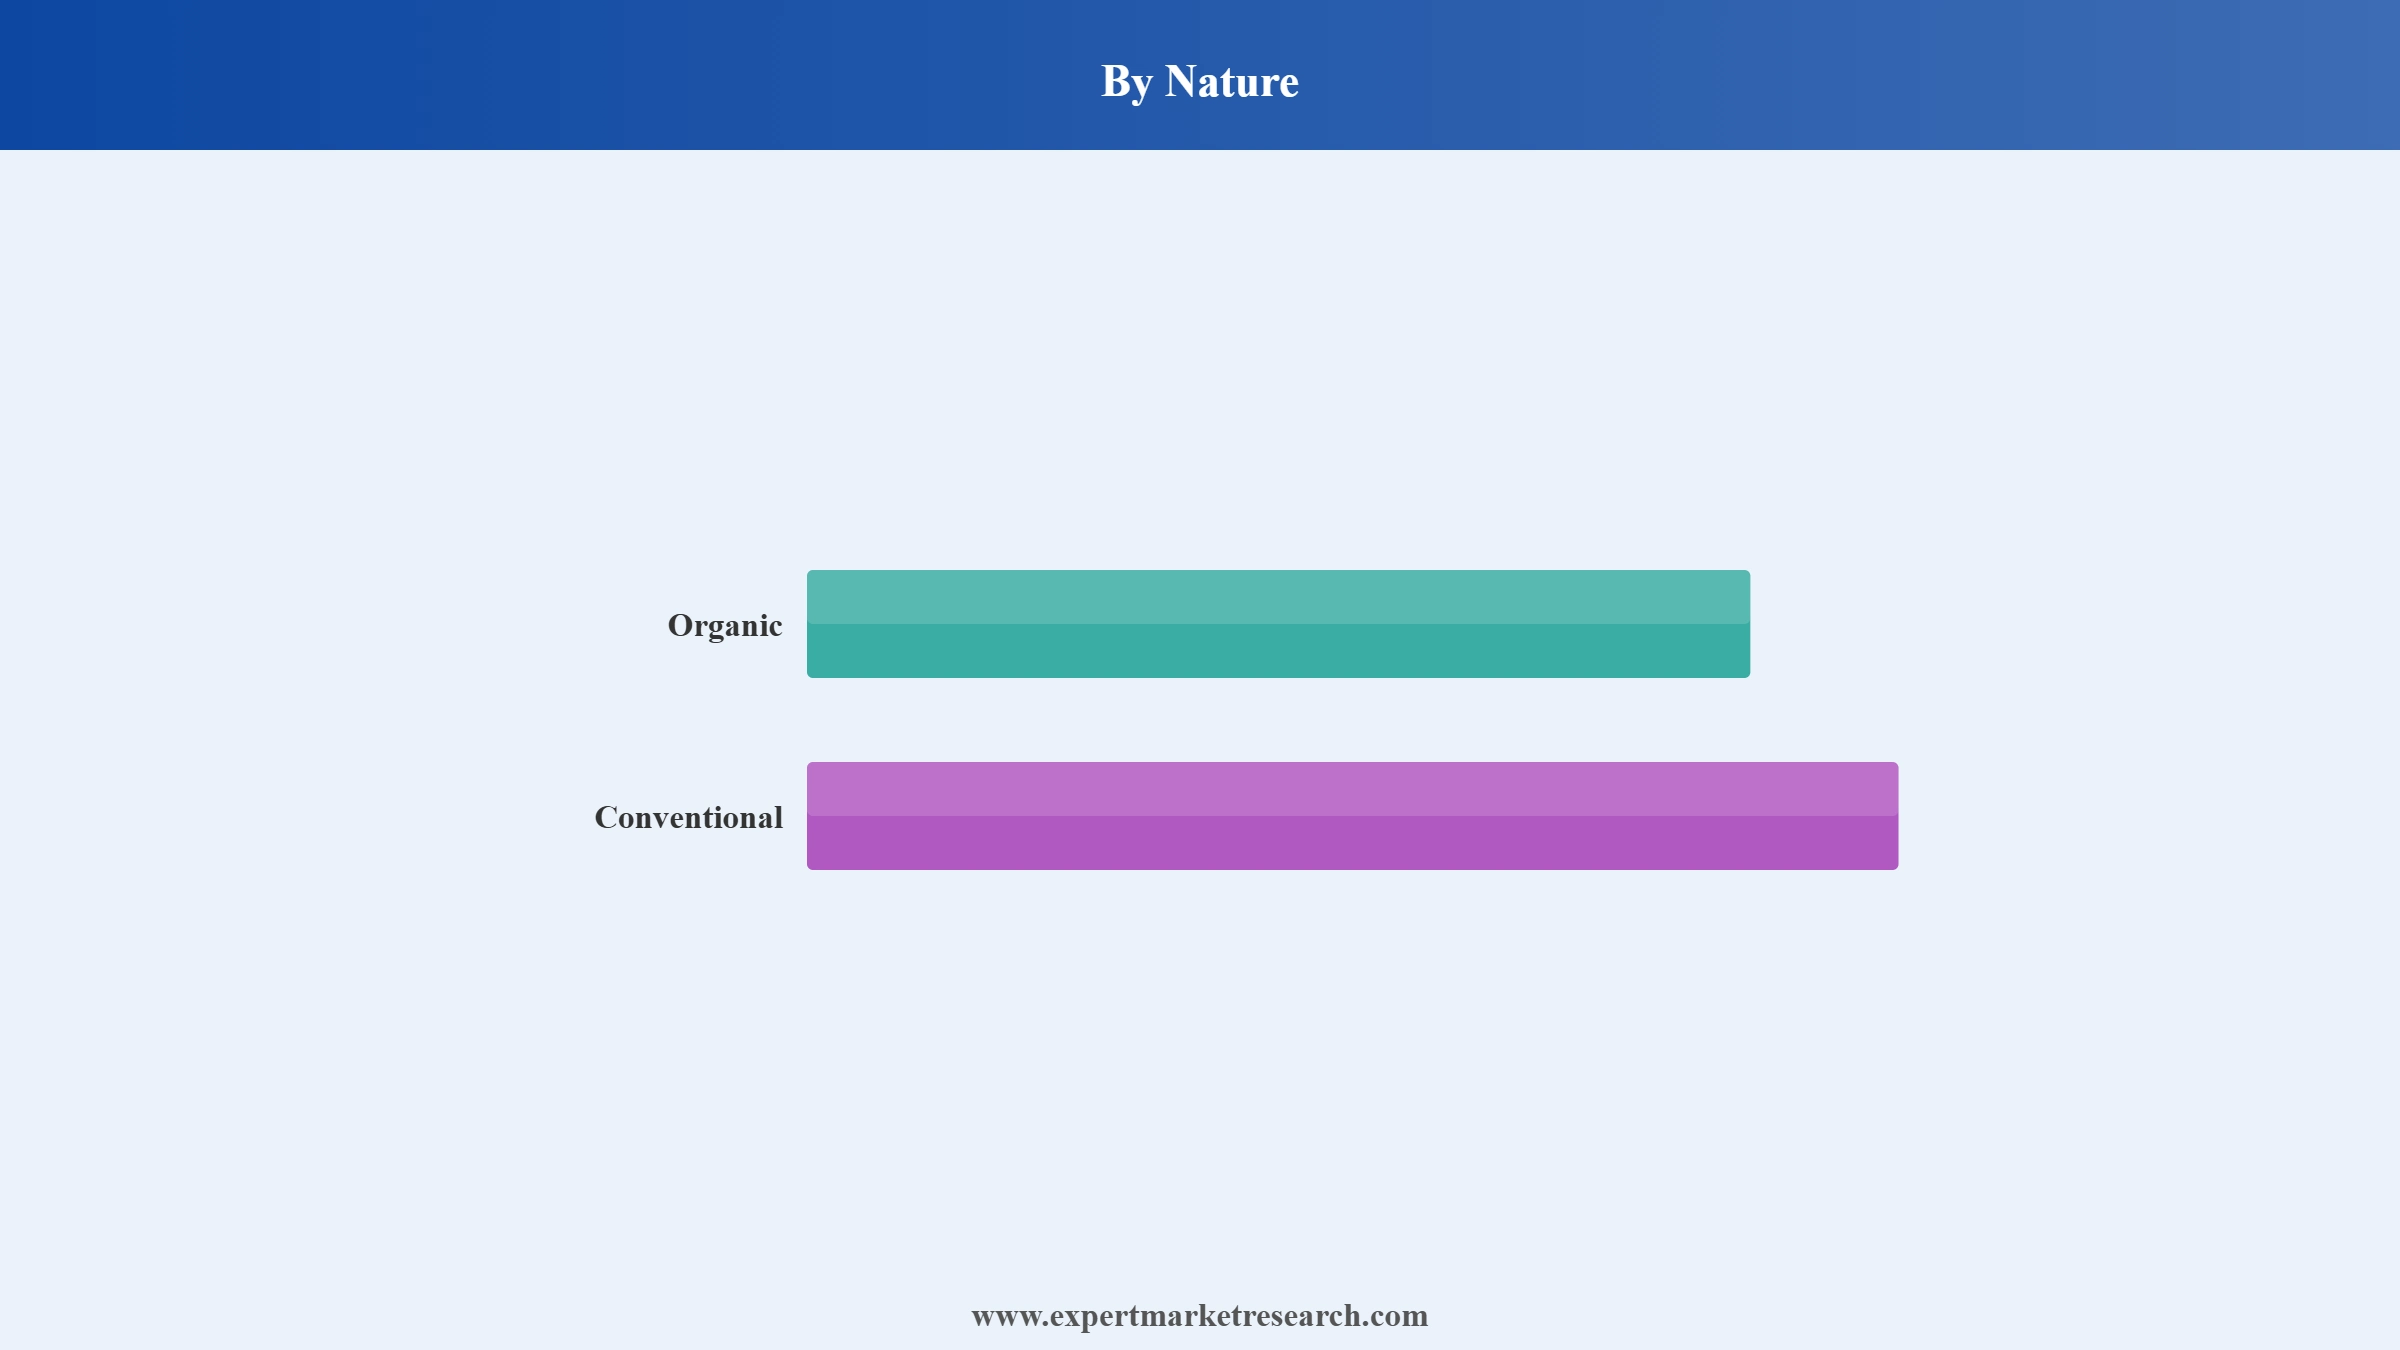
Market Breakup by Nature
The nature segmentation includes organic and conventional energy bars, capturing demand differences shaped by clean-label preferences, ingredient sourcing, pricing accessibility, and mainstream retail availability.
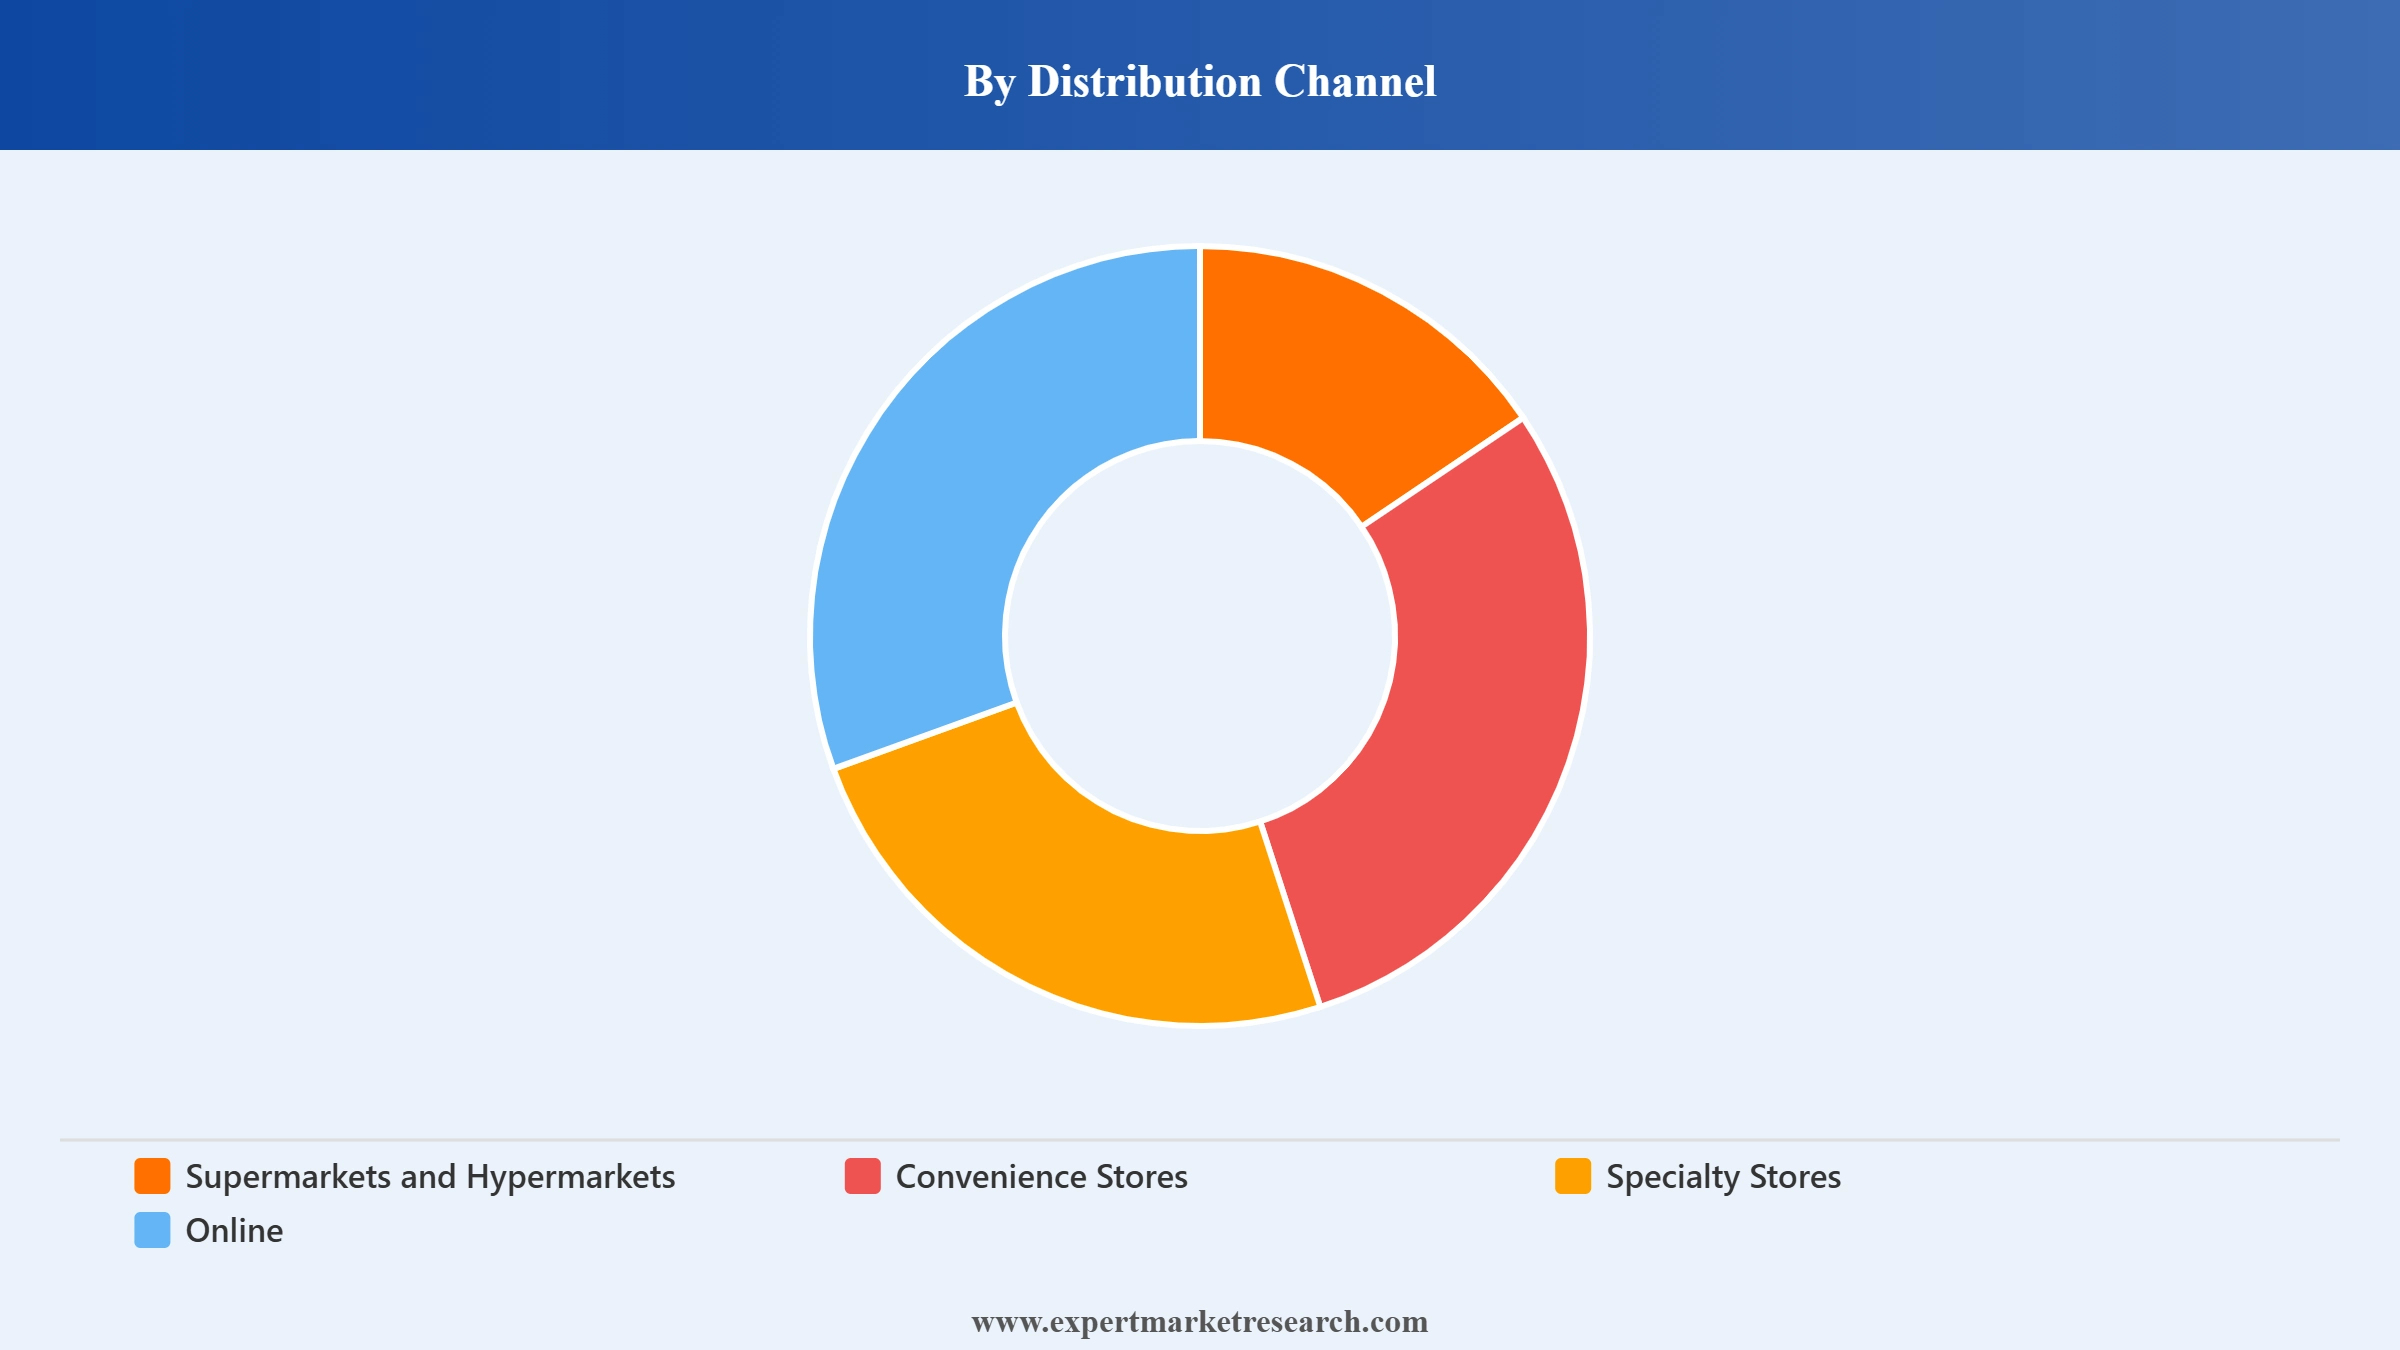
Market Breakup by Distribution Channel
The distribution channel segmentation covers supermarkets, hypermarkets, convenience stores, specialty stores, and online platforms, reflecting varied purchasing behavior across impulse buying, planned grocery trips, and digital replenishment.


Read more about this report - REQUEST FREE SAMPLE COPY IN PDF
|
Analysis Type |
Factors |
Example |
|
Market Drivers |
Active snacking demand, endurance sports participation, portable nutrition needs, flavor innovation, and sustained-energy positioning across grocery, outdoor, sports nutrition, and online channels. |
For instance, in March 2026, CLIF expanded its energy portfolio with CLIF Energy Bites and a limited-edition Chocolate Berry energy bar for movement, adventure, and athletic performance. |
|
Market Restraints |
Allergen labeling errors, product recall risks, higher testing costs, batch verification pressure, packaging review requirements, and stricter quality-control expectations across retail channels. |
For instance, in February 2026, Juniper Granola recalled Chocolate Cherry and Peanut Butter Chocolate Chip Junebars in New York after undeclared milk and soy were identified. |
|
Market Opportunities |
Mainstream retail expansion, protein snack acquisitions, creatine-based bar innovation, functional ingredient use, and wider access through mass retail, specialty stores, and e-commerce platforms. |
For instance, in May 2026, Ready launched its protein bars nationwide at Target stores and Target.com, offering five-count packs across popular flavors with protein, fiber, and whole grains. |
This section analyzes key factors influencing market growth, including rising health consciousness, increasing demand for convenient on-the-go nutrition, expanding fitness participation, and growing preference for high-protein snack alternatives among urban consumers and working professionals.
CLIF Product Expansion Fuels Performance Nutrition Retail Channel Market Growth
Active snacking demand, endurance training participation, and preference for portable nutrition are strengthening the market growth. For instance, in March 2026, CLIF expanded its energy portfolio with CLIF Energy Bites and a limited-edition Chocolate Berry energy bar for movement, adventure, and athletic performance. The launch should support trial during the forecast period, reinforce sustained-energy positioning, and help established brands defend shelf space across grocery, outdoor, sports nutrition, and online channels while supporting flavor-led extensions and athletic marketing programs.
Allergen Recall Pressures Quality Compliance Across Bar Categories Market Restraints
High allergen sensitivity, rapid flavor rotation, and wider direct-to-consumer distribution support demand, but labeling errors remain a market restraint for bar manufacturers. For instance, in February 2026, Juniper Granola recalled Chocolate Cherry and Peanut Butter Chocolate Chip Junebars in New York after undeclared milk and soy were identified. During the forecast period, similar issues may raise testing costs, delay product listings, and pressure brands to strengthen allergen controls, batch verification, and packaging reviews before retail expansion.
Ferrero Acquisition Strengthens Branded Protein Snack Portfolio Positioning Market Value
Portfolio diversification, demand for better-for-you snacks, and brand consolidation are creating market value. For instance, in January 2025, Ferrero Group signed an agreement to acquire Power Crunch from Bio-Nutritional Research Group, adding protein wafer bars and high-protein crisps to its U.S. portfolio. The acquisition should expand distribution during the forecast period, support investment in protein snack innovation, and strengthen competition between confectionery-backed players and specialist nutrition companies across impulse and planned purchase channels with retail leverage over time.
Creatine Protein Formats Drive Functional Snacking Channel Innovation Market Advancement
Demand for strength support, cleaner ingredient labels, and convenient performance formats is shaping the market landscape. For instance, in February 2026, Rello launched protein bars at Sprouts Farmers Market nationwide and introduced bars and shakes powered by patented soluble creatine technology. The launch should accelerate hybrid nutrition formats during the forecast period, encourage brands to combine protein with active ingredients, and widen consumer adoption beyond core athletes into everyday wellness, travel, and recovery occasions across multiple retail channels nationwide.
Read more about this report - REQUEST FREE SAMPLE COPY IN PDF
Conventional Segment Likely to Dominate the Market Share by Nature
The conventional segment is likely to dominate the United States energy bars market by nature, supported by broad product availability, lower price points, and strong consumer familiarity across mainstream retail channels. It held around 74% share in the historical period, reflecting steady demand from everyday shoppers seeking accessible snack options. During the forecast period, continued placement in supermarkets, convenience stores, specialty outlets, and online platforms is expected to support its leading position, especially among consumers prioritizing affordability, taste variety, and convenience.
Read more about this report - REQUEST FREE SAMPLE COPY IN PDF
Founded in 2012 and headquartered in Chicago, Illinois, United States, Mondelēz International is a global snacking leader. Its portfolio includes nutrition-oriented snack bars, biscuits, and wellness-focused products supporting the functional snacks and convenience nutrition market.
Established in 2023 and headquartered in Chicago, Illinois, United States, Kellanova focuses on global snacking and convenience foods. Its portfolio includes protein bars, cereal-based snacks, and better-for-you products catering to health-conscious consumers seeking functional nutrition.
Founded in 1928 and headquartered in Minneapolis, Minnesota, United States, General Mills is a multinational food company. Its portfolio includes protein-rich cereals, snack bars, and wellness-focused products marketed through brands serving active and health-conscious consumers.
Established in 2012 and headquartered in St. Louis, Missouri, United States, Post Holdings operates across consumer packaged foods and active nutrition. Its portfolio includes protein supplements, nutrition bars, ready-to-eat cereals, and functional snacking products.
Other key players in the market include Mars, Incorporated, Nestlé S.A., PROBAR, LLC, Glanbia plc, The Snack Company, and Bioventure FZ-LLC.
*Please note that this is only a partial list; the complete list of key players is available in the full report. Additionally, the list of key players can be customized to better suit your needs.*
This report is developed through a robust mixed-methods research design combining:
Upto 15% Off
USD
$1999 $1799
$3099 $2789
$4599 $3909
$5999 $5099


*While we strive to always give you current and accurate information, the numbers depicted on the website are indicative and may differ from the actual numbers in the main report. At Expert Market Research, we aim to bring you the latest insights and trends in the market. Using our analyses and forecasts, stakeholders can understand the market dynamics, navigate challenges, and capitalize on opportunities to make data-driven strategic decisions.*
Explore our key highlights of the report and gain a concise overview of key findings, trends, and actionable insights that will empower your strategic decisions.
| REPORT FEATURES | DETAILS |
| Base Year | 2025 |
| Historical Period | 2019-2025 |
| Forecast Period | 2026-2035 |
| Scope of the Report |
Historical and Forecast Trends, Industry Drivers and Constraints, Historical and Forecast Market Analysis by Segment:
|
| Breakup by Type |
|
| Breakup by Nature |
|
| Breakup by Distribution Channel |
|
| Market Dynamics |
|
| Supplier Landscape |
|
| Companies Covered |
|
Datasheet
One User
USD 1,999
USD 1,799
tax inclusive*
Single User License
One User
USD 3,099
USD 2,789
tax inclusive*
Five User License
Five User
USD 4,599
USD 3,909
tax inclusive*
Corporate License
Unlimited Users
USD 5,999
USD 5,099
tax inclusive*
*Please note that the prices mentioned below are starting prices for each bundle type. Kindly contact our team for further details.*
Flash Bundle
Small Business Bundle
Growth Bundle
Enterprise Bundle
*Please note that the prices mentioned below are starting prices for each bundle type. Kindly contact our team for further details.*
Flash Bundle
Number of Reports: 3
20%
tax inclusive*
Small Business Bundle
Number of Reports: 5
25%
tax inclusive*
Growth Bundle
Number of Reports: 8
30%
tax inclusive*
Enterprise Bundle
Number of Reports: 10
35%
tax inclusive*
How To Order

Select License Type
Choose the right license for your needs and access rights.

Click on ‘Buy Now’
Add the report to your cart with one click and proceed to register.

Select Mode of Payment
Choose a payment option for a secure checkout. You will be redirected accordingly.
Strategic Solutions for Informed Decision-Making
Gain insights to stay ahead and seize opportunities.

Get insights & trends for a competitive edge.

Track prices with detailed trend reports.

Analyse trade data for supply chain insights.

Leverage cost reports for smart savings

Enhance supply chain with partnerships.

Connect For More Information
Our expert team of analysts will offer full support and resolve any queries regarding the report, before and after the purchase.
Our expert team of analysts will offer full support and resolve any queries regarding the report, before and after the purchase.
We employ meticulous research methods, blending advanced analytics and expert insights to deliver accurate, actionable industry intelligence, staying ahead of competitors.
Our skilled analysts offer unparalleled competitive advantage with detailed insights on current and emerging markets, ensuring your strategic edge.
We offer an in-depth yet simplified presentation of industry insights and analysis to meet your specific requirements effectively.


