

Consumer Insights
Uncover trends and behaviors shaping consumer choices today
Procurement Insights
Optimize your sourcing strategy with key market data
Industry Stats
Stay ahead with the latest trends and market analysis.
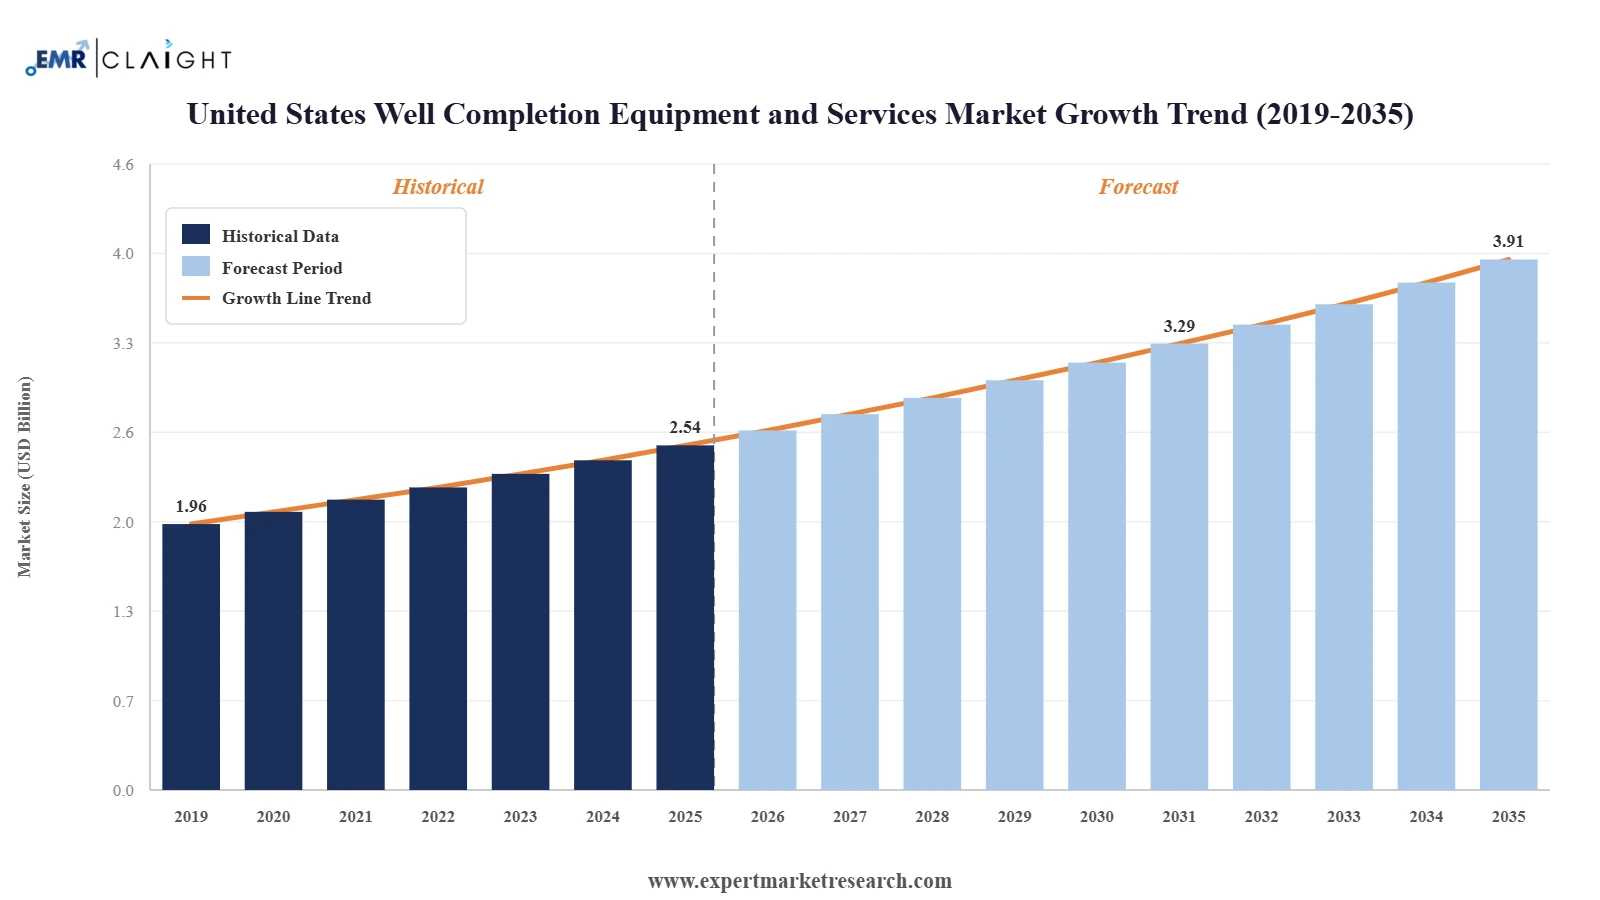
The United States well completion equipment and services market size reached approximately USD 2.54 Billion in 2025. The market is projected to grow at a CAGR of 4.40% between 2026 and 2035, reaching a value of around USD 3.91 Billion by 2035.
Read more about this report - REQUEST FREE SAMPLE COPY IN PDF
Well completion equipment and services refer to the tools, materials, and processes used to prepare an oil or gas well for production after drilling. This stage marks the transition from drilling to production within the oil and gas sector, involving a series of activities to enable the extraction of hydrocarbons from the reservoir.
The well completion equipment and services market in the United States is a pivotal segment within the broader oil and gas sector.
Meanwhile, some companies have been working on hydraulic fracturing techniques that minimise water usage or eliminate the need for water altogether. This is achieved by using alternative fracturing fluids, such as liquefied petroleum gas (LPG) or compressed air.
United States Well Completion Equipment and Services Market Report and Forecast 2026-2035 offers a detailed analysis of the market based on the following segments:
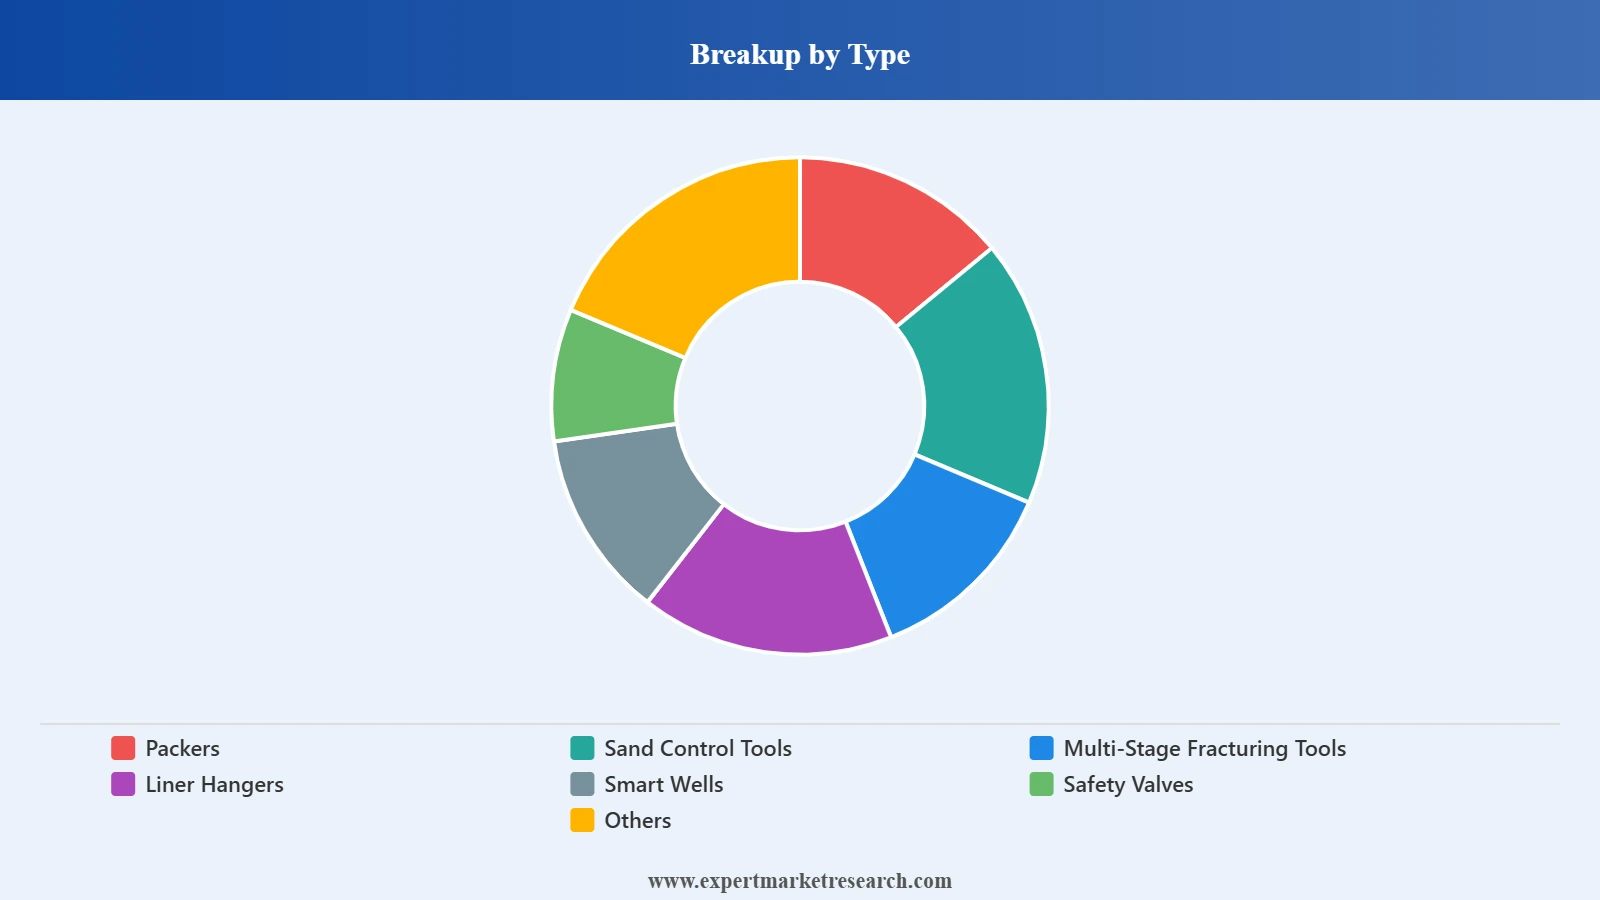
Breakup by Type
Breakup by Location of Deployment
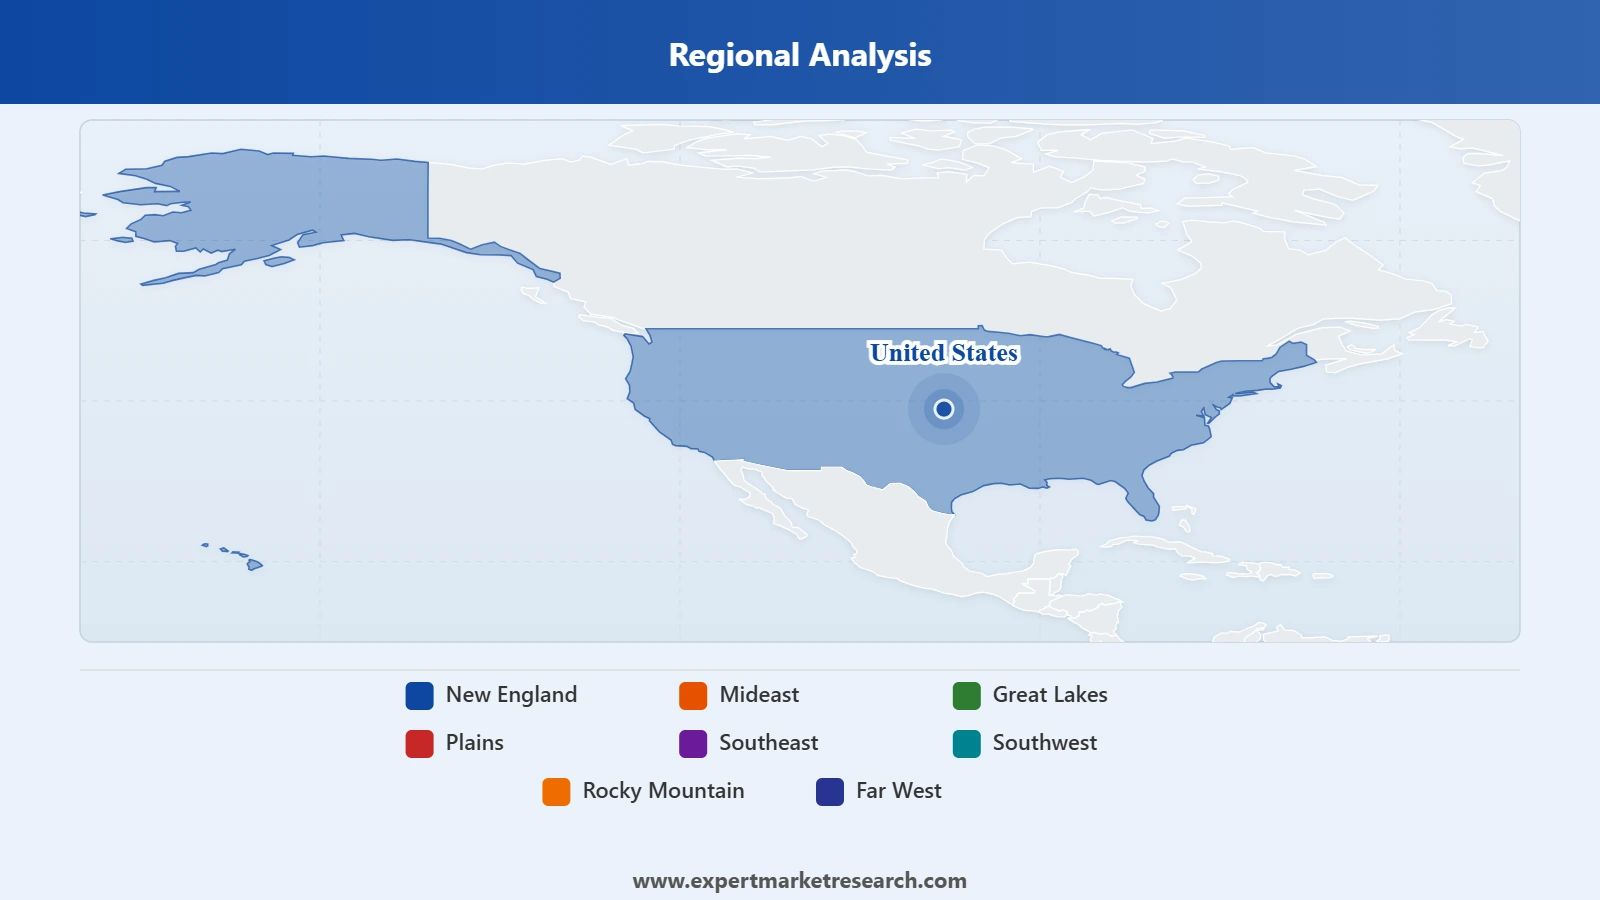
Breakup by Region


Read more about this report - REQUEST FREE SAMPLE COPY IN PDF
According to the United States well completion equipment and services market analysis, multistage fracturing tools are expected to be high in demand, as they are an effective and cost-efficient solution for horizontal fracturing in both oil and natural gas wells. These tools are used in hydraulic fracturing operations to enhance oil and gas recovery from unconventional reservoirs such as shale formations.
Unconventional reservoirs like shale have low permeability, making it challenging for oil or gas to flow freely to the wellbore. Multi-stage fracturing tools enable the creation of multiple fractures along the horizontal wellbore, increasing the contact area between the well and the reservoir. This maximises hydrocarbon extraction from the formation.
Read more about this report - REQUEST FREE SAMPLE COPY IN PDF
The southeast region is expected to occupy a major portion of the United States well completion equipment and services market share. Texas is a significant contributor to the overall revenue, due primarily to its position as the leading oil-producing state in the country. In 2022 alone, Texas contributed a staggering total of 1.5 billion barrels of crude oil as well as 11.2 trillion cubic feet of total gas. The contribution came from 160,768 oil wells and around 70,246 gas wells.
Read more about this report - REQUEST FREE SAMPLE COPY IN PDF
The comprehensive EMR report provides an in-depth assessment of the market based on Porter's five forces model along with giving a SWOT analysis. The report gives a detailed analysis of the following key players in the United States well completion equipment and services market, covering their competitive landscape and the latest developments like mergers, acquisitions, investments, and expansion plans.
Weatherford International Plc operates as a multinational oilfield service provider, offering an array of solutions across various facets of the oil and gas sector. Its specialisation lies in delivering equipment and services geared towards drilling, assessment, finalisation, production, and intervention in both oil and natural gas wells. The company's extensive suite comprises a diverse range of products, technologies, and tailored solutions aimed at meeting the specific requirements of exploration and production companies globally.
Baker Hughes Company stands as a prominent energy technology enterprise, providing comprehensive solutions tailored for the oil and gas sector. Its portfolio encompasses a wide spectrum of products and services spanning drilling, assessment, finalisation, production, and intervention processes. Renowned for its expertise, Baker Hughes excels in the development and deployment of cutting-edge technologies and solutions designed to bolster efficiency, reliability, and sustainability within oil and gas operations.
NOV Inc., also known as National Oilwell Varco, operates as a global supplier of equipment and technological solutions specifically tailored for the upstream oil and gas sector. Its specialisation lies in the conception, production, and servicing of drilling equipment, wellbore technologies, completion tools, and production equipment. NOV's offerings are dedicated to enhancing operational efficiency, safety, and performance within drilling and production endeavours.
*Please note that this is only a partial list; the complete list of key players is available in the full report. Additionally, the list of key players can be customized to better suit your needs.*
Other key players in the United States well completion equipment and services market are National Energy Services Reunited Corp., Halliburton Energy Services, Inc., Schlumberger Ltd., Welltec A/S, ChampionX Corp., Schoeller Bleckmann Oilfield Equipment AG, and Superior Energy Services, Inc., among others.
Upto 15% Off
USD
$2499 $2249
$3999 $3599
$4999 $4249
$5999 $5099


*While we strive to always give you current and accurate information, the numbers depicted on the website are indicative and may differ from the actual numbers in the main report. At Expert Market Research, we aim to bring you the latest insights and trends in the market. Using our analyses and forecasts, stakeholders can understand the market dynamics, navigate challenges, and capitalize on opportunities to make data-driven strategic decisions.*
In 2025, the market reached an approximate value of USD 2.54 Billion.
The market is projected to grow at a CAGR of 4.40% between 2026 and 2035.
The market is estimated to witness a healthy growth in the forecast period of 2026-2035 to reach a value of around USD 3.91 Billion by 2035.
The market is driven by the advancements in technology and the rising importance of sustainability within the oil and gas sector which is favoring the adoption of environmental friendly practices.
The growing exploration activities related to shale gas and tight oil are expected to propel the market development.
The major regional markets are New England, Mideast, Great Lakes, Plains, Southeast, Southwest, Rocky Mountain, and Far West.
The different types are packers, sand control tools, multi-stage fracturing tools, liner hangers, smart wells, and safety valves, among others.
The key players in the market include Weatherford International Plc, Baker Hughes Company, NOV Inc., National Energy Services Reunited Corp., Halliburton Energy Services, Inc., Schlumberger Ltd., Welltec A/S, ChampionX Corp., Schoeller Bleckmann Oilfield Equipment AG, and Superior Energy Services, Inc., among others.
Explore our key highlights of the report and gain a concise overview of key findings, trends, and actionable insights that will empower your strategic decisions.
| REPORT FEATURES | DETAILS |
| Base Year | 2025 |
| Historical Period | 2019-2025 |
| Forecast Period | 2026-2035 |
| Scope of the Report |
Historical and Forecast Trends, Industry Drivers and Constraints, Historical and Forecast Market Analysis by Segment:
|
| Breakup by Type |
|
| Breakup by Location of Deployment |
|
| Breakup by Region |
|
| Market Dynamics |
|
| Competitive Landscape |
|
| Companies Covered |
|
Datasheet
One User
USD 2,499
USD 2,249
tax inclusive*
Single User License
One User
USD 3,999
USD 3,599
tax inclusive*
Five User License
Five User
USD 4,999
USD 4,249
tax inclusive*
Corporate License
Unlimited Users
USD 5,999
USD 5,099
tax inclusive*
*Please note that the prices mentioned below are starting prices for each bundle type. Kindly contact our team for further details.*
Flash Bundle
Small Business Bundle
Growth Bundle
Enterprise Bundle
*Please note that the prices mentioned below are starting prices for each bundle type. Kindly contact our team for further details.*
Flash Bundle
Number of Reports: 3
20%
tax inclusive*
Small Business Bundle
Number of Reports: 5
25%
tax inclusive*
Growth Bundle
Number of Reports: 8
30%
tax inclusive*
Enterprise Bundle
Number of Reports: 10
35%
tax inclusive*
How To Order

Select License Type
Choose the right license for your needs and access rights.

Click on ‘Buy Now’
Add the report to your cart with one click and proceed to register.

Select Mode of Payment
Choose a payment option for a secure checkout. You will be redirected accordingly.
Strategic Solutions for Informed Decision-Making
Gain insights to stay ahead and seize opportunities.

Get insights & trends for a competitive edge.

Track prices with detailed trend reports.

Analyse trade data for supply chain insights.

Leverage cost reports for smart savings

Enhance supply chain with partnerships.

Connect For More Information
Our expert team of analysts will offer full support and resolve any queries regarding the report, before and after the purchase.
Our expert team of analysts will offer full support and resolve any queries regarding the report, before and after the purchase.
We employ meticulous research methods, blending advanced analytics and expert insights to deliver accurate, actionable industry intelligence, staying ahead of competitors.
Our skilled analysts offer unparalleled competitive advantage with detailed insights on current and emerging markets, ensuring your strategic edge.
We offer an in-depth yet simplified presentation of industry insights and analysis to meet your specific requirements effectively.


