

Consumer Insights
Uncover trends and behaviors shaping consumer choices today
Procurement Insights
Optimize your sourcing strategy with key market data
Industry Stats
Stay ahead with the latest trends and market analysis.
The global water quality sensor market was valued at USD 6.62 Billion in 2025. The industry is expected to grow at a CAGR of 5.60% during the forecast period of 2026-2035 to attain a valuation of USD 11.42 Billion by 2035.
Overview: The water quality sensor market entered Q1 2026 on a familiar trajectory and exited it having absorbed the full force of the Iran-US-Israel conflict. The near-shutdown of the Strait of Hormuz, with vessel traffic falling from 138/day to just 2 by March 5, 2026 (Z2Data), disrupted specialty chemical and materials logistics critical to electronic component manufacturing, while the unusual defense electronics production surge driven by the US arms industry having quadrupled production in the three months before Operation Epic Fury (Wikipedia) lifted demand across the water quality sensor market. The deployment of approximately 2,000 Iranian drones and 500+ ballistic missiles (Wikipedia), each requiring sophisticated electronic components, alongside the 90%+ intercept rate achieved by allied counter-systems (JINSA, March 2026) proved out the centrality of advanced electronics in modern warfare and drove accelerated procurement investment globally.
United States: US demand for water quality sensor market products during the first quarter of 2026 was elevated by defense electronics production ramp-up, with the US arms industry having quadrupled production in the three months before Operation Epic Fury (Wikipedia) requiring corresponding expansion of precision electronic component procurement across the defense supply chain. US defense prime contractors, Raytheon, Northrop Grumman, L3Harris, and Lockheed Martin, accelerated water quality sensor market procurement to support drone, missile, and weapons electronics assembly at expanded production rates. The GPS spoofing of 1,100+ ships affected by GPS spoofing and navigation failures (Resecurity) heightened US DoD investment in electronic system resilience, with anti-jamming, multi-constellation, and inertial backup technologies receiving accelerated procurement authorization. US semiconductor and electronics manufacturers also managed helium supply disruption, with helium spot prices surging 70-100% (Phil Kornbluth, CNBC, March 19, 2026) as QatarEnergy force majeure declared following Ras Laffan drone strikes on March 2, 2026, requiring fab operational adjustments and supply chain contingency activation.
Iran: The IDF's strike on IRGC satellite and navigation infrastructure (Times of Israel, March 15, 2026) demonstrated the strategic importance of electronic system superiority in modern conflict, reinforcing allied investment in advanced electronics capability. Iran's electronics manufacturing base, already constrained by sanctions, sustained further disruption from Q1 2026 strikes on industrial and defense production facilities across 26 provinces (ACLED, March 2026).
Israel: Israel's defense electronics environment, encompassing Elbit Systems, Rafael, IAI, and Mobileye, maintained production continuity throughout Q1 2026 high-tempo operations, with water quality sensor market products consumed at elevated rates across IDF platform maintenance, weapons replenishment, and autonomous system operations. Shield AI reaching a $12.7 billion valuation (CNBC, March 28, 2026) and the operational deployment of Palantir Maven AI deployed by US and allied forces (Alex Karp, CNBC, March 28, 2026) reflect the market recognition of AI-enabled electronics as proved out defense technology.
Government & Policy Watch
Market & Industry Impact
Procurement & Supply Chain Alert
Compound Annual Growth Rate
5.6%
Value in USD Billion
2026-2035
Read more about this report - REQUEST FREE SAMPLE COPY IN PDF
Asia Pacific is expected to dominate the water quality sensor market during the forecast period. The economies such as China, India, Japan, and South Korea are the key contributors to the market's growth. The growth can be attributed to the high adoption of water quality sensors in water and wastewater treatment applications. Increasing industrialisation leads to rising water pollution; thus, the demand for water quality sensors has increased. Also, growing investments and initiatives by the government such as smart cities, river protection, and smart water management systems in the region to reduce water pollution and rising strict government rules for wastewater disposal are driving the growth of the market in the region. In addition, the presence of many pharmaceutical and food and beverage companies in the region has increased the need for water treatment plants, propelling the market growth.


Water quality sensors are electrical sensing devices that measure the level of contamination in water. These sensors primarily monitor chemical concentrations and solids in water. These sensors can tolerate a wide variety of pressure and temperature while providing consistent results.
The types of water quality sensors can be divided into:
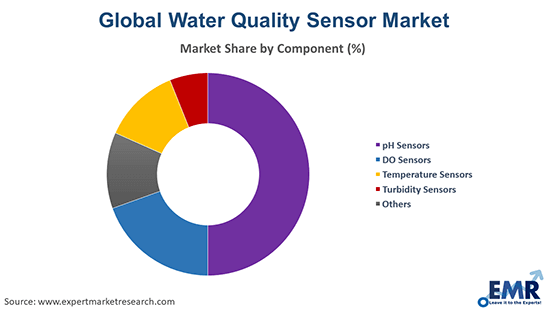
Based on component, the water quality sensor market can be divided into:
The market can be broadly categorised based on end-use into:
Market Breakup by Region
Read more about this report - REQUEST FREE SAMPLE COPY IN PDF
One of the significant market dynamics for water quality sensors impacting the industry growth is the technological development of water quality sensors. A surge in the adoption of water quality sensors to monitor water quality in rivers, sea and lakes is one of the major factors driving the growth of the global market. Increasing significance of water quality sensors in applications such as potable water monitoring, pollution level detection and chemical leakage detection large water sources such as rivers, rising demand for rugged and industrial grade water quality sensors, growing market for various sensing devices, growing awareness among users and stringent government regulations to control water pollution are expected to accelerate the growth of the market during the forecast period. Further, digitalisation, automation, and electrification are laying the foundation for efficient, reliable, and sustainable processes in the water industry. Rapid urbanisation and industrial development have resulted in water contamination and water quality deterioration at an alarming rate; therefore, its quick and inexpensive detection has become vital. This is augmenting the growth of the global water quality sensors market.
The report gives a detailed analysis of the following key players in the global water quality sensor market, covering their competitive landscape, capacity, and latest developments like mergers, acquisitions, and investments, expansions of capacity, and plant turnarounds:
The comprehensive EMR report provides an in-depth assessment of the market based on the Porter's five forces model along with giving a SWOT analysis.
Upto 15% Off
USD
$2499 $2249
$3999 $3599
$4999 $4249
$5999 $5099


*While we strive to always give you current and accurate information, the numbers depicted on the website are indicative and may differ from the actual numbers in the main report. At Expert Market Research, we aim to bring you the latest insights and trends in the market. Using our analyses and forecasts, stakeholders can understand the market dynamics, navigate challenges, and capitalize on opportunities to make data-driven strategic decisions.*
The global water quality sensor market is expected to grow at a CAGR of about 5.60% in the forecast period of 2026-2035.
The major drivers of the market include the rising use of recycled and treated water for industrial purposes, rapid urbanisation and industrial development, increase in automatic pool cleaning systems, health and safety regulations at industrial facilities, and increased awareness about water pollution and contamination.
The technological development of water quality sensors and the continuous development of better water quality sensors by the market vendors in order to gain a competitive edge are the key trends guiding the growth of the industry.
The major regions in the industry are North America, Latin America, the Middle East and Africa, Europe, and the Asia Pacific.
Handheld meters, multiparameter sondes, conductivity meters, temperature, and depth loggers (CTD), automatic water samplers, single parameter sensors, online/process monitors, and colorimeters, among others are the significant types of the product in the market.
pH sensors, DO sensors, temperature sensors, and turbidity sensors, among others are the major components in the market.
Utility, household sectors, agricultural sectors, and aqua culture, among others are the different end-uses of the product in the market.
The major players in the industry are YSI Inc. / Xylem Inc., ABB Ltd, Horiba, Ltd., Oakton Instruments, Pentair Aquatic Eco-Systems, Inc., Thermo Fisher Scientific Inc., Shimadzu Corporation, and Danaher Corporation, among others.
In 2025, the market attained a value of nearly USD 6.62 Billion.
The market is estimated to witness a healthy growth in the forecast period of 2026-2035 to reach about USD 11.42 Billion by 2035.
Explore our key highlights of the report and gain a concise overview of key findings, trends, and actionable insights that will empower your strategic decisions.
| REPORT FEATURES | DETAILS |
| Base Year | 2025 |
| Historical Period | 2019-2025 |
| Forecast Period | 2026-2035 |
| Scope of the Report |
Historical and Forecast Trends, Industry Drivers and Constraints, Historical and Forecast Market Analysis by Segment:
|
| Breakup by Type |
|
| Breakup by Component |
|
| Breakup by End-Use |
|
| Breakup by Region |
|
| Market Dynamics |
|
| Competitive Landscape |
|
| Companies Covered |
|
| Report Price and Purchase Option | Explore our purchase options that are best suited to your resources and industry needs. |
| Delivery Format | Delivered as an attached PDF and Excel through email, with an option of receiving an editable PPT, according to the purchase option. |
Datasheet
One User
USD 2,499
USD 2,249
tax inclusive*
Single User License
One User
USD 3,999
USD 3,599
tax inclusive*
Five User License
Five User
USD 4,999
USD 4,249
tax inclusive*
Corporate License
Unlimited Users
USD 5,999
USD 5,099
tax inclusive*
*Please note that the prices mentioned below are starting prices for each bundle type. Kindly contact our team for further details.*
Flash Bundle
Small Business Bundle
Growth Bundle
Enterprise Bundle
*Please note that the prices mentioned below are starting prices for each bundle type. Kindly contact our team for further details.*
Flash Bundle
Number of Reports: 3
20%
tax inclusive*
Small Business Bundle
Number of Reports: 5
25%
tax inclusive*
Growth Bundle
Number of Reports: 8
30%
tax inclusive*
Enterprise Bundle
Number of Reports: 10
35%
tax inclusive*
How To Order

Select License Type
Choose the right license for your needs and access rights.

Click on ‘Buy Now’
Add the report to your cart with one click and proceed to register.

Select Mode of Payment
Choose a payment option for a secure checkout. You will be redirected accordingly.
Strategic Solutions for Informed Decision-Making
Gain insights to stay ahead and seize opportunities.

Get insights & trends for a competitive edge.

Track prices with detailed trend reports.

Analyse trade data for supply chain insights.

Leverage cost reports for smart savings

Enhance supply chain with partnerships.

Connect For More Information
Our expert team of analysts will offer full support and resolve any queries regarding the report, before and after the purchase.
Our expert team of analysts will offer full support and resolve any queries regarding the report, before and after the purchase.
We employ meticulous research methods, blending advanced analytics and expert insights to deliver accurate, actionable industry intelligence, staying ahead of competitors.
Our skilled analysts offer unparalleled competitive advantage with detailed insights on current and emerging markets, ensuring your strategic edge.
We offer an in-depth yet simplified presentation of industry insights and analysis to meet your specific requirements effectively.


