

Consumer Insights
Uncover trends and behaviors shaping consumer choices today
Procurement Insights
Optimize your sourcing strategy with key market data
Industry Stats
Stay ahead with the latest trends and market analysis.
The global wave energy market value reached USD 89.74 Million in 2025. The industry is expected to grow at a CAGR of 19.30% during the forecast period of 2026-2035 to attain a valuation of USD 524.07 Million by 2035.
Compound Annual Growth Rate
19.3%
Value in USD Million
2026-2035
Read more about this report - REQUEST FREE SAMPLE COPY IN PDF
| Global Wave Energy Market Report Summary | Description | Value |
| Base Year | USD Million | 2025 |
| Historical Period | USD Million | 2019-2025 |
| Forecast Period | USD Million | 2026-2035 |
| Market Size 2025 | USD Million | 89.74 |
| Market Size 2035 | USD Million | 524.07 |
| CAGR 2019-2025 | Percentage | XX% |
| CAGR 2026-2035 | Percentage | 19.30% |
| CAGR 2026-2035 - Market by Region | Europe | 22.2% |
| CAGR 2026-2035 - Market by Country | UK | 22.9% |
| CAGR 2026-2035 - Market by Country | France | 20.3% |
| CAGR 2026-2035 - Market by Application | Water Desalination | 22.0% |
| CAGR 2026-2035 - Market by Location | Offshore | 19.8% |
Wave energy is the transportation and capturing of energy by ocean surface waves using wave energy generators. The energy captured is further used to perform various activities, such as electricity generation, water desalination, and pumping of water. Wave energy is a renewable resource that helps significantly cut greenhouse gas emissions from traditional power generation methods, driving the wave energy demand growth.
The wave energy industry growth is being boosted by the rising demand for renewable energy and the increasing availability of accessible wave energy, which has spurred greater investment in the industry. Wave energy is generated from the ocean’s wave movements, with wave energy generators capturing this energy and converting it into electricity using turbines and generators.
The wave energy market dynamics and trends are driven due to the high demand for renewable energy sources driven by both private and public sectors. As a developing field, the wave energy industry is set to see substantial investment in research and development, which will enhance efficiency and reduce costs.


Read more about this report - REQUEST FREE SAMPLE COPY IN PDF
As per the International Renewable Energy Agency, in 2019, the global renewable energy capacity was 2,538,441 MW, which increased to 2,799,094 MW in 2020, reflecting a significant global expansion of 10.3% within just one year. In Africa, renewable energy capacity grew from 51,125 MW in 2019 to 53,685 MW in 2020, marking an increase of approximately 5%. Countries such as Egypt and Ethiopia were key contributors to this increase. Egypt’s capacity rose from 5,948 MW in 2019 to 5,980 MW in 2020. Ethiopia saw its capacity expand from 4,451 MW in 2019 to 4,713 MW in 2020, representing a significant 5.9% increase. Morocco’s renewable energy capacity experienced an increase from 3,267 MW in 2019 to 3,447 MW in 2020, indicating a 5.5% growth. Kenya also showed a steady increase, with capacity rising from 2,191 MW in 2019 to 2,191 MW in 2020, maintaining its position as a leading renewable energy producer in East Africa. In Southern Africa, South Africa's renewable energy capacity increased from 8,011 MW in 2019 to 9,639 MW in 2020. Namibia’s renewable energy capacity grew from 497 MW in 2019 to 501 MW in 2020. In 2020, West African countries, including Ghana, saw their capacity rise to 1,663 MW from 1,656 MW in 2019, boosting the wave energy market revenue. Wave energy, which captures the power of ocean waves to produce electricity, plays a significant role in the renewable energy mix.
Further, in 2019, the total renewable energy capacity in the European Union reached 497,890 MW; by 2020, it expanded to 528,530 MW, marking an increase of approximately 6%. Poland experienced a remarkable surge in renewable energy capacity, growing from 9,360 MW in 2019 to 12,220 MW in 2020, an impressive 30.5% increase. Spain, a major player in the European renewable energy sector, increased its capacity from 54,778 MW in 2019 to 59,108 MW in 2020, reflecting a growth of 7.9%. The United Kingdom increased its renewable energy capacity from 46,800 MW in 2019 to 47,676 MW in 2020, marking a 1.9% rise. This expansion is fuelling the wave energy industry revenue, which is growing due to technological advancements that enhance efficiency and lower costs. This growth is supported by rising investments in renewable energy infrastructure and a global commitment to reducing carbon emissions.
NEMOS GmbH
CorPower Ocean AB
Ocean Power Technologies, Inc.
SINN Power GmbH
Read more about this report - REQUEST FREE SAMPLE COPY IN PDF
“Global Wave Energy Market Report and Forecast 2026-2035” offers a detailed analysis of the market based on the following segments:
Market Breakup by Technology
Market Breakup by Location
Market Breakup by Application
Market Breakup by Region
| CAGR 2026-2035 - Market by | Country |
| UK | 22.9% |
| France | 20.3% |
| USA | 20.1% |
| Brazil | 17.9% |
| Australia | 17.6% |
| Canada | XX% |
| Germany | XX% |
| Italy | XX% |
| China | XX% |
| Japan | XX% |
| India | XX% |
| Saudi Arabia | XX% |
| South Africa | 17.0% |
The growth of the wave energy industry is driven by several factors. Pumping water in wave energy systems helps store energy for periods of low wave activity or high demand, boosts system efficiency, and may enhance overall energy production. Additionally, wave energy reduces carbon emissions, minimizes pollution relative to fossil fuels, and offers a sustainable, renewable energy source that aids in long-term environmental conservation and protection.
The companies specialise in innovative wave energy technologies, focusing on the design and development of advanced systems for harnessing ocean waves to generate renewable energy.
Upto 15% Off
USD
$2499 $2249
$3999 $3599
$4999 $4249
$5999 $5099


*While we strive to always give you current and accurate information, the numbers depicted on the website are indicative and may differ from the actual numbers in the main report. At Expert Market Research, we aim to bring you the latest insights and trends in the market. Using our analyses and forecasts, stakeholders can understand the market dynamics, navigate challenges, and capitalize on opportunities to make data-driven strategic decisions.*
In 2025, the global wave energy market attained a value of nearly USD 89.74 Million.
The market is projected to grow at a CAGR of 19.30% between 2026 and 2035.
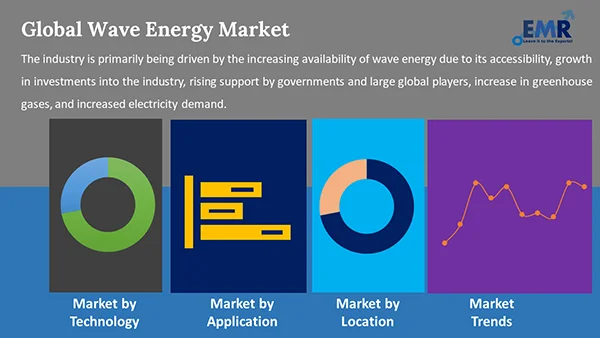
The industry is primarily being driven by the increasing availability of wave energy due to its accessibility, growth in investments into the industry, rising support by governments and large global players, increase in greenhouse gases, and increased electricity demand.
The key trends propelling the industry’s growth are the growing environmental concerns about carbon emissions and the growing demand for alternative and clean energy sources.
The market is broken down into North America, Europe, Asia Pacific, Latin America, the Middle East, and Africa.
By technology, the market is divided into oscillating water columns, oscillating body converters, and overtopping converters.
On the basis of location, the industry can be categorised into onshore, offshore, and nearshore.
The market is segmented into power generation, water desalination, pumping of water, and environmental protection, based on applications.
The competitive landscape consists of NEMOS GmbH, CorPower Ocean AB, Ocean Power Technologies, Inc., SINN Power GmbH, and AWS Ocean Energy Ltd., among others.
The market is estimated to witness healthy growth in the forecast period of 2026-2035, reaching a value of around USD 524.07 Million by 2035.
Explore our key highlights of the report and gain a concise overview of key findings, trends, and actionable insights that will empower your strategic decisions.
| REPORT FEATURES | DETAILS |
| Base Year | 2025 |
| Historical Period | 2019-2025 |
| Forecast Period | 2026-2035 |
| Scope of the Report |
Historical and Forecast Trends, Industry Drivers and Constraints, Historical and Forecast Market Analysis by Segment:
|
| Breakup by Technology |
|
| Breakup by Location |
|
| Breakup by Application |
|
| Breakup by Region |
|
| Market Dynamics |
|
| Competitive Landscape |
|
| Companies Covered |
|
| Report Price and Purchase Option | Explore our purchase options that are best suited to your resources and industry needs. |
| Delivery Format | Delivered as an attached PDF and Excel through email, with an option of receiving an editable PPT, according to the purchase option. |
Datasheet
One User
USD 2,499
USD 2,249
tax inclusive*
Single User License
One User
USD 3,999
USD 3,599
tax inclusive*
Five User License
Five User
USD 4,999
USD 4,249
tax inclusive*
Corporate License
Unlimited Users
USD 5,999
USD 5,099
tax inclusive*
*Please note that the prices mentioned below are starting prices for each bundle type. Kindly contact our team for further details.*
Flash Bundle
Small Business Bundle
Growth Bundle
Enterprise Bundle
*Please note that the prices mentioned below are starting prices for each bundle type. Kindly contact our team for further details.*
Flash Bundle
Number of Reports: 3
20%
tax inclusive*
Small Business Bundle
Number of Reports: 5
25%
tax inclusive*
Growth Bundle
Number of Reports: 8
30%
tax inclusive*
Enterprise Bundle
Number of Reports: 10
35%
tax inclusive*
How To Order

Select License Type
Choose the right license for your needs and access rights.

Click on ‘Buy Now’
Add the report to your cart with one click and proceed to register.

Select Mode of Payment
Choose a payment option for a secure checkout. You will be redirected accordingly.
Strategic Solutions for Informed Decision-Making
Gain insights to stay ahead and seize opportunities.

Get insights & trends for a competitive edge.

Track prices with detailed trend reports.

Analyse trade data for supply chain insights.

Leverage cost reports for smart savings

Enhance supply chain with partnerships.

Connect For More Information
Our expert team of analysts will offer full support and resolve any queries regarding the report, before and after the purchase.
Our expert team of analysts will offer full support and resolve any queries regarding the report, before and after the purchase.
We employ meticulous research methods, blending advanced analytics and expert insights to deliver accurate, actionable industry intelligence, staying ahead of competitors.
Our skilled analysts offer unparalleled competitive advantage with detailed insights on current and emerging markets, ensuring your strategic edge.
We offer an in-depth yet simplified presentation of industry insights and analysis to meet your specific requirements effectively.


