Consumer Insights
Uncover trends and behaviors shaping consumer choices today
Procurement Insights
Optimize your sourcing strategy with key market data
Industry Stats
Stay ahead with the latest trends and market analysis.
The wind tunnel market was valued at USD 2.40 Billion in 2025. The market is expected to grow at a CAGR of 6.80% during the forecast period of 2026-2035 to reach a value of USD 4.63 Billion by 2035. Rising government spending on hypersonic and aerospace test infrastructure, automotive aerodynamic development, and facility modernization is collectively driving the market growth.
The current wind tunnel market dynamics reflect rising government spending on hypersonic and aerospace test infrastructure. The FY2026 National Defense Authorization Act, enacted as Public Law 119-60, set a topline of USD 890.6 billion and required an evaluation of a continental United States corridor for hypersonic and long-range weapons testing. The FY2027 budget request reported by Arms Control Today raised Navy Conventional Prompt Strike funding to USD 2.1 billion from USD 772 million, and Army Long-Range Hypersonic Weapon funding to USD 749 million. These weapons programs need ground test capacity, so tunnel builders with proven hypersonic designs, strong controls expertise, and reliable delivery are better placed to win multiyear projects.
The overall wind tunnel market value is also supported by wider public spending on defense and industrial capability. According to the Stockholm International Peace Research Institute, world military expenditure reached USD 2,887 billion in 2025, up 2.9% in real terms, which keeps aircraft, missile, and space programs well-funded. The European Union's SAFE instrument adds up to EUR 150 billion in loans for joint defense purchases, and such funding can reach test facilities that support new platforms. Buyers weigh speed range, flow quality, availability, and lifecycle cost, so operators and builders with flexible, well-maintained tunnels can convert this funding into long term test contracts.
Compound Annual Growth Rate
6.8%
Value in USD Billion
2026-2035
Read more about this report - REQUEST FREE SAMPLE COPY IN PDF
|
Wind Tunnel Market Report Summary |
Description |
Value |
|
Base Year |
USD Billion |
2025 |
|
Historical Period |
USD Billion |
2019-2025 |
|
Forecast Period |
USD Billion |
2026-2035 |
|
Market Size 2025 |
USD Billion |
2.40 |
|
Market Size 2035 |
USD Billion |
4.63 |
|
CAGR 2019-2025 |
Percentage |
XX% |
|
CAGR 2026-2035 |
Percentage |
6.80% |
|
CAGR 2026-2035 - Market by Region |
Asia Pacific |
8.4% |
|
CAGR 2026-2035 - Market by Type |
Hypersonic |
10.8% |
|
CAGR 2026-2035 - Market by Configuration |
Open Circuit |
7.4% |
|
2025 Market Share by Region |
Europe |
27.0% |
The wind tunnel market is being shaped by Heriot-Watt University's new Edinburgh tunnel, North Wind's Minnesota hypersonic test campus, NASA's Flight Dynamics Research Facility, and the Indian Institute of Science's upgraded open circuit tunnel. New facilities, upgrades, and hypersonic test capacity are steadily and further reshaping the competitive landscape for tunnel builders, operators, test service providers, and research users worldwide.
Heriot-Watt University installed a new medium sized wind tunnel in its James Nasmyth Building in Edinburgh in August 2026, fitted with a drag force sensor and ProCap flow visualization. It became available for the 2026 to 2027 academic year, and a larger second tunnel was due by the end of July 2027. Universities across the wind tunnel market can leverage this by expanding aerodynamics teaching.
North Wind broke ground in August 2026 on its hypersonic and aero-thermal test campus in Rosemount in Dakota County, Minnesota. Phase 1 was valued at about USD 191.5 million, including USD 49.95 million from Minnesota's Forward Fund, with full campus operations targeted for 2030. Hypersonic developers across the wind tunnel market can leverage this by booking early test capacity there and easing long test queues.
NASA opened its Flight Dynamics Research Facility in Hampton, Virginia, in July 2026, its first major new wind tunnel in over 40 years. The vertical tunnel had a 20-foot test chamber, four 750 horsepower motors, and a top speed of 117 miles per hour. Aircraft and drone developers across the wind tunnel market can leverage this by testing handling and stability at higher speeds.
The Indian Institute of Science inaugurated an upgraded open circuit wind tunnel in January 2026; with a 14 foot by 9-foot test section and top speed raised from 45 to 70 meters per second. A new fan, motor, and drive system was installed, funded mainly by TVS Motors. Automotive and aerospace researchers can leverage this by running larger models.
Rising hypersonic weapon programs across the wind tunnel market are straining test capacity, so agencies are bringing dormant tunnels back into service. For example, in March 2026, the US Air Force Test Center issued a source sought notice for a contractor to reactivate the hypersonic tunnel at NASA's Neil Armstrong Test Facility in Sandusky, Ohio, able to simulate speeds up to Mach 7 and has been idle since 2007. Reactivation was expected to take 18 to 24 months, adding scarce capacity for defense test programs.
Engineers validate computational models against measured tunnel data so fewer physical runs are needed. Following such trends, in April 2026, TotalSim and Ohio State University presented SAE paper 2026-01-0610 at the WCX congress in Detroit, validating a three-dimensional simulation of the HALO wind tunnel against empty tunnel measurements. The study compared detached eddy simulation and Reynolds averaged models against measured pressure, shear layer, and ground boundary layer data, giving carmakers more confidence in simulation before booking costly tunnel time.
Public programs across the wind tunnel market are modernizing national test infrastructure that was built decades ago. Demonstrating this shift, in June 2026, the FUTURE project began, with an EU contribution of EUR 15.45 million running to May 2030. Coordinated by NLR of the Netherlands, it brings together partners including DNW, ONERA, and ETW to improve several strategic EU wind tunnels, helping European facilities remain competitive against newer builds elsewhere today. Such funding also spreads upgrade costs across national operators, research bodies, and industrial users.
Unmanned aircraft and low altitude vehicles across the wind tunnel market need testing in unsteady air, not only steady flow. As an illustration, in August 2026, the University of Saskatchewan announced a new tunnel built around a wall of 900 individually controlled fans, each 3 inches by 3 inches, funded through the Canada Foundation for Innovation. Planned uses include drone flight, crop wind forces, agricultural spraying, and recreating storms, wind shear, and turbulence, which fixed speed steady flow tunnels cannot easily reproduce for researchers today.
Moving ground planes across the wind tunnel market reproduce road conditions more accurately than fixed floors, which matters as efficiency targets tighten. For instance, in March 2026, Ford detailed its rolling road tunnel, which used a five-belt moving ground plane that could be swapped to a single belt in four hours, reached 200 mph on its small nozzle, and held 40% scale models on two robotic arms, after a reported investment of USD 140 million, showing how automakers still fund large facilities even today.
The Expert Market Research's report titled "Wind Tunnel Market Report and Forecast 2026-2035" offers a detailed analysis of the market based on the following segments:
Market Breakup by Type
Key Insight: Subsonic tunnels dominate the wind tunnel market by type, supported by wide use across cars, buildings, drones, and general aircraft, while hypersonic tunnels are the fastest growing as defense programs need Mach 5 plus test capacity. Transonic tunnels serve commercial and military aircraft near the speed of sound, and supersonic tunnels support missile and engine work. Showing demand for multi speed capability, in July 2026, India's DRDO moved to procure detailed engineering for a trisonic blow-down tunnel at RCI Hyderabad, covering Mach 0.2 to 4.5 with a 1.6 meter by 1.6-meter test section.
Market Breakup by Configuration
Key Insight: Closed circuit tunnels dominate the wind tunnel market by configuration, as recirculated air gives stable flow, higher speeds, and lower energy use per test, while open circuit tunnels are the fastest growing because they are cheaper and simpler to build for teaching and research. Showing the continued use of closed designs for research, in September 2026, the University of Auckland highlighted its closed loop boundary layer tunnel, about 24 meters long with a top speed of 18.9 meters per second, a rolling road, and a turntable.
Market Breakup by Application
Key Insight: Aerospace and defense dominate the wind tunnel market by application, while automotive is the fastest growing on aerodynamic efficiency and electric vehicle range goals. Wind energy and civil engineering use tunnels to test turbines, buildings, and bridges under gusts, and others include sports, drones, and entertainment. Showing growth in the others group, in May 2026, iFLY reopened its renovated NEC campus venue in Birmingham, with a 12-foot circular glass tunnel and the UK's first single loop air circulation system.
Market Breakup by Region
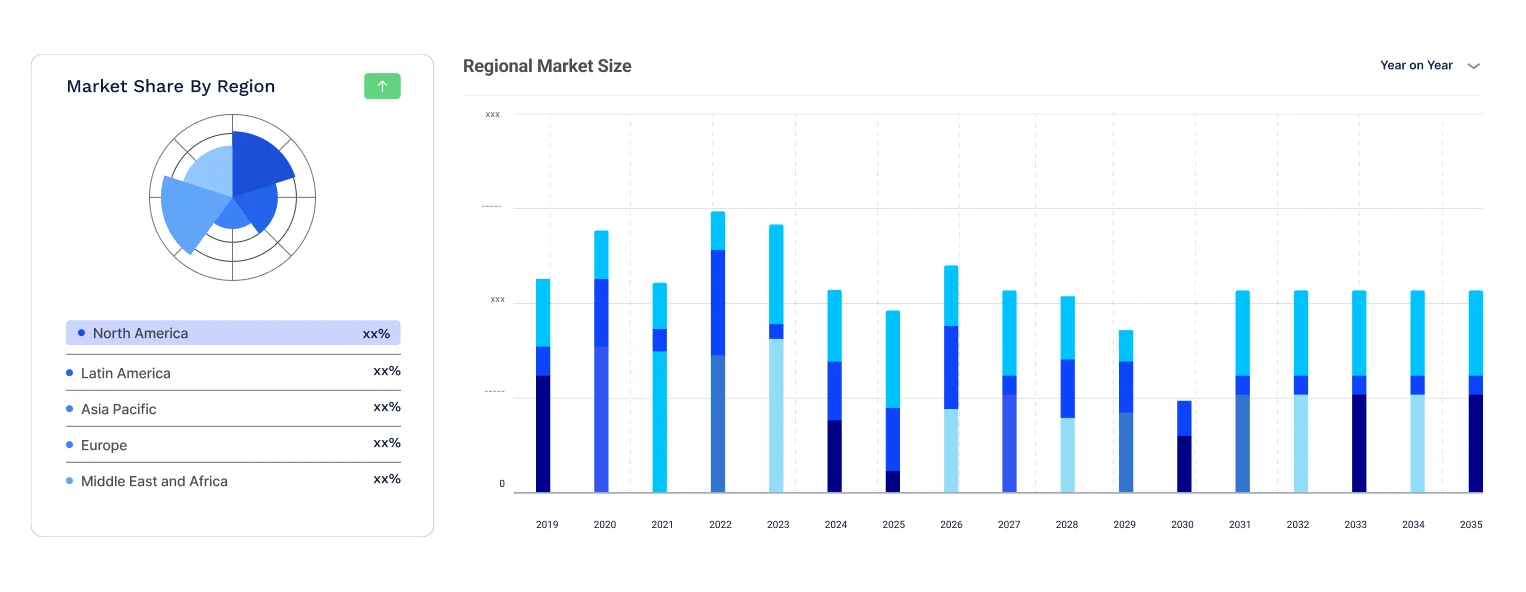
Key Insight: North America dominates the wind tunnel market on its large government and commercial tunnel base, while Asia Pacific is the fastest growing on aerospace, defense, and automotive buildouts. Europe holds a strong share through aerospace and motorsport clusters, Latin America grows from a small base on university tunnels, and the Middle East and Africa add demand from defense and testing investments. Showing steady European motorsport investment, in October 2026, Red Bull Racing said its new Milton Keynes wind tunnel was expected to come online during the 2027 season.
Read more about this report - REQUEST FREE SAMPLE COPY IN PDF
By type, subsonic tunnels dominate on broad use across aircraft, automotive, building, and teaching work
Subsonic tunnels account for the largest share of the wind tunnel market by type, because most testing of cars, buildings, drones, wind turbines, and general aviation aircraft happens at speeds well below the speed of sound. These tunnels cost less to build and run than high speed designs, so universities, automakers, and engineering firms operate them in large numbers. Many tunnels also stay in use for decades, supporting steady upgrade, calibration, and maintenance spending across the whole global installed base.
Hypersonic tunnels are the fastest growing type as defense programs need ground test capacity for vehicles flying above Mach 5, while transonic and supersonic tunnels follow, supporting aircraft, missile, and engine testing, and subsonic tunnels grow more slowly. In November 2026, Florida State University began construction of an aerospace research and manufacturing facility in Panama City, backed by a USD 98.4 million Triumph Gulf Coast grant, with a hypersonic wind tunnel planned for a later phase of the project overall.
By configuration, closed circuit tunnels dominate on stable flow, high speed capability, and lower energy use
Closed circuit tunnels account for the largest share of the wind tunnel market by configuration, because recirculating the air gives high speeds with lower fan power, steadier flow quality, and better control of temperature and turbulence. Large aerospace, defense, and automotive facilities favor this design for repeatable results and lower energy use per test hour. Higher build cost is accepted, as these tunnels serve high value programs for decades and need fewer fan upgrades, which lowers total lifetime operating cost.
Open circuit tunnels are the fastest growing configuration as universities and small firms seek lower cost, simpler facilities for teaching and applied research, while closed circuit designs grow steadily on large programs. In July 2026, the Federal University of Santa Maria in Brazil designed an open circuit tunnel for a Chilean university, with a 0.6 meter by 0.6 meter by 1.5-meter test section, a 60 meters per second top speed, and flow uniformity above 99% and turbulence below 0.3%.
By application, aerospace and defense dominates as aircraft, missiles, and space vehicles need ground testing
Aerospace and defense accounts for the largest share of the wind tunnel market by application, because aircraft, missiles, rockets, and space vehicles all need ground testing before flight. Governments and manufacturers fund large facilities across subsonic to hypersonic speeds, and test programs run for many years. Safety rules, certification needs and rising hypersonic work keep this segment the main source of tunnel investment and operating contracts, and large facilities in this group are often funded by national government agencies directly.
Automotive is the fastest growing application as carmakers chase lower drag and longer electric vehicle range, while wind energy and civil engineering and other uses, such as sports and indoor skydiving, grow at a steadier pace. In June 2026, the Automotive Research Association of India certified the Mercedes-Benz India wind tunnel facility, which has a flat belt dynamometer, for road load assessment. Wind energy and civil engineering come from turbine, building, and bridge studies, while other uses add small orders.
North America dominates the market due to its large government and commercial tunnel base
North America dominates the wind tunnel market, as the United States runs the largest set of government, university, and commercial tunnels, led by NASA, the Air Force, and major defense contractors. Automakers and racing teams add demand for full scale and rolling road facilities. Steady federal funding for hypersonic test infrastructure and the modernization of aging facilities keeps the region ahead in value. Canada adds university and agricultural research tunnels, while Mexico supports automotive testing linked to regional vehicle plants.
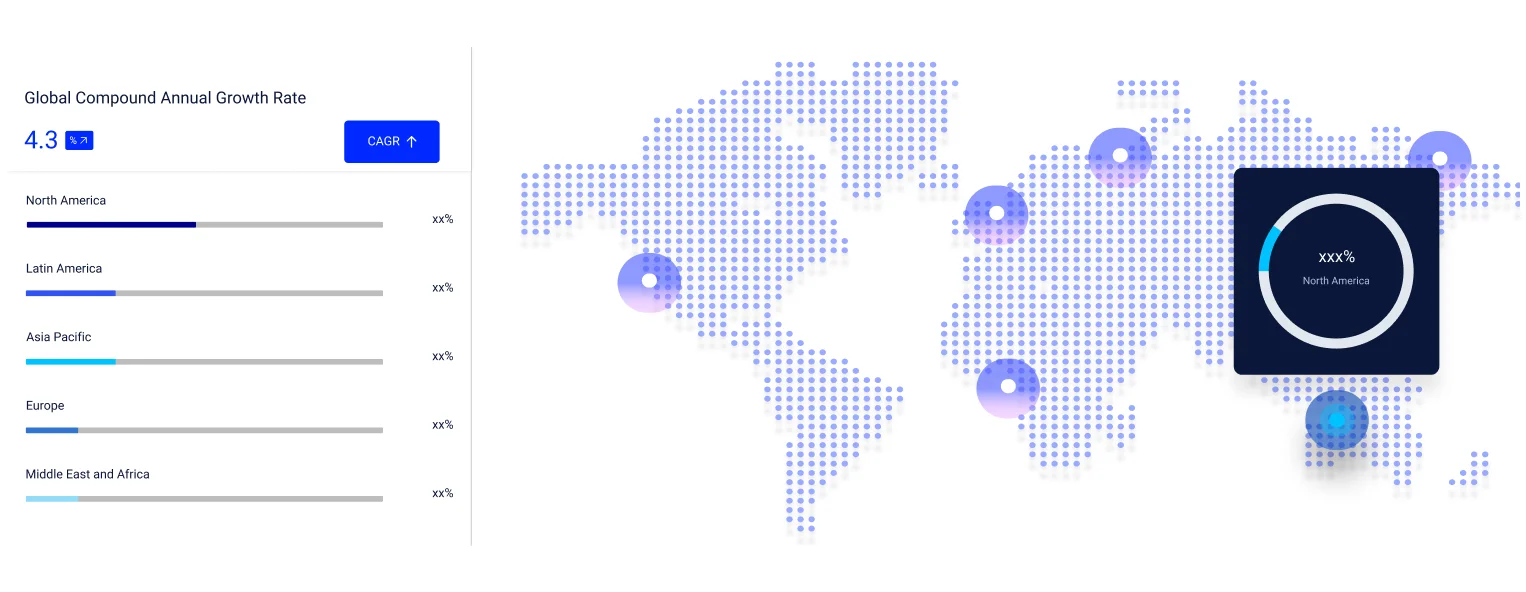
Asia Pacific is the fastest growing region as China, India, Japan, and South Korea expand aerospace, defense, and automotive programs and build new research tunnels. Europe holds a strong share through established aerospace and motorsport clusters, while Latin America and the Middle East and Africa grow from smaller bases as universities, defense agencies, and carmakers add new facilities. In May 2026, China's GWM unveiled a USD 42 million climatic wind tunnel and a USD 71 million safety and testing laboratory.
|
CAGR 2026-2035 - Market by |
Region |
|
North America |
6.2% |
|
Europe |
6.4% |
|
Asia Pacific |
8.4% |
|
Latin America |
5.6% |
|
Middle East and Africa |
7.0% |
The global wind tunnel market is competitive, as wind tunnel market players include specialist tunnel builders, test service operators, and engineering groups serving aerospace, defense, automotive, and civil clients, each competing on test capability, uptime, and delivery. Companies like Calspan Corporation, MTS Systems Corporation, Windshear, Inc., and Jacobs Solutions Inc. lead through proven facilities and technical depth, while Aero Systems Engineering, Inc., Aerolab, LLC, and AVL List GmbH add specialist tunnels, systems, and engineering services.
Leading wind tunnel market companies are differentiating through rolling road systems, hypersonic capability, digital twin integration, and facility modernization. Several are also expanding capacity, upgrading aging tunnels, and forming partnerships with governments and universities to win long term projects. Buyers weigh test accuracy, speed range, availability, and lifecycle cost when choosing a supplier or test partner, so operators with flexible, well-maintained facilities hold an advantage in winning repeat business.
Calspan Corporation, headquartered in Buffalo, New York, was founded in 1946 as Cornell Aeronautical Laboratory. It operates the 8 by 8-foot Transonic Wind Tunnel in Buffalo, which received more than USD 6 million of announced upgrades in January 2020. Its hypersonic and test systems units were sold by TransDigm to Cerberus in 2024, forming North Wind.
MTS Systems Corporation, headquartered in Eden Prairie, Minnesota, was founded in 1966. It supplies Flat-Trac rolling road belt systems for automotive wind tunnels, with at least 27 rolling road systems delivered. It supplied the moving ground system for the FKFS Stuttgart tunnel in 2014, and its Test and Simulation business was sold by Amphenol to ITW in 2021.
Windshear, Inc., headquartered in Concord, North Carolina, was founded in 2008. Its full-scale rolling road automotive tunnel opened in September 2008 and reaches 180 miles per hour, driven by a 3.8-megawatt fan and a 3.2 by 9-meter belt supplied by MTS. The facility supports full scale aerodynamic development for vehicle makers.
Jacobs Solutions Inc., headquartered in Dallas, Texas, was founded in 1947. It designs, builds, and maintains aerodynamic test facilities, including design and construction for BMW's aerodynamic test center in Germany. In January 2024, a USD 41 million NASA task order began upgrading the 11 by 11 foot transonic and 9 by 7-foot supersonic tunnels at NASA Ames.
Other key players in the market report include Aero Systems Engineering, Inc., Aerolab, LLC, and AVL List GmbH, among others.
*Please note that this is only a partial list; the complete list of key players is available in the full report. Additionally, the list of key players can be customized to better suit your needs.*
Discover the key trends shaping the wind tunnel market 2026-2035 through our in-depth report. Access strategic insights, forward looking forecasts, and major market developments that help you stay ahead of competitors. Request a free sample report or speak with our team for tailored guidance on the wind tunnel market trends 2026.


Upto 15% Off
USD
$2499 $2249
$3999 $3599
$4999 $4249
$5999 $5099


*While we strive to always give you current and accurate information, the numbers depicted on the website are indicative and may differ from the actual numbers in the main report. At Expert Market Research, we aim to bring you the latest insights and trends in the market. Using our analyses and forecasts, stakeholders can understand the market dynamics, navigate challenges, and capitalize on opportunities to make data-driven strategic decisions.*
In 2025, the wind tunnel market reached an approximate value of USD 2.40 Billion.
The market is projected to grow at a CAGR of 6.80% between 2026 and 2035.
The key players in the market include Calspan Corporation, MTS Systems Corporation, Windshear, Inc., Jacobs Solutions Inc., Aero Systems Engineering, Inc., Aerolab, LLC, and AVL List GmbH, among others.
Leading companies are building hypersonic and rolling road capability, upgrading aging tunnels, adding digital twin services, and forming partnerships with governments and universities to win long term projects.
Key challenges include high construction and energy costs, long project timelines, dependence on government funding, and the growing use of simulation to replace some physical tests.
Explore our key highlights of the report and gain a concise overview of key findings, trends, and actionable insights that will empower your strategic decisions.
|
Report Features |
Details |
|
Base Year |
2025 |
|
Historical Period |
2019-2025 |
|
Forecast Period |
2026-2035 |
|
Scope of the Report |
Historical and Forecast Trends, Industry Drivers and Constraints, Historical and Forecast Market Analysis by Segment: Type Configuration Application Region |
|
Breakup by Type |
|
|
Breakup by Configuration |
|
|
Breakup by Application |
|
|
Breakup by Region |
|
|
Market Dynamics |
|
|
Competitive Landscape |
|
|
Companies Covered |
|
Datasheet
One User
USD 2,499
USD 2,249
tax inclusive*
Single User License
One User
USD 3,999
USD 3,599
tax inclusive*
Five User License
Five User
USD 4,999
USD 4,249
tax inclusive*
Corporate License
Unlimited Users
USD 5,999
USD 5,099
tax inclusive*
*Please note that the prices mentioned below are starting prices for each bundle type. Kindly contact our team for further details.*
Flash Bundle
Small Business Bundle
Growth Bundle
Enterprise Bundle
*Please note that the prices mentioned below are starting prices for each bundle type. Kindly contact our team for further details.*
Flash Bundle
Number of Reports: 3
20%
tax inclusive*
Small Business Bundle
Number of Reports: 5
25%
tax inclusive*
Growth Bundle
Number of Reports: 8
30%
tax inclusive*
Enterprise Bundle
Number of Reports: 10
35%
tax inclusive*
How To Order

Select License Type
Choose the right license for your needs and access rights.

Click on ‘Buy Now’
Add the report to your cart with one click and proceed to register.

Select Mode of Payment
Choose a payment option for a secure checkout. You will be redirected accordingly.
Strategic Solutions for Informed Decision-Making
Gain insights to stay ahead and seize opportunities.
Get insights & trends for a competitive edge.
Track prices with detailed trend reports.

Analyse trade data for supply chain insights.

Leverage cost reports for smart savings
Enhance supply chain with partnerships.
Connect For More Information
Our expert team of analysts will offer full support and resolve any queries regarding the report, before and after the purchase.
Our expert team of analysts will offer full support and resolve any queries regarding the report, before and after the purchase.
We employ meticulous research methods, blending advanced analytics and expert insights to deliver accurate, actionable industry intelligence, staying ahead of competitors.
Our skilled analysts offer unparalleled competitive advantage with detailed insights on current and emerging markets, ensuring your strategic edge.
We offer an in-depth yet simplified presentation of industry insights and analysis to meet your specific requirements effectively.