

Consumer Insights
Uncover trends and behaviors shaping consumer choices today
Procurement Insights
Optimize your sourcing strategy with key market data
Industry Stats
Stay ahead with the latest trends and market analysis.
The growing attention to treatment-related complications in oncology has highlighted the clinical burden of chemotherapy-associated pain among cancer survivors. As per ecancer and pooled global analyses, approximately 4 in every 10 patients receiving chemotherapy develop persistent painful peripheral neuropathy.. The chemotherapy induced pain epidemiology forecast by Expert Market Research underscores an increasing emphasis on improved pain assessment, multidisciplinary management strategies, and supportive care approaches to enhance quality of life among patients undergoing chemotherapy.
Base Year
Historical Period
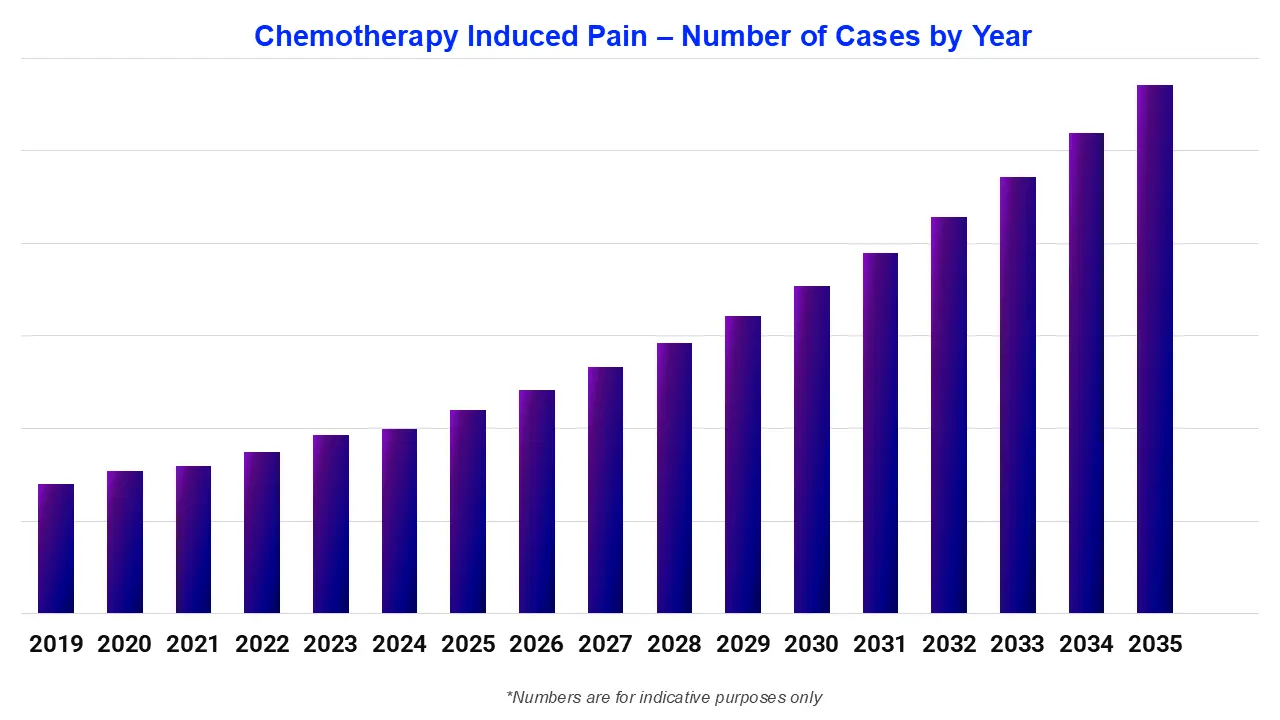
Forecast Period
Read more about this report - Request a Free Sample
Expert Market Research's “Chemotherapy Induced Pain Epidemiology Forecast Report 2026-2035” offers comprehensive information on the prevalence and demographics of chemotherapy induced pain. It projects the future incidence and prevalence rates of chemotherapy induced pain cases across various populations. The study covers age, gender, and type as major determinants of the chemotherapy induced pain population. The report highlights patterns in the prevalence of chemotherapy induced pain over time and projects future trends based on multiple variables.
The report provides a comprehensive overview of the disease, as well as historical and projected data on chemotherapy induced pain epidemiology in the 8 major markets.
Regions Covered
Chemotherapy-induced pain is a common complication experienced by cancer patients undergoing cytotoxic drug therapy. It arises from direct tissue injury, inflammatory responses, or nerve damage caused by chemotherapeutic agents. One of the most prevalent manifestations is chemotherapy-induced peripheral neuropathy, characterized by numbness, tingling, burning sensations, and hypersensitivity in the hands and feet. Other forms include mucositis-related pain, musculoskeletal pain, and visceral discomfort. The severity and duration of symptoms vary depending on the chemotherapy regimen, cumulative dosage, and patient susceptibility. Persistent pain can significantly impair quality of life and may lead to treatment modification or discontinuation.
The chemotherapy induced pain epidemiology division offers information on the patient pool from history to the present, as well as the projected trend for each of the 8 major markets. Expert Market Research provides both current and predicted trends for the chemotherapy induced pain epidemiology scenario by examining a wide range of studies. Additionally, the report covers the diagnosed patient pool for chemotherapy induced pain and their trends. The chemotherapy induced pain detailed epidemiology segmentation is broken down into specific categories, such as total prevalent cases in males and females, and total diagnosed cases across different age groups and patient pools.
Read more about this report - Request a Free Sample
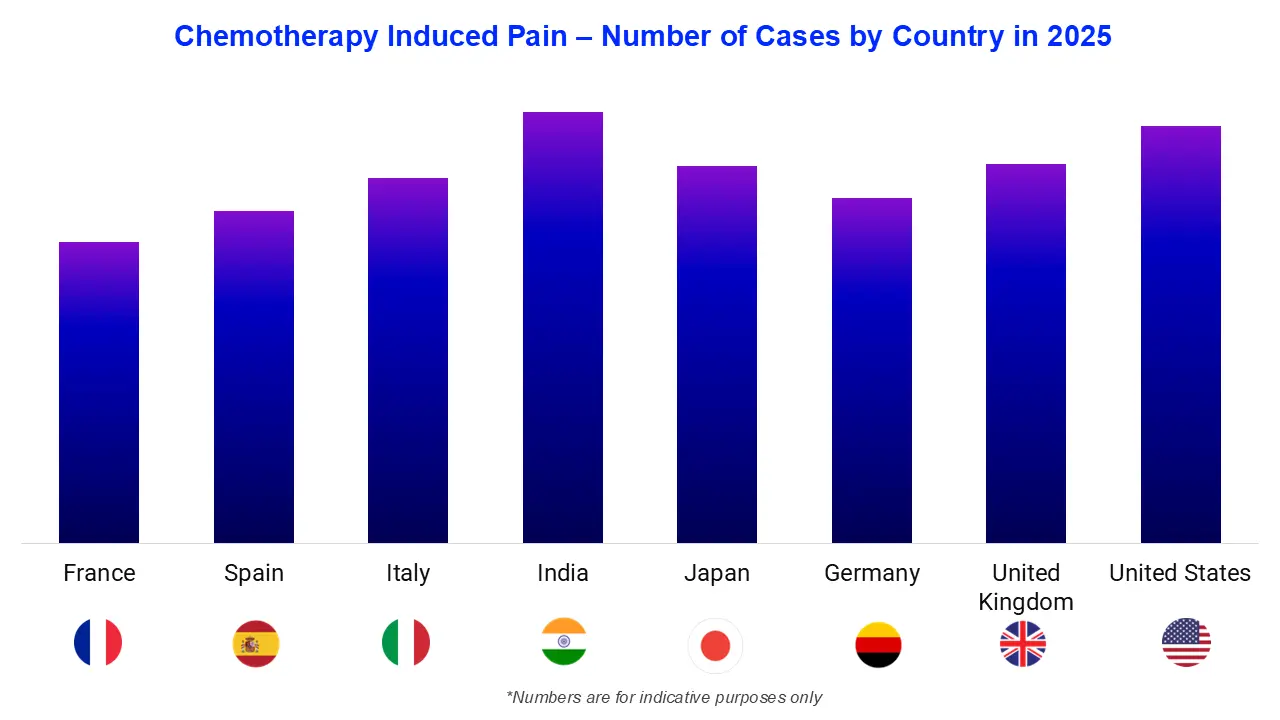
The chemotherapy induced pain epidemiology data and findings for the United States, Germany, Spain, Italy, France, the United Kingdom, Japan, and India are also provided in the epidemiology section.
Chemotherapy-induced pain remains an important clinical concern within oncology care, reflecting the broader symptom burden associated with cancer treatment. In the United States, population-based survey analyses show that around 9.5% of cancer survivors report persistent pain related to cancer or its treatments, including chemotherapy-associated pain syndromes affecting long-term survivorship outcomes. In the United Kingdom, clinical evidence indicates that approximately 33-40% of cancer survivors experience chronic pain following treatment, including chemotherapy-related pain conditions. Collectively, these observations highlight the continuing need for improved pain assessment, supportive care strategies, and effective symptom management for individuals undergoing or recovering from chemotherapy.
Management of chemotherapy-induced pain focuses on symptom control, nerve protection, and maintaining patients’ quality of life during cancer treatment. Pharmacological interventions commonly include analgesics, anticonvulsants such as gabapentin or pregabalin, antidepressants, and topical agents for neuropathic pain relief. In some cases, opioids may be prescribed for moderate to severe pain. Non-pharmacological strategies such as physical therapy, acupuncture, and psychological support can also help alleviate symptoms. Dose adjustment or switching chemotherapeutic agents may be necessary when pain becomes severe. Ongoing research is exploring neuroprotective agents and targeted therapies to prevent or reduce chemotherapy-related nerve damage.
Upto 15% Off
USD
$2999 $2699
$1999 $1799
$4399 $3739
$5799 $4929


*While we strive to always give you current and accurate information, the numbers depicted on the website are indicative and may differ from the actual numbers in the main report. At Expert Market Research, we aim to bring you the latest insights and trends in the market. Using our analyses and forecasts, stakeholders can understand the market dynamics, navigate challenges, and capitalize on opportunities to make data-driven strategic decisions.*
Explore our key highlights of the report and gain a concise overview of key findings, trends, and actionable insights that will empower your strategic decisions.
|
Report Features |
Details |
|
Base Year |
2025 |
|
Historical Period |
2019-2025 |
|
Forecast Period |
2026-2035 |
|
Epidemiology Statistics Provided |
|
|
Segmentation Provided |
|
|
Geographies Covered |
|
Single User License
One User
USD 2,999
USD 2,699
tax inclusive*
Datasheet
One User
USD 1,999
USD 1,799
tax inclusive*
Five User License
Five User
USD 4,399
USD 3,739
tax inclusive*
Corporate License
Unlimited Users
USD 5,799
USD 4,929
tax inclusive*
*Please note that the prices mentioned below are starting prices for each bundle type. Kindly contact our team for further details.*
Flash Bundle
Small Business Bundle
Growth Bundle
Enterprise Bundle
*Please note that the prices mentioned below are starting prices for each bundle type. Kindly contact our team for further details.*
Flash Bundle
Number of Reports: 3
20%
tax inclusive*
Small Business Bundle
Number of Reports: 5
25%
tax inclusive*
Growth Bundle
Number of Reports: 8
30%
tax inclusive*
Enterprise Bundle
Number of Reports: 10
35%
tax inclusive*
How To Order

Select License Type
Choose the right license for your needs and access rights.

Click on ‘Buy Now’
Add the report to your cart with one click and proceed to register.

Select Mode of Payment
Choose a payment option for a secure checkout. You will be redirected accordingly.
Strategic Solutions for Informed Decision-Making
Gain insights to stay ahead and seize opportunities.

Get insights & trends for a competitive edge.

Track prices with detailed trend reports.

Analyse trade data for supply chain insights.

Leverage cost reports for smart savings

Enhance supply chain with partnerships.

Connect For More Information
Our expert team of analysts will offer full support and resolve any queries regarding the report, before and after the purchase.
Our expert team of analysts will offer full support and resolve any queries regarding the report, before and after the purchase.
We employ meticulous research methods, blending advanced analytics and expert insights to deliver accurate, actionable industry intelligence, staying ahead of competitors.
Our skilled analysts offer unparalleled competitive advantage with detailed insights on current and emerging markets, ensuring your strategic edge.
We offer an in-depth yet simplified presentation of industry insights and analysis to meet your specific requirements effectively.


