

Consumer Insights
Uncover trends and behaviors shaping consumer choices today
Procurement Insights
Optimize your sourcing strategy with key market data
Industry Stats
Stay ahead with the latest trends and market analysis.
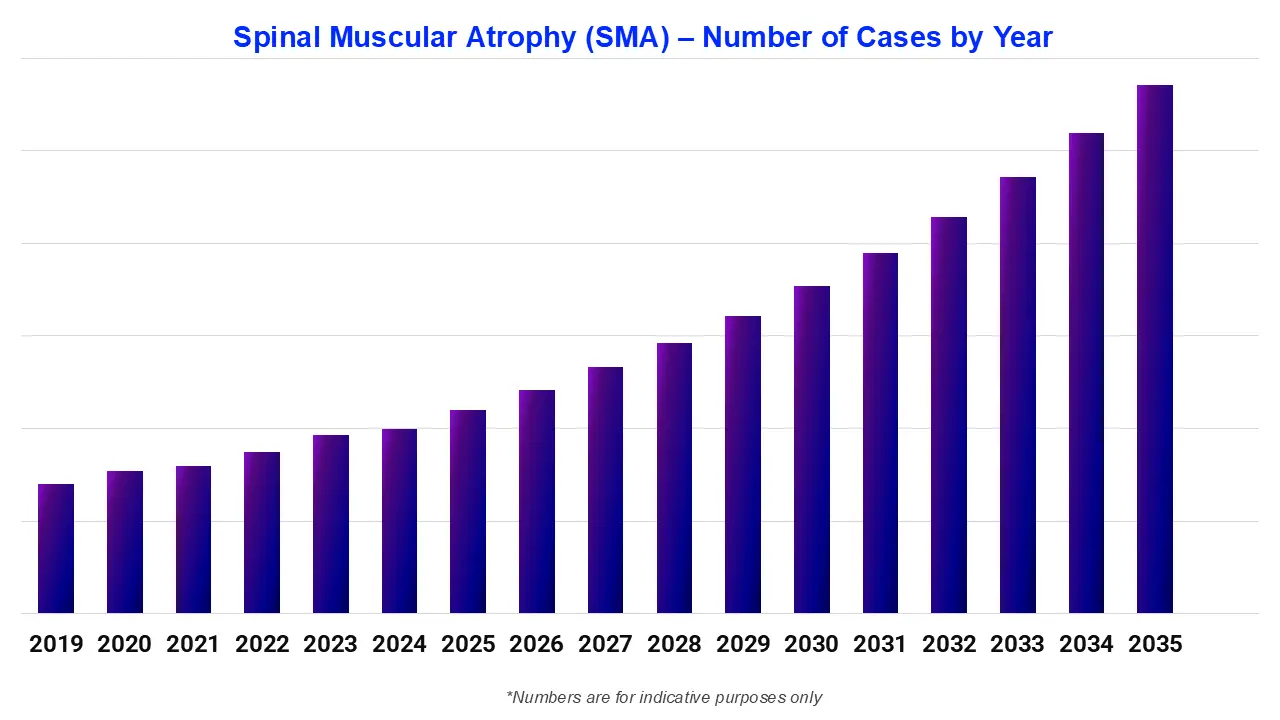
Spinal muscular atrophy (SMA) is a genetic disorder that causes progressive muscle weakness and atrophy due to motor neuron degeneration. According to Cure SMA, SMA occurs in approximately 1 in 11,000 births in the United States, while about 1 in 50 Americans are genetic carriers. As per spinal muscular atrophy (SMA) epidemiology forecast by Expert Market Research, epidemiological trends remain important for assessing disease burden and treatment needs.
Base Year
Historical Period
Forecast Period
Read more about this report - Request a Free Sample
Expert Market Research's “Spinal Muscular Atrophy (SMA) Epidemiology Forecast Report 2026-2035” offers comprehensive information on the prevalence and demographics of spinal muscular atrophy (SMA). It projects the future incidence and prevalence rates of spinal muscular atrophy (SMA) cases across various populations. The study covers age, gender, and type as major determinants of the spinal muscular atrophy (SMA) population. The report highlights patterns in the prevalence of spinal muscular atrophy (SMA) over time and projects future trends based on multiple variables.
The report provides a comprehensive overview of the disease, as well as historical and projected data on the epidemiology of spinal muscular atrophy (SMA) in the 8 major markets.
Regions Covered
Spinal muscular atrophy (SMA) is a rare inherited neuromuscular disorder characterized by progressive loss of motor neurons in the spinal cord and brainstem, resulting in muscle weakness and atrophy. It primarily occurs due to mutations or deletions in the survival motor neuron 1 (SMN1) gene, which reduce production of survival motor neuron protein. SMA is commonly classified into types 0, I, II, III, and IV based on age of onset and functional severity. Type 0 is the most severe, while type IV generally presents in adulthood with milder symptoms.
|
Parameter |
Insight |
|
Largest Patient Pool |
United States |
|
Fastest Growing Region |
India |
|
High-Risk Population |
Infants and children with inherited SMN1 gene abnormalities, particularly those with early-onset SMA |
|
Key Diagnostic Method |
Genetic testing for SMN1 gene deletion or mutation |
|
Major Risk Factor |
Inheritance of pathogenic SMN1 gene variants |
|
Major gap in the market |
Delayed diagnosis and limited access to advanced disease-modifying therapies |
The spinal muscular atrophy (SMA) epidemiology division offers information on the patient pool from history to the present as well as the projected trend for each of the 8 major markets. Expert Market Research provides both current and predicted trends for the spinal muscular atrophy (SMA) epidemiology scenario by examining a wide range of studies. Additionally, the report covers the diagnosed patient pool for spinal muscular atrophy (SMA) and their trends. The data is broken down into specific categories, such as total prevalent cases in males and females, and total diagnosed cases across different age groups and patient pools.
|
Epidemiology Segment |
Key Insights |
|
Diagnosed Prevalent Cases of the Disease |
According to Cure SMA, Spinal Muscular Atrophy occurs in approximately 1 in 11,000 births in the United States. Globally, BGI reports approximately 1 in 6,000–10,000 babies are born with spinal muscular atrophy each year. |
|
Gender-Specific Cases of the Disease |
As per Cure SMA, the disease affects males and females across all races and genders. Tu-Lan Vu-Han et al. (2024) reported a dataset distribution of 51.81% males and 48.19% females, indicating a relatively balanced gender distribution. |
|
Age-Specific Cases of the Disease |
Epidemiological burden varies across the age spectrum, with early-onset cases contributing substantially to infant morbidity and mortality. According to Amrita Hospital, spinal muscular atrophy was previously the most common single-gene disorder leading to infant mortality before disease-modifying treatments. |
|
Ethnicity-Wise Cases of the Disease |
Evaluation of spinal muscular atrophy across different racial and ethnic populations, considering variations in disease occurrence and carrier frequency across populations. |
|
Mortality and Survival Analysis of the Disease |
According to Amrita Hospital, spinal muscular atrophy was the most common single-gene disorder leading to infant mortality before disease-modifying treatments. BGI reports that early identification and treatment are associated with better motor milestones and survival outcomes. |
|
Disease Type |
Prevalence |
|
Type 1 |
According to Tu-Lan Vu-Han et al. (2024), Type 1 accounted for 31.23% of the analyzed Spinal Muscular Atrophy dataset, representing a substantial proportion of the reported disease-type distribution. |
|
Type 2 |
According to Tu-Lan Vu-Han et al. (2024), Type 2 represented 44.14% of the analyzed Spinal Muscular Atrophy dataset, making it the most represented disease type within the reported dataset. |
|
Type 3 |
According to Tu-Lan Vu-Han et al. (2024), Type 3 accounted for 24.62% of the analyzed Spinal Muscular Atrophy dataset, representing the smallest proportion among the three reported Spinal Muscular Atrophy types. |
|
Others |
Type 0 and Type IV represent additional clinical subtypes within the Spinal Muscular Atrophy spectrum and contribute to the overall classification of disease severity and age of onset. |
Read more about this report - Request a Free Sample
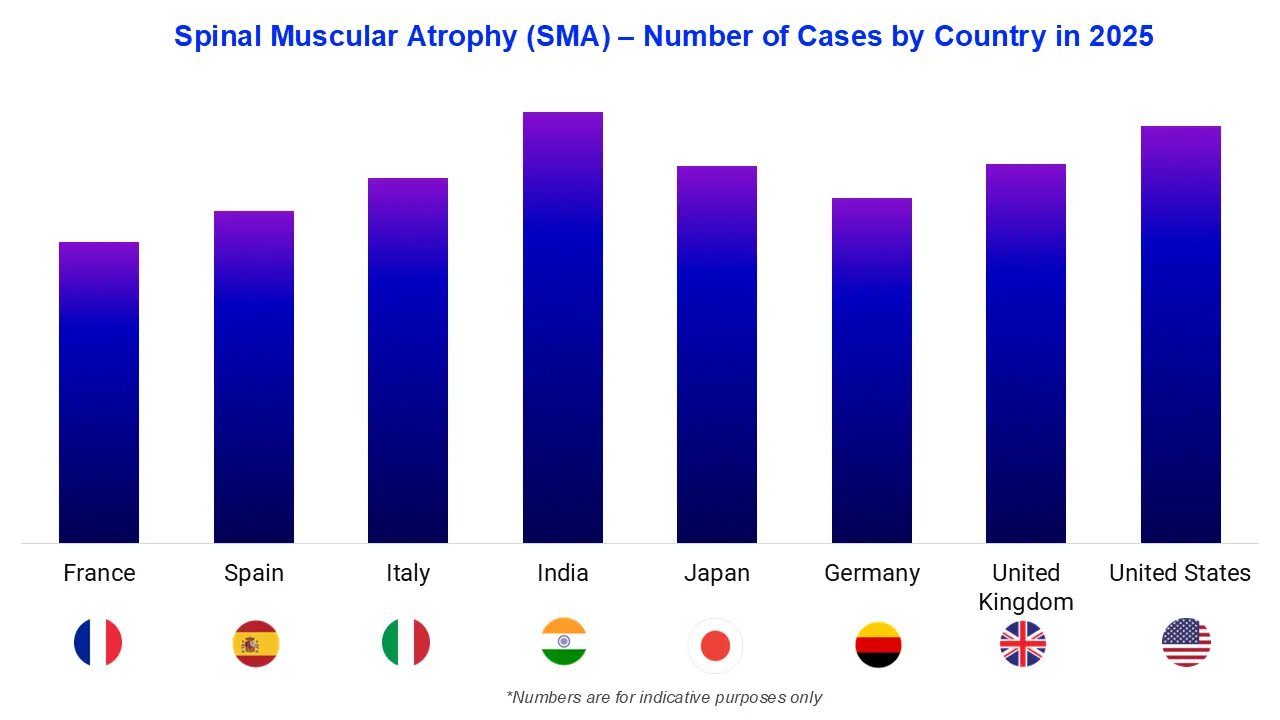
The spinal muscular atrophy (SMA) epidemiology data and findings for the United States, Germany, Spain, Italy, France, the United Kingdom, Japan, and India are also provided in the epidemiology section.
|
Country |
Key Insights |
|
United States |
According to Cure SMA, spinal muscular atrophy occurs in approximately 1 in 11,000 births in the United States, while around 1 in 50 Americans are genetic carriers. The condition affects individuals across races and genders. |
|
Germany |
As per Tu-Lan Vu-Han et al. (2024), 72.09% of the patients in the analyzed dataset were born in Germany. Germany was also among the first countries to approve spinal muscular atrophy therapies and implement newborn screening. |
|
France |
Epidemiological patterns in France can be considered within the broader European spinal muscular atrophy population, with disease burden influenced by case identification, genetic screening, diagnosis, and access to specialized care. |
|
Italy |
Epidemiological assessment in Italy encompasses spinal muscular atrophy cases identified through diagnosis and genetic testing, with disease burden reflecting differences in case recognition, screening practices, and access to specialized healthcare services. |
|
Spain |
Spinal muscular atrophy epidemiology in Spain is shaped by diagnosis and identification of affected individuals across different disease types. Epidemiological assessment also considers the distribution of cases by age and disease severity. |
|
United Kingdom |
The epidemiological profile of spinal muscular atrophy in the United Kingdom encompasses affected individuals across different disease types and ages, with case identification supported by diagnostic and genetic assessment practices. |
|
Japan |
As per Kazuhiko Hashimoto et al. (2023), the prevalence of spinal muscular atrophy in Japan was 1.17 per 100,000 people, while the incidence was 0.51 per 100,000 live births. |
|
India |
According to JSS Hospital Mysuru, the disease affects approximately 1 in 7,000–10,000 live births in India. The reported carrier frequency is approximately 1 in 50 in the general population, with higher frequencies possible in certain populations. |
The regional SMA disease epidemiology landscape continues to face delayed diagnosis, limited genetic testing, and unequal access to disease-modifying therapies, particularly in countries such as India. Greater implementation of newborn screening could enable earlier diagnosis and treatment, potentially improving long-term outcomes. Expanding genetic counseling and carrier screening may also support earlier identification of families at risk. In emerging markets, opportunities exist to improve access to genetic testing, specialist care, and innovative therapies through healthcare infrastructure development and reimbursement initiatives. Increasing awareness among pediatricians and primary care providers represents another opportunity to reduce diagnostic delays.
Spinal muscular atrophy (SMA) treatment focuses on increasing survival motor neuron protein production, slowing disease progression, and preserving motor function. Disease-modifying therapies include gene replacement therapy, which delivers a functional copy of the SMN1 gene, and therapies that modify SMN2 gene splicing to increase production of functional SMN protein. Nusinersen and risdiplam are established SMN-enhancing therapies, while onasemnogene abeparvovec is a gene-replacement treatment. Supportive management includes respiratory support, nutritional assistance, physical and occupational therapy, orthopedic care, and multidisciplinary monitoring to address complications and maintain quality of life.


Upto 15% Off
USD
$1999 $1799
$2999 $2699
$4399 $3739
$5799 $4929


*While we strive to always give you current and accurate information, the numbers depicted on the website are indicative and may differ from the actual numbers in the main report. At Expert Market Research, we aim to bring you the latest insights and trends in the market. Using our analyses and forecasts, stakeholders can understand the market dynamics, navigate challenges, and capitalize on opportunities to make data-driven strategic decisions.*
Explore our key highlights of the report and gain a concise overview of key findings, trends, and actionable insights that will empower your strategic decisions.
|
Report Features |
Details |
|
Base Year |
2025 |
|
Historical Period |
2019-2025 |
|
Forecast Period |
2026-2035 |
|
Epidemiology Statistics Provided |
|
|
Segmentation Provided |
|
|
Geographies Covered |
|
Datasheet
One User
USD 1,999
USD 1,799
tax inclusive*
Single User License
One User
USD 2,999
USD 2,699
tax inclusive*
Five User License
Five User
USD 4,399
USD 3,739
tax inclusive*
Corporate License
Unlimited Users
USD 5,799
USD 4,929
tax inclusive*
*Please note that the prices mentioned below are starting prices for each bundle type. Kindly contact our team for further details.*
Flash Bundle
Small Business Bundle
Growth Bundle
Enterprise Bundle
*Please note that the prices mentioned below are starting prices for each bundle type. Kindly contact our team for further details.*
Flash Bundle
Number of Reports: 3
20%
tax inclusive*
Small Business Bundle
Number of Reports: 5
25%
tax inclusive*
Growth Bundle
Number of Reports: 8
30%
tax inclusive*
Enterprise Bundle
Number of Reports: 10
35%
tax inclusive*
How To Order

Select License Type
Choose the right license for your needs and access rights.

Click on ‘Buy Now’
Add the report to your cart with one click and proceed to register.

Select Mode of Payment
Choose a payment option for a secure checkout. You will be redirected accordingly.
Strategic Solutions for Informed Decision-Making
Gain insights to stay ahead and seize opportunities.

Get insights & trends for a competitive edge.

Track prices with detailed trend reports.

Analyse trade data for supply chain insights.

Leverage cost reports for smart savings

Enhance supply chain with partnerships.

Connect For More Information
Our expert team of analysts will offer full support and resolve any queries regarding the report, before and after the purchase.
Our expert team of analysts will offer full support and resolve any queries regarding the report, before and after the purchase.
We employ meticulous research methods, blending advanced analytics and expert insights to deliver accurate, actionable industry intelligence, staying ahead of competitors.
Our skilled analysts offer unparalleled competitive advantage with detailed insights on current and emerging markets, ensuring your strategic edge.
We offer an in-depth yet simplified presentation of industry insights and analysis to meet your specific requirements effectively.




