

Consumer Insights
Uncover trends and behaviors shaping consumer choices today
Procurement Insights
Optimize your sourcing strategy with key market data
Industry Stats
Stay ahead with the latest trends and market analysis.
The global 3D printed battery market reached a value of about USD 38.01 Billion in 2025. The industry is further expected to grow at a CAGR of about 19.40% in the forecast period of 2026-2035 to reach a value of around USD 223.84 Billion by 2035.
Compound Annual Growth Rate
19.4%
Value in USD Billion
2026-2035
North America's growing electronics industry is driving up demand for 3D printed batteries in the region. Harvard University and the University of Illinois have successfully printed lithium-ion micro-batteries using 3D printing technology, which is almost the size of a grain of sand. An increase in usage of 3D printed batteries in electric cars is estimated to boost the market in North America. 3D printed batteries are utilised in smart packaging, smart cards for payment applications in the telecommunications, banking, and transportation industries, and wearable devices such as smartwatches, fitness bands, and wearable power banks for smartphones in North America. Major key players of 3D-printed batteries have been spending heavily in the United States, particularly in the consumer electronics industry United States.
Consumer electronics manufacturers in the Asia Pacific region are developing their product designs as a result of expanding industrialisation, which necessitates thin power sources for compliance with their products' flexible design. For such purposes, 3D printed batteries are favoured for electrical device miniaturisation. China's rising defence budget, as well as the growing demand for advanced consumer electronics products in China, is prominent to the growth of the 3D printed batteries market.
Read more about this report - REQUEST FREE SAMPLE COPY IN PDF
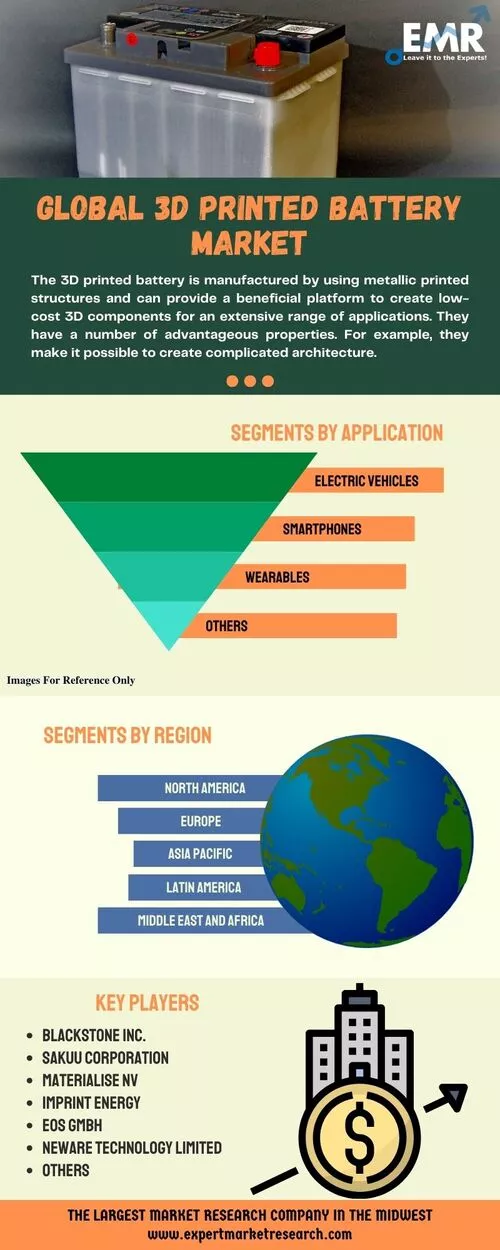
The 3D printed battery is manufactured by using metallic printed structures and can provide a beneficial platform to create low-cost 3D components for an extensive range of applications. They have a number of advantageous properties. For example, they make it possible to create complicated architecture. They also provide electrodes with carefully controlled shape and thickness. They also make it possible to print solid-state electrolytes with high structural stability. The anode and cathode materials most typically used in 3D printed batteries are lithium titanate (LTO) and lithium iron phosphate (LPF). They have a low volumetric expansion, a high-rate capability, and a high level of stability and security.
By architectural process, the market is divided into:
The end users of the market are:
The leading application sectors of the market includes:
The regional markets for 3D printed battery industry can be divided into:


The demand for portable and flexible energy sources has grown as the number of small battery-operated customer electronics has increased. The growing use of printed batteries in a variety of industrial applications, such as smart labels, wireless sensors, temperature tags, radio-frequency sensing, cosmetic and medicinal patches, greeting cards sensor, data logging systems, interactive packaging, and other consumer electronics products, is propelling the market forward. Printed batteries are also becoming more popular as environmental concerns about the multiple harmful effects of traditional batteries develop. The development of 3D printing technology, which allows for the desired manufacturing and design of batteries, is likely to accelerate the growth of the 3D printed batteries market globally. The associated advantages, along with their increasing and diversified applications, represent the primary factors driving the market growth. The leading electronics companies are developing printed cells using 3D printing technologies that are compatible with smart devices and exhibit minimal volumetric expansion, high-rate capability, stability and security, which is expected to drive the market in the coming years.
The report gives a detailed analysis of the following key players in the global 3D printed battery market, covering their competitive landscape, capacity, and latest developments like mergers, acquisitions, and investments, expansions of capacity, and plant turnarounds:
The comprehensive EMR report provides an in-depth assessment of the market based on the Porter's five forces model along with giving a SWOT analysis.
Upto 15% Off
USD
$2499 $2249
$3999 $3599
$4999 $4249
$5999 $5099


*While we strive to always give you current and accurate information, the numbers depicted on the website are indicative and may differ from the actual numbers in the main report. At Expert Market Research, we aim to bring you the latest insights and trends in the market. Using our analyses and forecasts, stakeholders can understand the market dynamics, navigate challenges, and capitalize on opportunities to make data-driven strategic decisions.*
In 2025, the global 3D printed battery market attained a value of nearly USD 38.01 Billion.
The market is projected to grow at a CAGR of 19.40% between 2026 and 2035.
The market is estimated to witness a healthy growth in the forecast period of 2026-2035 to reach USD 223.84 Billion by 2035.
The major market drivers include the growing use of 3D printed batteries in smart packaging, rapid industrialisation, and the surging utilisation of printed batteries in a variety of industrial applications.
The increasing use of 3D printed batteries in electric vehicles and the increasing number of small battery-operated customer electronics are the key trends guiding the market growth.
The major regions in the market are North America, Latin America, the Middle East and Africa, Europe, and the Asia Pacific.
The various segments based on architectural processes of 3D printed battery considered in the market report are graphene-based Li-ion anodes, solid-state graphene super capacitors, graphene-based PLA filaments, and platinum-based electrodes, among others.
The several end-users of the product include energy storage devices and electronics, among others.
The significant applications of 3D printed battery include wearables, smartphones, and electric vehicles, among others.
The major players in the market are Blackstone Inc., Sakuu Corporation, Materialise NV, Imprint Energy, EOS GmbH, and Neware Technology Limited, among others.
Explore our key highlights of the report and gain a concise overview of key findings, trends, and actionable insights that will empower your strategic decisions.
| REPORT FEATURES | DETAILS |
| Base Year | 2025 |
| Historical Period | 2019-2025 |
| Forecast Period | 2026-2035 |
| Scope of the Report |
Historical and Forecast Trends, Industry Drivers and Constraints, Historical and Forecast Market Analysis by Segment:
|
| Breakup by Architectural Process |
|
| Breakup by End-User |
|
| Breakup by Application |
|
| Breakup by Region |
|
| Market Dynamics |
|
| Competitive Landscape |
|
| Companies Covered |
|
| Report Price and Purchase Option | Explore our purchase options that are best suited to your resources and industry needs. |
| Delivery Format | Delivered as an attached PDF and Excel through email, with an option of receiving an editable PPT, according to the purchase option. |
Datasheet
One User
USD 2,499
USD 2,249
tax inclusive*
Single User License
One User
USD 3,999
USD 3,599
tax inclusive*
Five User License
Five User
USD 4,999
USD 4,249
tax inclusive*
Corporate License
Unlimited Users
USD 5,999
USD 5,099
tax inclusive*
*Please note that the prices mentioned below are starting prices for each bundle type. Kindly contact our team for further details.*
Flash Bundle
Small Business Bundle
Growth Bundle
Enterprise Bundle
*Please note that the prices mentioned below are starting prices for each bundle type. Kindly contact our team for further details.*
Flash Bundle
Number of Reports: 3
20%
tax inclusive*
Small Business Bundle
Number of Reports: 5
25%
tax inclusive*
Growth Bundle
Number of Reports: 8
30%
tax inclusive*
Enterprise Bundle
Number of Reports: 10
35%
tax inclusive*
How To Order

Select License Type
Choose the right license for your needs and access rights.

Click on ‘Buy Now’
Add the report to your cart with one click and proceed to register.

Select Mode of Payment
Choose a payment option for a secure checkout. You will be redirected accordingly.
Strategic Solutions for Informed Decision-Making
Gain insights to stay ahead and seize opportunities.

Get insights & trends for a competitive edge.

Track prices with detailed trend reports.

Analyse trade data for supply chain insights.

Leverage cost reports for smart savings

Enhance supply chain with partnerships.

Connect For More Information
Our expert team of analysts will offer full support and resolve any queries regarding the report, before and after the purchase.
Our expert team of analysts will offer full support and resolve any queries regarding the report, before and after the purchase.
We employ meticulous research methods, blending advanced analytics and expert insights to deliver accurate, actionable industry intelligence, staying ahead of competitors.
Our skilled analysts offer unparalleled competitive advantage with detailed insights on current and emerging markets, ensuring your strategic edge.
We offer an in-depth yet simplified presentation of industry insights and analysis to meet your specific requirements effectively.


