

Consumer Insights
Uncover trends and behaviors shaping consumer choices today
Procurement Insights
Optimize your sourcing strategy with key market data
Industry Stats
Stay ahead with the latest trends and market analysis.
The global aluminum fluoride market reached a valuation of USD 2.56 Billion in 2025 and is projected to expand at a compound annual growth rate (CAGR) of 6.10% during the forecast period of 2026-2035, reaching an estimated USD 4.63 Billion by 2035. This growth trajectory is underpinned by the compound’s indispensable role as a flux additive in the Hall-Heroult electrolytic process, which accounts for the majority of global aluminum fluoride consumption.
As the world’s aluminum smelting operations pivot toward low-carbon and energy-efficient production models, the demand for high-purity aluminum fluoride (AlF3) is intensifying. Smelters are tightening specifications for electrolyte materials, seeking grades that minimize cell voltage drift, reduce fluoride emissions, and improve ionic conductivity in cryolite baths. The International Aluminum Institute has indicated that the use of higher-grade inputs could decrease energy intensity in smelting by 2–4%, a critical advancement for producers committed to meeting decarbonization targets.
Beyond its metallurgical applications, the aluminum fluoride market is witnessing a meaningful diversification of end-use demand. Chemical intermediates, glass manufacturing, advanced ceramics, and even emerging battery technologies are creating new consumption channels for specialty AlF3 grades. This broadening application base, combined with supply-chain restructuring around fluorspar availability and regulatory tightening around fluoride emissions, is reshaping the competitive dynamics of the global market.
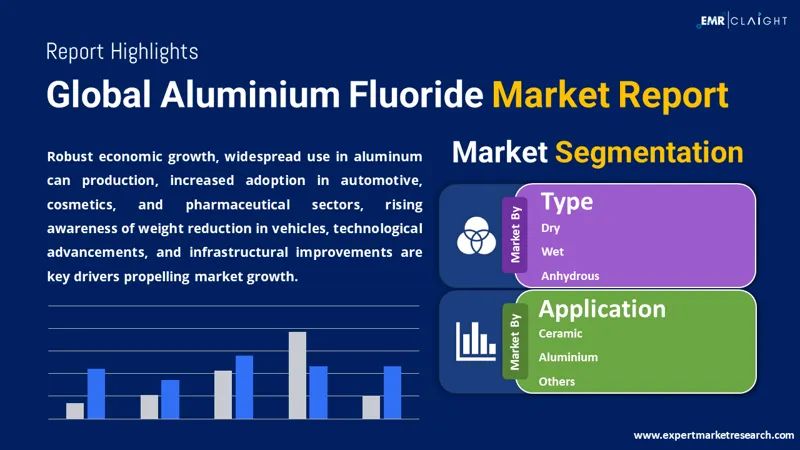
The aluminum fluoride market report from Expert Market Research provides a comprehensive analysis covering historical data from 2019 to 2025 and forecast projections through 2035. The report examines market segmentation by type (dry, wet, anhydrous), application (chemical intermediates, glass, ceramic, aluminum, others), and regional breakdown across North America, Europe, Asia Pacific, Latin America, and the Middle East and Africa.
Compound Annual Growth Rate
6.1%
Value in USD Billion
2026-2035
Get a sample of the market report in PDF – REQUEST A FREE SAMPLE
| Global Aluminum Fluoride Market Report Summary | Description | Value |
| Base Year | USD Billion | 2025 |
| Historical Period | USD Billion | 2019-2025 |
| Forecast Period | USD Billion | 2026-2035 |
| Market Size 2025 | USD Billion | 2.56 |
| Market Size 2035 | USD Billion | 4.63 |
| CAGR 2019-2025 | Percentage | XX% |
| CAGR 2026-2035 | Percentage | 6.10% |
| CAGR 2026-2035 - Market by Region | Asia Pacific | 4.9% |
| CAGR 2026-2035 - Market by Country | India | 5.6% |
| CAGR 2026-2035 - Market by Country | Saudi Arabia | 4.7% |
| CAGR 2026-2035 - Market by Type | Dry | 4.4% |
| CAGR 2026-2035 - Market by Application | Chemical Intermediates | 4.9% |
| Market Share by Country 2025 | Japan | 4.2% |
The aluminum fluoride industry is undergoing a period of significant transformation, driven by technological advancements in production, evolving buyer expectations, and regulatory modernization. The following trends are actively reshaping the competitive landscape and influencing procurement strategies across the value chain.
The partnership between FLUORSID and Norsk Hydro ASA was announced. It aims to continue developing and reinforcing itself over time. The contract signed last November, which renewed the supply of AlF3 (Aluminum Fluoride) between FLUORSID and a leading global aluminum producer, strengthens a lasting collaboration between two firms that cooperate on international initiatives. This indicates sustained demand from primary aluminum producers and supporting predictable capacity planning across the value chain.
BOROUX, a pioneer in water filtration technology, launched its newest innovation called the BOROUX Proactive™ Fluoride Filter, a completely alumina-free, high-efficiency filter that eliminates up to 99.9% of fluoride from drinking water. This aluminum fluoride market development positions high-purity AlF₃ suppliers to differentiate through tighter impurity controls and safer chemical profiles.
Telix revealed the introduction of an innovative PET radiochemistry solution utilizing 18F-aluminum fluoride (AlF), called AlFluor. The AlFluor platform technology allows for adaptable radiolabeling of PSMA[2] using either AlF or gallium-68 (68Ga), highlighting emerging high-value niches beyond aluminum smelting.
Specialty chemicals manufacturer Anupam Rasayan India Ltd finalized the purchase of 24.96% of the complete equity shareholding and joint control of Tanfac Industries Ltd (TIL) from Birla Group Holdings. This aluminum fluoride market development strengthens backward integration and enhances regional AlF₃ production capabilities, improving supply security for downstream aluminum customers.
Producers are investing heavily in upgrading calcination lines and continuous-conversion processes to deliver higher-purity anhydrous aluminum fluoride that meets the exacting requirements of modern Hall-Heroult cells. Higher-grade AlF3 is now supplied with granularity specifications and trace-impurity guarantees, allowing smelting operations to reduce cell voltage drift and improve current efficiency. In September 2025, Calix signed a Memorandum of Understanding to pilot its ZEAL technology, targeting smelter-grade alumina production with lower emissions and higher efficiency. Industry bodies such as the International Aluminum Institute continue to emphasize the importance of process controls in reducing fluoride emissions and optimizing energy consumption, creating premium demand for process-certified AlF3 paired with detailed batch analytics.
Volatility in fluorspar supply, compounded by geopolitical concentration of mining operations in China, has compelled aluminum fluoride suppliers to diversify feedstock sources and invest in backward integration. Producers are securing long-term mineral contracts, exploring secondary sources such as fluorosilicic acid streams, and co-processing alternative fluorspars to mitigate supply disruption risks. In November 2025, Ethiopia secured a USD 1 billion deal with Rusal for an aluminum plant creating 500,000-ton production capacity. The aluminum fluoride market expansion is further supported by buyers increasingly preferring suppliers with transparent sourcing practices, inventory buffers, and ISO-grade traceability, as interrupted AlF3 supply can halt smelter operations.
Tighter fluoride emission standards and heightened public scrutiny of smelter air quality are compelling suppliers to adopt low-emission production methods and circular-feedstock options. The European Commission’s revised Industrial Emissions Directive (IED), adopted in April 2024, mandates lower fluoride discharge thresholds for chemical manufacturing facilities across the EU, directly impacting procurement specifications and driving investment in fume-control technologies. Some manufacturers are piloting fluorine-recovery loops and utilizing industrial by-products to produce AlF3 feed, aligning with circular-economy principles. In June 2025, Telix Pharmaceuticals launched AlFluor, a novel PET radiochemistry solution based on 18F-aluminum fluoride, demonstrating the compound’s expanding applications beyond traditional smelting.
Large smelters and electrolytic operators are requiring batch-level analytics, including particle size distribution, moisture content, metallic impurity profiles, and digital traceability, to manage electrolyte chemistry with precision. Vendors are now shipping AlF3 accompanied by machine-readable certificates, stability testing results, and recommended dosing protocols, effectively reducing in-house quality assurance burdens for buyers. In October 2024, ALCORE delivered exceptional results from its bath pilot batch reactor, increasing confidence in the technology’s ability to operate continuously and at commercial scale. This aluminum fluoride market trend is elevating quality assurance from a cost center to a competitive differentiator.
Aluminum fluoride producers are diversifying their product portfolios by developing specialty grades tailored for glass manufacturing, ceramic fluxes, and emerging applications such as cement additives. Research into AlF3 applications in novel cement chemistries and specialty glazes is revealing diversified end-use opportunities that can absorb surplus capacity or serve as strategic demand outlets when smelter utilization rates decline. Additionally, the exploration of aluminum fluoride’s role in advanced battery technologies, including aluminum-ion batteries and lithium-ion battery precursors, represents a high-growth frontier for forward-thinking producers.
In June 2025, the partnership between FLUORSID and Norsk Hydro ASA was announced, renewing the supply of AlF3 and strengthening a lasting collaboration between a leading fluorochemical producer and a global aluminum manufacturer. This development indicates sustained demand from primary aluminum producers and supports predictable capacity planning across the value chain.
Read more about this report – REQUEST FREE SAMPLE COPY IN PDF
The EMR report on the global aluminum fluoride market provides a granular analysis across three primary segmentation dimensions: type, application, and region. Understanding the performance drivers and growth trajectories within each segment is essential for stakeholders seeking to optimize procurement strategies, identify investment opportunities, and align product development with evolving market demand.
Market Breakup by Type
Key Insight: The market is segmented into three principal types: dry, wet, and anhydrous aluminum fluoride. Anhydrous aluminum fluoride dominates the market due to its critical role in aluminum electrolysis, where moisture-free material is essential for maintaining stable cryolite blends that lower liquidus temperature and improve ionic conductivity. Dry aluminum fluoride is the fastest-growing subsegment (CAGR of 4.4%), driven by its versatility across multiple industrial applications beyond aluminum smelting and its superior transportability across varied climatic conditions. Wet (hydrated) grades serve niche flux, glaze, and chemical intermediate markets. Each type requires distinct processing and packaging investments: vacuum calcination for anhydrous, desiccant packaging for dry, and controlled hydration for wet grades.
Market Breakup by Application
Key Insight: Application segments include aluminum production, chemical intermediates, glass, ceramics, and others. Aluminum production remains the largest consumer, as AlF3 is fundamental to tuning the molten cryolite bath, lowering its liquidus temperature, and improving conductivity during electrolysis. Chemical intermediates represent the fastest-growing application segment (CAGR of 4.9%), driven by innovation in downstream chemistry that leverages AlF3 as a catalyst, stabilizer, or precursor in fluorochemicals, battery materials, and specialty fluxes. Glass and ceramics applications utilize AlF3 as a flux to control melting behavior and enhance surface properties, with expanding adoption in tile manufacturing and specialty glass production.
Market Breakup by Region
Key Insight: The regional segmentation covers North America, Europe, Asia Pacific, Latin America, and the Middle East and Africa. Asia Pacific leads the global aluminum fluoride market share due to its concentrated smelter capacity, integrated refinery infrastructure, and proximity to fluorspar sources. Europe is the fastest-growing region, driven by stringent environmental regulations, smelter modernization investments, and demand for high-performance AlF3 in specialty glass and advanced ceramics. North America focuses on niche, high-purity batches and recycling pathways, while Latin America and the Middle East and Africa are emerging as both feedstock suppliers and growing industrial consumers.
Access Detailed Forecasts & Data-Driven Insights – Download Free PDF
By Type: Anhydrous Grades Lead the Market
Anhydrous aluminum fluoride holds the dominant market share because it directly feeds Hall-Heroult electrolytes, where water presence must be minimized to maintain stable electrolysis. Smelters demand tightly specified anhydrous AlF3 for stable cryolite blends that lower liquidus temperature and improve ionic conductivity, translating into more efficient electrolysis and reduced energy consumption. Producers are responding with controlled calcination and vacuum-drying technologies to supply consistent moisture-free granules and fines, often accompanied by dosing protocols for electrolyte management.
| CAGR 2026-2035 - Market by | Type |
| Dry | 4.4% |
| Wet | XX% |
| Anhydrous | XX% |
Dry aluminum fluoride is the fastest-growing type subsegment. PhosAgro is expanding its aluminum fluoride production capacity, with increases expected from mid-2026 as part of a long-term collaboration with RUSAL. Improvements in drying technology and advanced packaging solutions, including moisture-barrier sacks, desiccant integration, and palletized vacuum packing, are enabling producers to serve glass and ceramics manufacturers that require consistent flux behavior.
By Application: Aluminum Production Secures Largest Share
Aluminum production accounts for the largest share of aluminum fluoride demand, as AlF3 optimizes electrolyte conductivity and lowers the melting point of the cryolite bath, enabling efficient aluminum electrolysis at reduced energy intensities. Smelters specify purity, granulometry, and contamination limits to control cell chemistry and reduce bath foaming and fluoride emissions.
| CAGR 2026-2035 - Market by | Application |
| Chemical Intermediates | 4.9% |
| Glass | 4.2% |
| Ceramic | 3.6% |
| Aluminium | XX% |
| Others | XX% |
The chemical-intermediate application segment is the fastest-growing category, fueled by innovation in downstream fluorochemistry that uses AlF3 as a catalyst or stabilizer. Research and development activities targeting fluorine-rich intermediates for battery precursors, specialty glass, and cement admixtures are creating technical demand for tailored AlF3 grades with low metallic impurities and narrow particle distributions. In October 2025, Chemetall and Londian Wason partnered to launch an industry-first chromium- and fluoride-free passivation solution for copper foils, highlighting the expanding application landscape.


Access Detailed Forecasts & Data-Driven Insights – Download Free PDF
Asia Pacific commands the largest share of global aluminum fluoride demand, supported by its high concentration of aluminum smelters, integrated refineries, and proximity to fluorspar mining operations. China and India host major smelting and refining capacity, enabling regional suppliers to offer shortened logistics chains and just-in-time delivery capabilities. Regional policy support for downstream value-addition and investments in emission-control technologies are encouraging local AlF3 production rather than dependence on long-distance imports. India is projected to grow at a CAGR of 5.6% through the forecast period, reflecting the nation’s expanding aluminum production infrastructure and favorable industrial policies.
Europe represents the fastest-growing regional market for high-performance aluminum fluoride, driven by stringent environmental norms, smelter modernization projects, and a concerted push for higher-quality inputs to reduce energy intensity. European smelters are upgrading electrolyte systems and investing in advanced fume-control technologies that require stable, low-impurity AlF3 with consistent granulometry. Simultaneously, demand for niche AlF3 grades is expanding in specialty glass and advanced ceramics applications, particularly for automotive and industrial ceramics use cases.
The North American market is characterized by its focus on niche, high-purity aluminum fluoride batches and leadership in recycling pathways. The United States maintains stable demand linked to domestic aluminum production facilities, with approximately 85% of smelters relying on imported aluminum fluoride. Canada and Mexico contribute significantly to the regional supply chain, and the market is experiencing growth from secondary aluminum processing and specialty alloying applications. Canada is expected to grow at a CAGR of 4.1%, while Mexico is projected at 4.0% during the forecast period.
Latin America and the Middle East and Africa are emerging as both feedstock suppliers and growing industrial consumers of aluminum fluoride. Saudi Arabia is projected to achieve a CAGR of 4.7%, reflecting the region’s expanding aluminum production capacity and industrial diversification initiatives. These regions represent strategic opportunities for producers seeking to establish early market presence in developing industrial economies with growing aluminum consumption.
| CAGR 2026-2035 - Market by | Country |
| India | 5.6% |
| Saudi Arabia | 4.7% |
| Canada | 4.1% |
| Mexico | 4.0% |
| UK | 3.5% |
| USA | XX% |
| Germany | XX% |
| Italy | XX% |
| China | XX% |
| Japan | XX% |
| Australia | 3.3% |
| Brazil | XX% |
| France | 3.0% |
The competitive landscape of the aluminum fluoride market is shaped by a strategic shift from commodity-grade supply toward high-purity, low-impurity AlF3 grades that support modern cell designs used in energy-efficient smelting lines. Leading market participants are investing in differentiated chemistries, cleaner feedstock integration, and long-horizon supply partnerships with primary aluminum smelters. Companies are also deploying phosphate-free beneficiation routes and closed-loop HF recovery units to reduce operational volatility and comply with tightening regulatory frameworks.
Established in 1999, and headquartered in China, Do-fluoride Chemicals Co., Ltd, is a company involved in the production, R&D, and sales of electronic grade chemicals, high-performance inorganic fluoride salts, new energy automobiles, and lithium-ion batteries. With 228 national patents and 159 authorized patents in China, the company is a pioneer in manufacturing synthetic cryolite and quality silica white.
Based in Italy and founded in 1969, Fluorsid is a company engaged in the extraction, trading, and production of fluorine. With 9 strategic sites and more than 150 clients across the globe, the company’s production capacity is 150,000 tons of aluminum fluoride. The company operates in various markets, including gypsum and cement, through its anhydrite and gypsum productions.
Established in the year 1971, and based in Tunisia, Industries Chimique du Floor (ICF) is one of the leading producers of aluminum fluoride across the globe. Its production started in 1976. With an extensive manufacturing capacity of 42000 MT per year, the company’s aluminum fluoride is traded to the aluminum smelters. It also manufactures anhydrite, with a production capacity of 10,000 MT per year. Its anhydrite is used for export activities as well as local cement factories.
Founded in 1972 and headquartered in India, Tanfac Industries Ltd is a joint sector company that manufactures various chemicals, such as sulphuric acid, poly aluminum chloride, anhydrous hydrofluoric acid, and potassium fluoride, among others. The company is one of the leading manufacturers of hydrofluoric acid and its derivatives in India.
*Please note that this is only a partial list; the complete list of key players is available in the full report. Additionally, the list of key players can be customized to better suit your needs.*
Growth prospects remain strong in high-purity, battery-grade pathways, where partnerships between fluorochemical producers and advanced materials companies are creating new competitive dynamics.
The primary growth drivers for the aluminum fluoride market include the expanding global demand for aluminum across automotive, aerospace, construction, and packaging industries; the transition toward low-carbon aluminum production requiring high-purity electrolyte additives; increasing adoption of aluminum fluoride in chemical intermediate applications including fluorochemicals and battery precursors; and rising investments in smelter modernization and energy-efficiency optimization across all major producing regions.
Significant market opportunities are emerging from the diversification of AlF3 applications into advanced battery technologies, specialty ceramics, and novel cement chemistries; the development of fluorine circularity models and recycled feedstock streams; capacity expansion in emerging economies across the Middle East, Africa, and Latin America; and the growing premium for digitally traceable, batch-certified AlF3 grades among sustainability-focused smelters and procurement teams. The shift toward fluorosilicic acid (FSA)-based production processes, represents a particularly promising opportunity for cost reduction and environmental improvement.
While the aluminum fluoride market demonstrates a positive long-term growth trajectory, several structural challenges and industry-specific restraints continue to influence the pace and distribution of that growth. Understanding these headwinds is critical for producers, investors, and procurement teams seeking to build resilient strategies in a market shaped by raw material dependencies, regulatory complexity, and evolving technical demands.
One of the most persistent challenges confronting the aluminum fluoride market is the geographical concentration of fluorspar mining, the primary raw material for AlF3 production. More than 60% of the global fluorspar supply originates from a limited number of mining regions, with China accounting for the dominant share of both production and export volumes. This concentration creates significant supply-chain vulnerability, as any disruption stemming from trade policy changes, export restrictions, mining accidents, or logistical bottlenecks can rapidly cascade through the AlF3 value chain and disrupt downstream aluminum smelting schedules.
Fluorspar price volatility compounds this structural risk. The cost of acid-grade fluorspar, which is the feedstock quality required for hydrofluoric acid and subsequent AlF3 synthesis, has experienced notable fluctuations driven by demand-supply imbalances, Chinese environmental enforcement campaigns, and competition from alternative fluorine consumers such as the refrigerant and lithium battery industries. Producers who lack backward integration into fluorspar mining or long-term offtake agreements face margin compression during price spikes, while smaller operators without inventory buffers risk being unable to fulfil contracted volumes. The rising cost of aluminum hydroxide and sulfuric acid, both critical co-inputs, further intensifies raw material cost pressures across the supply chain.
The aluminum fluoride manufacturing process involves handling hydrogen fluoride (HF) and generates fluoride-containing emissions and waste streams that are subject to increasingly stringent environmental regulations worldwide. The European Commission’s revised Industrial Emissions Directive (IED), adopted in April 2024, imposes lower fluoride discharge thresholds for chemical manufacturing facilities across the EU, requiring producers to invest in advanced fume-scrubbing systems, waste-water treatment infrastructure, and continuous emissions monitoring equipment.
Beyond Europe, regulatory frameworks in China, India, and North America are similarly tightening. China’s environmental enforcement campaigns have periodically forced temporary shutdowns of fluorochemical production facilities, creating supply disruptions that ripple through global markets. In the United States, the Environmental Protection Agency (EPA) maintains strict reporting and permitting requirements for fluoride emissions under the Clean Air Act and the Toxic Substances Control Act. Compliance with these evolving regulations requires sustained capital investment and operational expenditure, which disproportionately impacts smaller and mid-tier producers who lack the financial resources to implement comprehensive environmental management systems.
Aluminum fluoride production is inherently energy-intensive, particularly during the calcination and drying stages that are essential for producing anhydrous and dry-grade AlF3. The energy cost component typically represents a substantial portion of total manufacturing costs, making producers highly sensitive to fluctuations in natural gas, electricity, and coal prices. The global energy market volatility witnessed since 2022 has significantly compressed operating margins for AlF3 producers, especially those operating in regions without access to subsidised or contract-locked energy supplies.
European producers have been particularly affected by elevated energy costs, which have eroded their competitive position relative to counterparts in the Middle East, Central Asia, and parts of China that benefit from lower energy pricing. This cost differential is accelerating the shift in production capacity toward energy-advantaged regions, creating competitive imbalances that challenge the long-term viability of some legacy production facilities in high-cost jurisdictions.
Modern aluminum smelters operating advanced Hall-Heroult cell designs are demanding progressively tighter purity specifications for their AlF3 inputs. Requirements for trace-impurity limits on elements such as iron, silicon, phosphorus, and sodium have tightened considerably, as even minor deviations in electrolyte chemistry can trigger cell voltage instability, increased energy consumption, bath foaming, and elevated fluoride emissions. Meeting these specifications requires producers to invest in advanced purification technologies, precision analytical equipment, and robust quality management systems that add complexity and cost to manufacturing operations.
While aluminum fluoride remains the industry-standard flux additive for the Hall-Heroult process, ongoing research into alternative electrolyte chemistries and novel smelting technologies poses a long-term substitution risk. Inert anode technology, which several major aluminum producers are investing in, could potentially alter the electrolyte composition requirements and reduce or modify the role of AlF3 in future smelting operations. In non-smelting applications, aluminum fluoride faces competition from alternative flux materials such as sodium fluoride and cryolite-based alternatives that can serve similar fluxing functions in glass and ceramics manufacturing.
Aluminum fluoride, particularly in its anhydrous form, requires careful handling, packaging, and storage to prevent moisture absorption, which can degrade product quality and render it unsuitable for electrolytic applications. The hygroscopic nature of certain AlF3 grades necessitates investment in moisture-barrier packaging, desiccant-integrated storage solutions, and climate-controlled warehousing, all of which add to the total delivered cost. Long-distance transportation, particularly across maritime routes, presents additional challenges related to moisture exposure, container contamination, and customs classification inconsistencies.
The aluminum fluoride market operates within a broader geopolitical landscape shaped by trade tensions, export controls, and strategic resource policies that can rapidly alter supply-demand dynamics. China’s dominance in both fluorspar mining and AlF3 production means that any shift in Chinese trade policy, whether through export tariffs, licensing requirements, or strategic stockpiling, can create significant market disruption. The evolving sanctions landscape, trade route disruptions, and freight cost volatility further complicate procurement planning for aluminum fluoride buyers, favouring vertically integrated producers with diversified geographic footprints.
Unlock the latest insights with our aluminum fluoride market trends 2026 report. Discover regional growth patterns, segmentation analysis, competitive dynamics, and key industry developments. Stay ahead of the competition with trusted data and expert analysis. Download your free sample report today and drive informed decisions in the aluminum fluoride market.
Upto 15% Off
USD
$2499 $2249
$3999 $3599
$4999 $4249
$5999 $5099


*While we strive to always give you current and accurate information, the numbers depicted on the website are indicative and may differ from the actual numbers in the main report. At Expert Market Research, we aim to bring you the latest insights and trends in the market. Using our analyses and forecasts, stakeholders can understand the market dynamics, navigate challenges, and capitalize on opportunities to make data-driven strategic decisions.*
The global aluminum fluoride market reached a valuation of approximately USD 2.56 Billion in 2025, driven by sustained demand from aluminum smelting operations and expanding applications in chemical intermediates, glass, and ceramics manufacturing.
The market is projected to grow at a compound annual growth rate (CAGR) of 6.10% between 2026 and 2035, reaching an estimated value of USD 4.63 Billion by the end of the forecast period.
Anhydrous aluminum fluoride dominates the market because of its critical role in aluminum electrolysis, where moisture-free material is essential for stable cryolite bath performance and efficient ionic conductivity.
Dry aluminum fluoride is the fastest-growing type segment, expanding at a CAGR of 4.4%, driven by its versatility across multiple industrial applications and ease of transport and storage across varied climates.
Chemical intermediates represent the fastest-growing application segment, with a CAGR of 4.9%, as innovation in downstream fluorochemistry leverages AlF3 as a catalyst, stabilizer, or precursor in battery materials and specialty fluxes.
Asia Pacific holds the largest market share due to its high concentration of aluminum smelters, integrated refineries, and proximity to fluorspar mining resources, with China and India as the leading consuming nations.
Primary drivers include expanding global aluminum demand across automotive and construction sectors, the transition to low-carbon smelting requiring higher-purity AlF3, growing applications in chemical intermediates and battery technologies, and increasing investment in smelter modernization.
Key players include Do-Fluoride Chemicals Co., Ltd (China), Fluorsid S.p.A. (Italy), Industries Chimiques du Fluor (Tunisia), and Tanfac Industries Ltd. (India), among others.
Aluminum fluoride serves as a flux additive in the Hall-Heroult electrolytic process, where it lowers the melting point of alumina, improves the ionic conductivity of the cryolite bath, and enhances current efficiency, enabling aluminum extraction at reduced energy consumption levels.
Key challenges include volatile fluorspar supply concentration, tightening environmental regulations on fluoride emissions, rising energy costs impacting production economics, and the technical difficulty of meeting increasingly stringent purity specifications while maintaining competitive pricing.
In glass and ceramics, aluminum fluoride acts as a flux that controls melting behavior, lowers firing temperatures, improves surface properties, and enhances chemical resistance. Its use has expanded significantly in tile manufacturing and specialty glass production.
The global aluminum fluoride market is projected to achieve a valuation of approximately USD 4.63 Billion by 2035, growing from USD 2.56 Billion in 2025 at a CAGR of 6.10% during the forecast period.
Explore our key highlights of the report and gain a concise overview of key findings, trends, and actionable insights that will empower your strategic decisions.
| REPORT FEATURES | DETAILS |
| Base Year | 2025 |
| Historical Period | 2019-2025 |
| Forecast Period | 2026-2035 |
| Scope of the Report |
Historical and Forecast Trends, Industry Drivers and Constraints, Historical and Forecast Market Analysis by Segment:
|
| Breakup by Type |
|
| Breakup by Application |
|
| Breakup by Region |
|
| Market Dynamics |
|
| Competitive Landscape |
|
| Companies Covered |
|
| Report Price and Purchase Option | Explore our purchase options that are best suited to your resources and industry needs. |
| Delivery Format | Delivered as an attached PDF and Excel through email, with an option of receiving an editable PPT, according to the purchase option. |
Datasheet
One User
USD 2,499
USD 2,249
tax inclusive*
Single User License
One User
USD 3,999
USD 3,599
tax inclusive*
Five User License
Five User
USD 4,999
USD 4,249
tax inclusive*
Corporate License
Unlimited Users
USD 5,999
USD 5,099
tax inclusive*
*Please note that the prices mentioned below are starting prices for each bundle type. Kindly contact our team for further details.*
Flash Bundle
Small Business Bundle
Growth Bundle
Enterprise Bundle
*Please note that the prices mentioned below are starting prices for each bundle type. Kindly contact our team for further details.*
Flash Bundle
Number of Reports: 3
20%
tax inclusive*
Small Business Bundle
Number of Reports: 5
25%
tax inclusive*
Growth Bundle
Number of Reports: 8
30%
tax inclusive*
Enterprise Bundle
Number of Reports: 10
35%
tax inclusive*
How To Order

Select License Type
Choose the right license for your needs and access rights.

Click on ‘Buy Now’
Add the report to your cart with one click and proceed to register.

Select Mode of Payment
Choose a payment option for a secure checkout. You will be redirected accordingly.
Strategic Solutions for Informed Decision-Making
Gain insights to stay ahead and seize opportunities.

Get insights & trends for a competitive edge.

Track prices with detailed trend reports.

Analyse trade data for supply chain insights.

Leverage cost reports for smart savings

Enhance supply chain with partnerships.

Connect For More Information
Our expert team of analysts will offer full support and resolve any queries regarding the report, before and after the purchase.
Our expert team of analysts will offer full support and resolve any queries regarding the report, before and after the purchase.
We employ meticulous research methods, blending advanced analytics and expert insights to deliver accurate, actionable industry intelligence, staying ahead of competitors.
Our skilled analysts offer unparalleled competitive advantage with detailed insights on current and emerging markets, ensuring your strategic edge.
We offer an in-depth yet simplified presentation of industry insights and analysis to meet your specific requirements effectively.


