Consumer Insights
Uncover trends and behaviors shaping consumer choices today
Procurement Insights
Optimize your sourcing strategy with key market data
Industry Stats
Stay ahead with the latest trends and market analysis.
The armored personnel carrier (APC) market was valued at USD 21.00 Billion in 2025. The market is expected to grow at a CAGR of 6.40% during the forecast period of 2026-2035 to reach a value of USD 39.05 Billion by 2035. Rising defense budgets, fleet replacement programs, and the need for protected troop mobility are collectively driving the market growth.
The current armored personnel carrier market dynamics reflect a sharp rise in defense budgets and a clear policy push to rebuild land forces. At the Hague Summit on 25 June 2025, NATO allies committed to spend 5% of GDP annually on defense by 2035, with at least 3.5% on core defense needs, and agreed to review the trajectory in 2029. This pledge supports long term vehicle replacement programs, as armies need protected troop carriers, upgraded fleets, and larger stocks. Suppliers with proven designs, modular platforms, and local production options are better placed to win these multi year orders as governments turn budget pledges into contracts.
The overall armored personnel carrier market value is also supported by rising public spending and new financing tools. According to the Stockholm International Peace Research Institute, world military expenditure reached USD 2,887 billion in 2025, up 2.9% in real terms, while spending in Europe rose 14% to USD 864 billion. The European Union's SAFE instrument adds up to EUR 150 billion in loans for joint defense purchases. Funding of this kind lets smaller states buy together and lower unit prices. Buyers weigh price, protection, and delivery times, so manufacturers with scalable plants, modular platforms, and partner assembly lines can convert this funding into firm orders.
Compound Annual Growth Rate
6.4%
Value in USD Billion
2026-2035
Read more about this report - REQUEST FREE SAMPLE COPY IN PDF
|
Armored Personnel Carrier (APC) Market Report Summary |
Description |
Value |
|
Base Year |
USD Billion |
2025 |
|
Historical Period |
USD Billion |
2019-2025 |
|
Forecast Period |
USD Billion |
2026-2035 |
|
Market Size 2025 |
USD Billion |
21.00 |
|
Market Size 2035 |
USD Billion |
39.05 |
|
CAGR 2019-2025 |
Percentage |
XX% |
|
CAGR 2026-2035 |
Percentage |
6.40% |
|
CAGR 2026-2035 - Market by Region |
Europe |
7.6% |
|
CAGR 2026-2035 - Market by Type |
Wheeled APCs |
7.0% |
|
CAGR 2026-2035 - Market by Weight Class |
Medium APCs |
6.6% |
|
2025 Market Share by Region |
Europe |
27.0% |
The armored personnel carrier market is being shaped by Patria's new plant in Latvia, MAC HUB's OWL-APC, Thales Australia's Bushmaster Mulga, and Otokar's acquisition of Automecanica. New plants, vehicle launches, and acquisitions are further reshaping the competitive landscape for vehicle makers and armies.
Patria laid the foundation stone for a new production facility in Valmiera, Latvia, in October 2026, where it will build Patria 6x6 armored personnel carriers and assemble HUNTER infantry fighting vehicles for GDELS. Completion was planned for the third quarter of 2027. Vehicle makers across the armored personnel carrier market can leverage this by locating final assembly close to allied buyers to meet local production demands.
MAC HUB of Ukraine presented its OWL-APC armored personnel carrier in August 2026, featuring blast protection against anti-tank mines, artificial intelligence-based systems, and a Tavria remote weapon station firing 14.5 mm and 7.62 mm rounds. Combat lessons strongly shaped the design. New entrants across the armored personnel carrier market can leverage this by building battlefield feedback into protection, sensors, and weapon packages from the start.
Thales Australia unveiled the Bushmaster Mulga utility variant at Eurosatory in June 2026, with a four-meter tray, left hand drive for export, a RapidStriker counter drone system, a 70 mm laser guided rocket, and a radar. Australia had 290 Bushmasters on order. Vehicle makers can leverage this by offering mission kits that add counter drone and fire support roles.
Otokar of Turkey agreed in January 2026 to acquire 96.77% of Automecanica of Romania for a reported EUR 85 million, building on their 50:50 joint venture SAROM, which builds Cobra II armored vehicles. The agreement was only a memorandum of understanding. Vehicle makers across the armored personnel carrier market can leverage this by buying local partners to secure plants, workforce, and access to European defense orders.
Armies across the armored personnel carrier market are adding hybrid electric drive to armored vehicles for quiet movement, lower fuel use, and onboard power. For example, in July 2026, Turkey's Land Forces received the first three of 50 E-ZPT armored personnel carriers from MKE, an M113 based carrier with a domestic hybrid powertrain and an electric range of up to 150 km, or 650 km with the generator. Operators also gain lower running costs across the whole service life. Hybrid drive also supports silent watch missions.
European rearmament is moving from budgets to large production orders for armored vehicles. For instance, in June 2026, Poland ordered 146 Borsuk infantry fighting vehicles from Huta Stalowa Wola and PGZ for about PLN 7.5 billion (USD 2.07 billion), lifting its fleet to 257 vehicles, within PLN 60 billion of purchases planned under the EU SAFE loan programme. Orders of this scale keep hull, turret, armor, sensor, and electronics supplier lines busy for many years, and encourage new factory capacity.
Armies across the armored personnel carrier market are replacing ageing tracked carriers that no longer meet protection and power needs. Following such trends, in March 2026, the US Army planned funding of USD 250 million for 50 AMPV vehicles, up from a planned 38 after a lower unit price was negotiated, as the programme replaces 2,897 M113 carriers. Lower unit prices help armies buy larger numbers within fixed budgets. The programme also adds variants for medical treatment, mission command, and mortar roles, which broadens overall demand.
Buyers across the armored personnel carrier market increasingly want one hull in many variants, so manufacturers sell modular platforms with mission kits. Demonstrating this shift, in August 2026, Norway ordered 20 Patria 6x6 vehicles for NOK 500 million, covering medical evacuation and command variants, with an option for 40 more and readiness for Kongsberg Protector RS4 remote weapon stations. Common hulls cut spare parts and training costs across variants. Operators also gain flexibility to change vehicle roles as threats evolve and delivery schedules shorten over time.
Many armies in emerging regions buy proven vehicles through government-to-government programs rather than new designs. As an illustration, in August 2026, Argentina accepted 235 Stryker 8x8 vehicles from the United States, including infantry carrier, command post, fire support, and medical evacuation versions, with an initial 50 expected and 8 delivered between late 2025 and early 2026. Programs like this keep older fleets moving across the armored personnel carrier market. Such deals also bring training, spare parts, and support packages that extend fleet service life.
The Expert Market Research's report titled "Armored Personnel Carrier (APC) Market Report and Forecast 2026-2035" offers a detailed analysis of the market based on the following segments:
Market Breakup by Type
Key Insight: Wheeled APCs dominate the armored personnel carrier market by type, as armies value road speed, lower running costs, and easy transport over long distances, and they are also the fastest growing. Tracked APCs remain important for rough terrain and heavy protection, but they grow more slowly. Showing wheeled demand, in December 2025, Germany signed two serial contracts for up to 876 Patria 6x6 vehicles under the multinational CAVS programme, worth over EUR 2 billion including options.
Market Breakup by Weight Class
Key Insight: Medium APCs dominate the armored personnel carrier market by weight class, as they balance protection, payload, and mobility, and they are also the fastest growing. Light APCs follow on patrol and internal security needs, while heavy APCs serve armored units that need tank level protection. Showing light vehicle demand, in July 2026, Romania received the first 12 locally built Cobra II vehicles under a contract for 1,059 vehicles in nine configurations.
Market Breakup by Application
Key Insight: Troop transport dominates the armored personnel carrier market by application, as carrying soldiers under armor remains the core role, while command and control is the fastest growing. Medical evacuation and reconnaissance add steady demand, and others such as mortar carriers and engineering versions follow main fleet orders. Showing reconnaissance demand, in October 2025, Germany ordered 274 Luchs 2 reconnaissance vehicles on a 6x6 chassis, with an option for 82 more, in a deal worth just over EUR 3.5 billion.
Market Breakup by Mode of Operation
Key Insight: Manned vehicles dominate the armored personnel carrier market by mode of operation, as armies still rely on crews for assault and transport, while optionally manned vehicles are the fastest growing as armies test crew reduction and remote use. Showing unmanned systems demand, in February 2026, Elbit Systems won a contract of about USD 277 million to supply UT30 MK2 unmanned 30 mm turrets and ammunition over three years, reported to equip 8x8 vehicles built in Morocco.
Market Breakup by Region
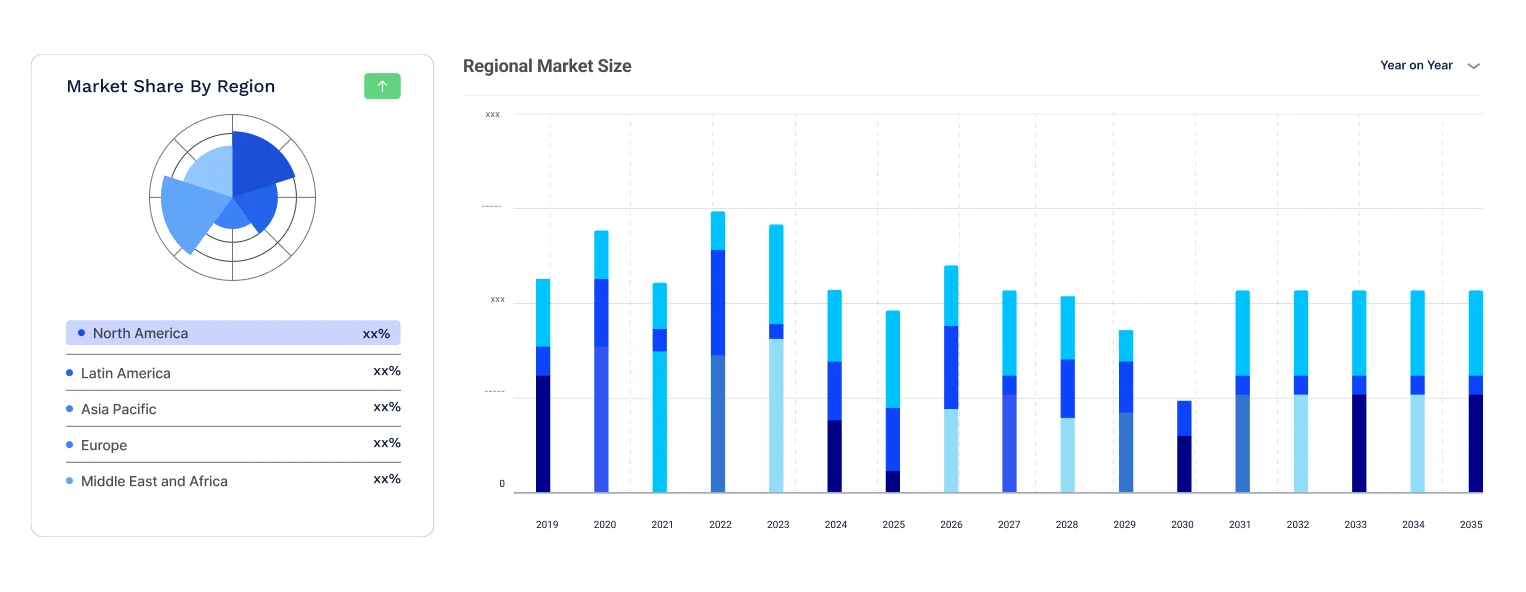
Key Insight: North America dominates the armored personnel carrier market on its large, funded armies and local production, while Europe is the fastest growing on rearmament. Asia Pacific grows on border security needs and fleet renewal, Latin America on upgrades of older vehicles, and the Middle East and Africa on internal security demand. Showing European demand, in October 2026, Rheinmetall and ARTEC received an option for 69 more Boxer Schakal vehicles, 35 for Germany and 34 for the Netherlands, taking the fleet to 291.
Read more about this report - REQUEST FREE SAMPLE COPY IN PDF
By type, wheeled APCs dominate on road speed, lower running costs, and easy deployment
Wheeled APCs account for the largest share of the armored personnel carrier market by type, because armies value road speed, lower running costs, and easy transport over long distances. Many forces use them for peacekeeping, border security, and expeditionary tasks where roads exist. Newer 6x6 and 8x8 designs also offer strong mine protection and modular mission kits. Tracked APCs keep a firm share in armored brigades that must cross rough ground with heavy protection and firepower in very difficult conditions.
Wheeled APCs are also the fastest growing type as armies buy 6x6 and 8x8 vehicles in large numbers. In June 2026, the Philippines selected five Chaiseri 8x8 amphibious vehicles worth PHP388.9 million for its Marine Corps, showing how Asian buyers favor wheeled designs for island and coastal tasks. Tracked APCs grow more slowly, helped by replacement of older carriers, though fewer new programs are launched each year. Easier maintenance with shared drivetrains also cuts support costs for many fleet owners.
By weight class, medium APCs dominate on a balance of protection, payload, and mobility
Medium APCs account for the largest share of the armored personnel carrier market by weight class, because they balance protection, payload, and mobility for infantry squads. Most large fleet programs sit in this range, so suppliers can spread development costs over many vehicles. Light APCs follow, serving patrol, border, and internal security tasks at a lower price. Heavy APCs hold a smaller share, serving armored units that need tank level protection and the heaviest armament, but at high unit cost.
Medium APCs are also the fastest growing weight class as armies seek more protection without losing deployability. In September 2026, Sweden ordered five Patria TRACKX tracked carriers for testing and Finland placed a EUR 13 million pre series order, with deliveries starting in 2027. Light APCs grow on demand from smaller forces, while heavy APCs rise slowly because their high-cost limits how many armies can buy them. Armies also weigh transport weight limits, bridge classes, and rail loading rules.
By application, troop transport dominates because carrying soldiers under armor is the core role
Troop transport accounts for the largest share of the armored personnel carrier market by application, because carrying infantry safely to the battlefield remains the core role of every fleet. Armies buy these vehicles in the largest numbers and keep them in service for decades. Reconnaissance vehicles follow, serving scouting and surveillance needs. Command and control, medical evacuation, and other roles such as mortar carriers use the same hulls with different interior kits. Fleet commonality keeps training and support costs lower.
Command and control are the fastest growing application as armies need networked vehicles with radios, displays, and extra power. In May 2026, Romania ordered 298 Lynx vehicles from Rheinmetall, with most as carriers and others as reconnaissance, command post, and medical versions, in a EUR 5.7 billion package. Medical evacuation grows on better casualty care rules, while other applications follow general fleet spending and upgrade cycles. Orders for these specialist versions usually follow the main carrier contracts by several years.
By mode of operation, manned vehicles dominate because crews remain central to assault and transport
Manned vehicles account for the largest share of the armored personnel carrier market by mode of operation, because armies still rely on crews to drive, command, and fight from the vehicle. Almost every fleet in service and every large order is manned, and crew training systems are well established. Optionally manned vehicles remain a small but visible share, shaped by trials that test remote driving, crew reduction, and safer approaches to dangerous tasks. Safety rules also slow adoption of autonomy.
Optionally manned vehicles are the fastest growing mode as armies test autonomy to reduce crew risk. In October 2025, an autonomous AMPV prototype for the US Army was announced as ready for testing by May 2026. Manned vehicles still grow with fleet spending, since optional autonomy is added to proven platforms first, and buyers want evidence of safety, reliability, and cost before ordering larger quantities. Command and control, resupply, and reconnaissance roles are likely early uses of optional manning soon.
North America dominates the market due to its large and well-funded armies
North America dominates the armored personnel carrier market, as it has the largest and best funded armies, deep local production, and long running fleet modernization plans. The United States keeps large tracked and wheeled fleets in service and funds steady replacement programs. Canada adds demand through vehicle upgrades and support contracts. Local content rules and trusted supplier relationships favor domestic manufacturers, which keeps the region ahead of the others in total value. Export sales also add scale for several suppliers.
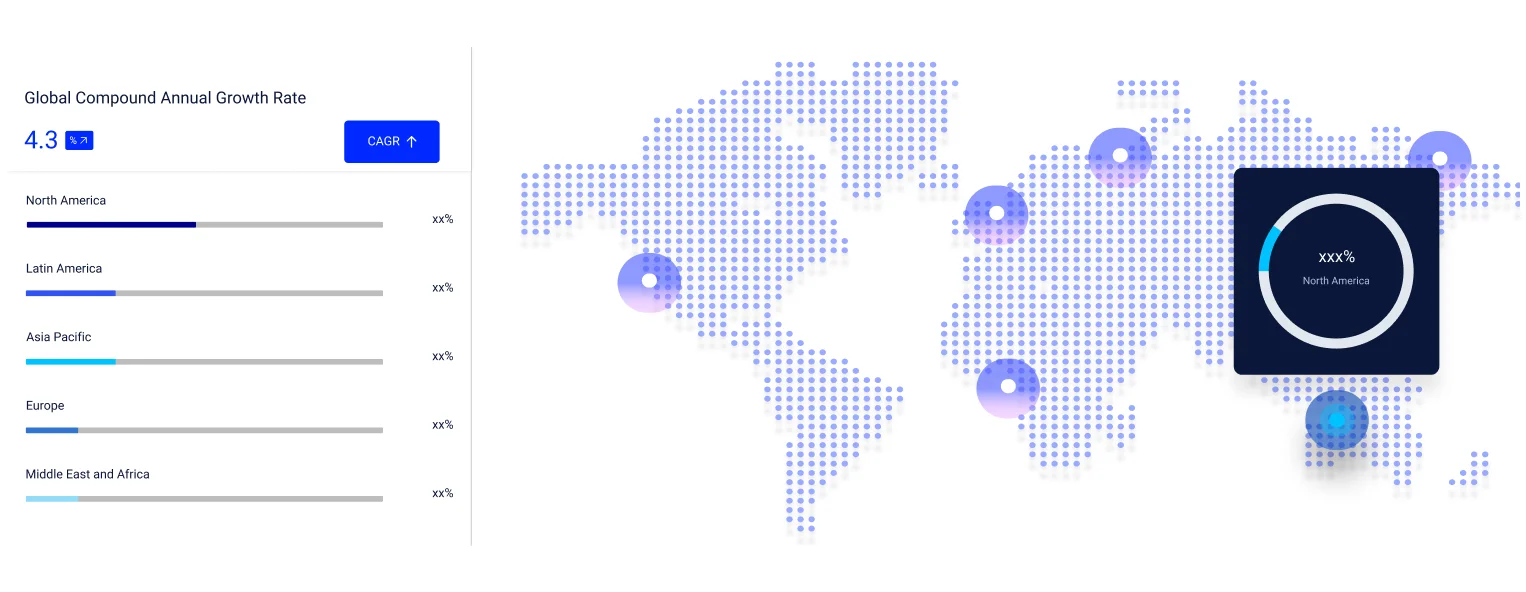
Europe is the fastest growing region in the armored personnel carrier market, as governments raise defense budgets and replace older carriers. In February 2026, the Council of the European Union began approving EU SAFE loan funding for member states, with 18 countries cleared by April 2026. Asia Pacific, Latin America, and the Middle East and Africa grow on border security needs, fleet renewals, and local assembly agreements with foreign suppliers. Local assembly deals also create jobs and shorten delivery times.
|
CAGR 2026-2035 - Market by |
Region |
|
North America |
5.4% |
|
Europe |
7.6% |
|
Asia Pacific |
6.6% |
|
Latin America |
5.2% |
|
Middle East and Africa |
6.2% |
The global armored personnel carrier market is competitive, as armored personnel carrier market players include land systems groups, defense electronics suppliers, and specialist vehicle makers from Europe, North America, and Asia, each competing on protection, mobility, price, and delivery time. Companies like BAE Systems plc, General Dynamics Corporation, Rheinmetall AG, and KNDS N.V. lead through scale and large programs, while Hanwha Aerospace Co., Ltd., Patria Oyj, Oshkosh Corporation, Elbit Systems Ltd., and Otokar Otomotiv ve Savunma Sanayi A.S. add depth.
Leading armored personnel carrier companies are differentiating through modular platforms, hybrid drive, active protection, and local production. Several are also building new plants, forming partnerships, and acquiring regional partners to win domestic orders and reduce delivery times. Growing focus on mine protection, counter drone defense, and lower life cycle costs is helping companies broaden portfolios, reach new customers, and support sustained long term growth across several regions.
BAE Systems plc, headquartered in London, United Kingdom, was founded in 1999 through the merger of British Aerospace and Marconi Electronic Systems. Its land vehicle range includes the CV90 infantry fighting vehicle and the AMPV tracked carrier for the US Army. The company reported 2025 sales of GBP 30,662 million and an order backlog of GBP 83.6 billion.
General Dynamics Corporation, headquartered in Reston, Virginia, was founded in 1952. Its land systems business builds the Stryker armored vehicle and, through MOWAG, acquired in 2004, the Piranha and Eagle wheeled vehicles. The company reported 2025 revenue of USD 52,550 million, including USD 9,246 million in Combat Systems.
Rheinmetall AG, headquartered in Dusseldorf, Germany, was founded in 1889. Its vehicle portfolio includes the Boxer wheeled carrier, the Lynx tracked vehicle, and the Fuchs transport vehicle. The company reported 2025 sales of EUR 9,935 million and a backlog of EUR 63.8 billion.
KNDS N.V., headquartered in Amsterdam, the Netherlands, was founded in 2015 when KMW and Nexter completed their association. Its armored vehicle range includes the Boxer, Puma, Griffon, and Serval. The company reported 2025 revenue of EUR 4.4 billion and a record order intake of EUR 13.5 billion.
Other key players in the market report include Hanwha Aerospace Co., Ltd., Patria Oyj, Oshkosh Corporation, Elbit Systems Ltd., and Otokar Otomotiv ve Savunma Sanayi A.S., among others.
*Please note that this is only a partial list; the complete list of key players is available in the full report. Additionally, the list of key players can be customized to better suit your needs.*
Discover the key trends shaping the armored personnel carrier market 2026-2035 through our in-depth report. Access strategic insights, forward looking forecasts, and major market developments that help you stay ahead of competitors. Request a free sample report or speak with our team for tailored guidance on the armored personnel carrier market trends 2026.


Upto 15% Off
USD
$2499 $2249
$3999 $3599
$4999 $4249
$5999 $5099


*While we strive to always give you current and accurate information, the numbers depicted on the website are indicative and may differ from the actual numbers in the main report. At Expert Market Research, we aim to bring you the latest insights and trends in the market. Using our analyses and forecasts, stakeholders can understand the market dynamics, navigate challenges, and capitalize on opportunities to make data-driven strategic decisions.*
In 2025, the armored personnel carrier market reached an approximate value of USD 21.00 Billion.
The market is projected to grow at a CAGR of 6.40% between 2026 and 2035.
The key players in the market include BAE Systems plc, General Dynamics Corporation, Rheinmetall AG, KNDS N.V., Hanwha Aerospace Co., Ltd., Patria Oyj, Oshkosh Corporation, Elbit Systems Ltd., and Otokar Otomotiv ve Savunma Sanayi A.S., among others.
Leading companies are developing modular and hybrid vehicles, building local plants, forming partnerships and joint ventures, and acquiring regional partners to win government programs.
Key challenges include tight defense budgets in some countries, long procurement timelines, export approvals, supply chain constraints, and high unit costs for heavier vehicles.
Explore our key highlights of the report and gain a concise overview of key findings, trends, and actionable insights that will empower your strategic decisions.
|
Report Features |
Details |
|
Base Year |
2025 |
|
Historical Period |
2019-2025 |
|
Forecast Period |
2026-2035 |
|
Scope of the Report |
Historical and Forecast Trends, Industry Drivers and Constraints, Historical and Forecast Market Analysis by Segment:
|
|
Breakup by Type |
|
|
Breakup by Weight Class |
|
|
Breakup by Application |
|
|
Breakup by Mode of Operation |
|
|
Breakup by Region |
|
|
Market Dynamics |
|
|
Competitive Landscape |
|
|
Companies Covered |
|
Datasheet
One User
USD 2,499
USD 2,249
tax inclusive*
Single User License
One User
USD 3,999
USD 3,599
tax inclusive*
Five User License
Five User
USD 4,999
USD 4,249
tax inclusive*
Corporate License
Unlimited Users
USD 5,999
USD 5,099
tax inclusive*
*Please note that the prices mentioned below are starting prices for each bundle type. Kindly contact our team for further details.*
Flash Bundle
Small Business Bundle
Growth Bundle
Enterprise Bundle
*Please note that the prices mentioned below are starting prices for each bundle type. Kindly contact our team for further details.*
Flash Bundle
Number of Reports: 3
20%
tax inclusive*
Small Business Bundle
Number of Reports: 5
25%
tax inclusive*
Growth Bundle
Number of Reports: 8
30%
tax inclusive*
Enterprise Bundle
Number of Reports: 10
35%
tax inclusive*
How To Order

Select License Type
Choose the right license for your needs and access rights.

Click on ‘Buy Now’
Add the report to your cart with one click and proceed to register.

Select Mode of Payment
Choose a payment option for a secure checkout. You will be redirected accordingly.
Strategic Solutions for Informed Decision-Making
Gain insights to stay ahead and seize opportunities.
Get insights & trends for a competitive edge.
Track prices with detailed trend reports.
Analyse trade data for supply chain insights.
Leverage cost reports for smart savings
Enhance supply chain with partnerships.
Connect For More Information
Our expert team of analysts will offer full support and resolve any queries regarding the report, before and after the purchase.
Our expert team of analysts will offer full support and resolve any queries regarding the report, before and after the purchase.
We employ meticulous research methods, blending advanced analytics and expert insights to deliver accurate, actionable industry intelligence, staying ahead of competitors.
Our skilled analysts offer unparalleled competitive advantage with detailed insights on current and emerging markets, ensuring your strategic edge.
We offer an in-depth yet simplified presentation of industry insights and analysis to meet your specific requirements effectively.