Explore Our Diverse Range Of Offerings
From detailed reports to experts services offered in 15+ Industry Domains
Report
Press Release
Blogs
Industry Statistics
Add 2 More Reports For 20% off

Asia Pacific Fast Food Market Report Overview

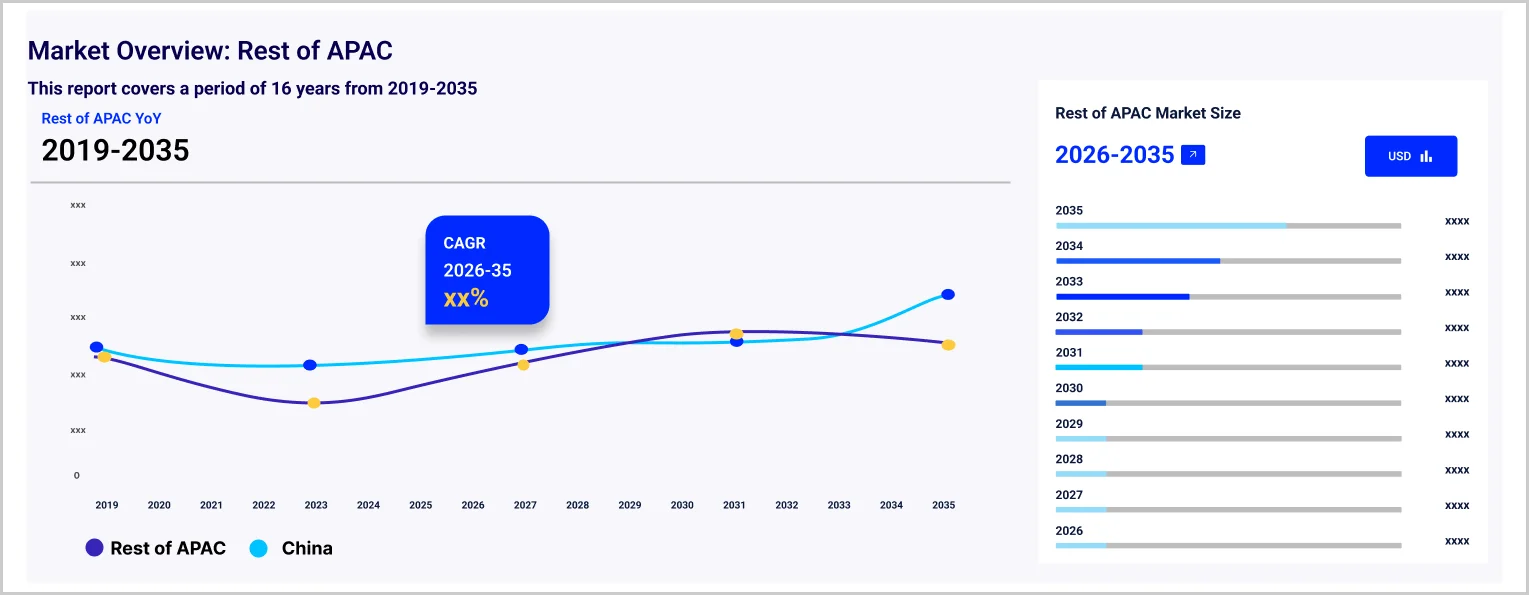
The Asia Pacific fast food market size reached USD 373.78 Billion in 2025. The market is expected to grow at a CAGR of 5.66% between 2026 and 2035, reaching USD 648.22 Billion by 2035.

Q1 2026 Market Updates

Geopolitical Impact of Iran, US, and Israel War on the Asia Pacific Fast Food Market

United States: The Asia Pacific Fast Food Market, a key segment of the global economy, is experiencing a complex operating environment in Q1 2026 as a direct consequence of the US-Israel-Iran war. Approximately one-third of globally traded urea passes through the Strait of Hormuz. Urea prices have surged 50%, threatening crop yields for the 2026 Northern Hemisphere growing season. A 'grocery supply emergency' is affecting GCC states with 70% of food imports disrupted. The WFP warns of record global food insecurity affecting 45 million more people. Food packaging materials including PET bottles, polyethylene films, and polystyrene containers are facing 15-20% cost increases from petrochemical feedstock inflation. Ocean freight costs are up 30% from conflict-related rerouting, directly inflating the delivered cost of imported food ingredients and finished products. For US-based markets, Urea nitrogen fertilizer prices at the New Orleans import hub jumped 32% in the first week of conflict, reaching around USD 700 per metric ton - up from USD 400-490 before the war began. with ripple effects across the entire food production and packaging supply chain.

Iran: Iran's domestic Asia Pacific Fast Food sector has been effectively suspended by the conflict. US-Israeli strikes on industrial and civilian infrastructure across Tehran, Mashhad, Isfahan, and other major cities have disrupted all commercial activity. Power outages from attacks on electricity generation facilities have halted manufacturing operations, and the collapse of the commercial banking and logistics system has eliminated any residual trade flows. The broader humanitarian crisis, with over 1,900 casualties and 4,000+ civilian buildings damaged, has redirected the entire Iranian economy toward survival rather than production or consumption.

Israel: Israel's Asia Pacific Fast Food sector is experiencing near-term disruption from wartime conditions. Consumer spending on non-essential categories has declined as millions of Israelis regularly shelter from missile and drone alerts. Supply chain logistics are disrupted by regional airspace closures, elevated war-risk insurance premiums, and the suspension of major carrier services through the region. International business partnerships with Israeli companies have been temporarily suspended. Post-conflict reconstruction and recovery demand is expected to provide meaningful demand acceleration across affected market segments once operational conditions normalise.

Key Takeaways

Government

  • Relevant agricultural ministries should activate emergency fertilizer procurement and subsidy programmes to offset the 50% surge in nitrogen fertilizer costs, ensuring that the spring planting season is not critically disrupted.
  • Food security agencies should assess domestic reserve levels for key food categories and coordinate strategic reserve releases to moderate consumer price inflation driven by Gulf-linked supply disruptions.
  • Trade authorities should review import diversification strategies for food inputs that have been disrupted by the Strait of Hormuz closure, establishing alternative supply pathways from non-Gulf producers.

Market

  • The 50% surge in nitrogen fertilizer costs, intersecting with the Northern Hemisphere spring planting season, is creating the most acute farm-level cost shock since the 2022 Russia-Ukraine fertilizer crisis, with potential yield impacts emerging in Q3-Q4 2026.
  • Ocean freight cost increases of 30% and war-risk insurance surcharges are directly inflating the landed cost of imported food ingredients and finished products across all distribution channels.
  • The asia pacific fast food market's long-term demand drivers, including population growth, urbanisation, and evolving consumer preferences, remain intact and independent of the conflict, supporting the market's fundamental growth trajectory.

Procurement

  • Food manufacturers should immediately advance forward purchasing of nitrogen fertilizer and key agricultural commodities ahead of further conflict-driven price increases, locking in current pricing for the 2026 crop year.
  • Procurement teams should review packaging material sourcing, building precautionary inventory of PET, HDPE, and other petroleum-derived food packaging materials facing 15-20% cost increases from the petrochemical supply shock.
  • Buyers should diversify origin sourcing for key food ingredients away from Gulf-disrupted supply routes, establishing procurement relationships with alternative suppliers in non-conflict-zone origin markets.
  • INVEST India projects India's consumer spending to reach $6 trillion by 2030, fuelling growth in the fast-food sector.

  • Australia's adult population aged 20-39 was reported as 7,264,645 by the Australian Institute of Health and Welfare in 2022.

  • As per the Australian Taxation Office, the pizza foodservice sector in Australia surged by 37% in 2021-22, driven by average sales exceeding $600,000

Compound Annual Growth Rate

5.66%

Value in USD Billion

2026-2035


Burgers and sandwiches contribute to the Asia Pacific fast food market growth due to their portability, making them convenient for consumption while on the move

Burgers and sandwiches offer extensive personalization, meeting diverse dietary needs and preferences. Their nostalgic charm makes them a preferred option for quick and satisfying meals. Being portable and competitively priced, they accommodate busy lifestyles. Their swift preparation and potential for innovation drive sales, while easy pairing enhances cross-promotion and revenue.

Asian and Latin American cuisines boast diverse flavours and ingredients, appealing to adventurous eaters. Emphasizing fresh produce and lean proteins, they provide healthier fast-food choices. Additionally, they offer cultural exploration, global popularity, customizable options, innovation, and opportunities for cross-cultural fusion, stimulating consumer interest and sales.

By March 2023, Mos Burger, a Japanese burger chain, had embraced the meat-free trend since 2015, introducing soy-based vegetable protein patties. Their pioneering move in 2020, offering Japan's first fully vegan burger, garnered attention. They continued diversifying their animal-free menu, introducing items like the vegan teriyaki burger.

Market Segmentation

"Asia Pacific Fast Food Market Report and Forecast 2026-2035" offers a detailed analysis of the market based on the following segments:

Market Breakup by Product Type

  • Pizza/Pasta
  • Burgers/Sandwiches
  • Asian/Latin American Food
  • Others

Market Breakup by End Use

  • Full-Service Restaurants
  • Quick Service Restaurants

Market Breakup by Region

  • China
  • Japan
  • India
  • ASEAN
  • Australia
  • Others

Competitive Landscape

The Asia Pacific fast food market key players are:-

  • Wendy’s International, LLC
  • Domino's Pizza Inc.
  • Yum! Brands, Inc.
  • McDonald's Corp.
  • Papa John's International, Inc.
  • Subway IP LLC
  • Restaurant Brands International Inc.
  • Inspire Brands, Inc.
  • Focus Brands LLC
  • Little Caesar Enterprises, Inc.
  • Others

*While we strive to always give you current and accurate information, the numbers depicted on the website are indicative and may differ from the actual numbers in the main report. At Expert Market Research, we aim to bring you the latest insights and trends in the market. Using our analyses and forecasts, stakeholders can understand the market dynamics, navigate challenges, and capitalize on opportunities to make data-driven strategic decisions.*

Key Questions Answered in the Report

The market was valued at USD 373.78 Billion in 2025.

The market is projected to grow at a CAGR of 5.66% between 2026 and 2035.

The revenue generated from the fast food market is expected to reach USD 648.22 Billion in 2035.

The fastfood market is categorised according to the product type, which includes pizza/pasta, burgers/sandwiches, Asian/Latin American food and others.

The key players are Wendy’s International, LLC, Domino's Pizza Inc., Yum! Brands, Inc., McDonald's Corp., Papa John's International, Inc., Subway IP LLC, Restaurant Brands International Inc., Inspire Brands, Inc., Focus Brands LLC and Little Caesar Enterprises, Inc. among others.

Based on the end use, the market is divided into full-service restaurants and quick-service restaurants.

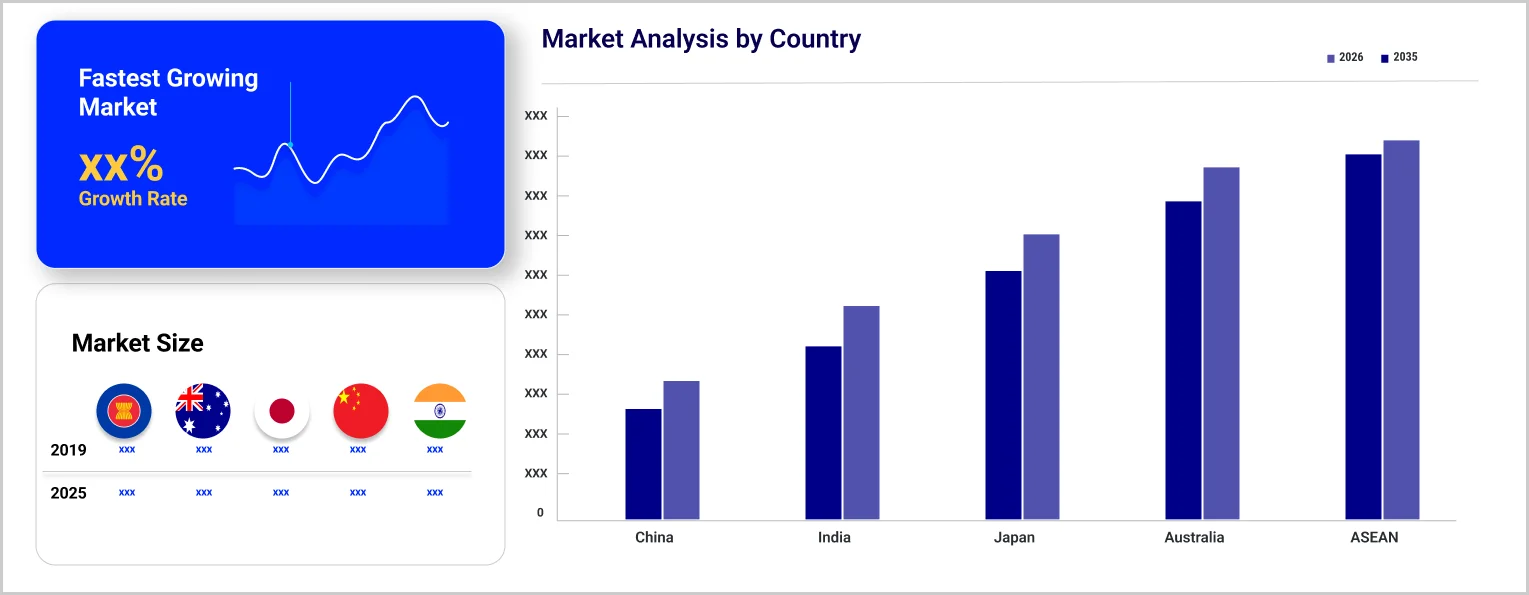
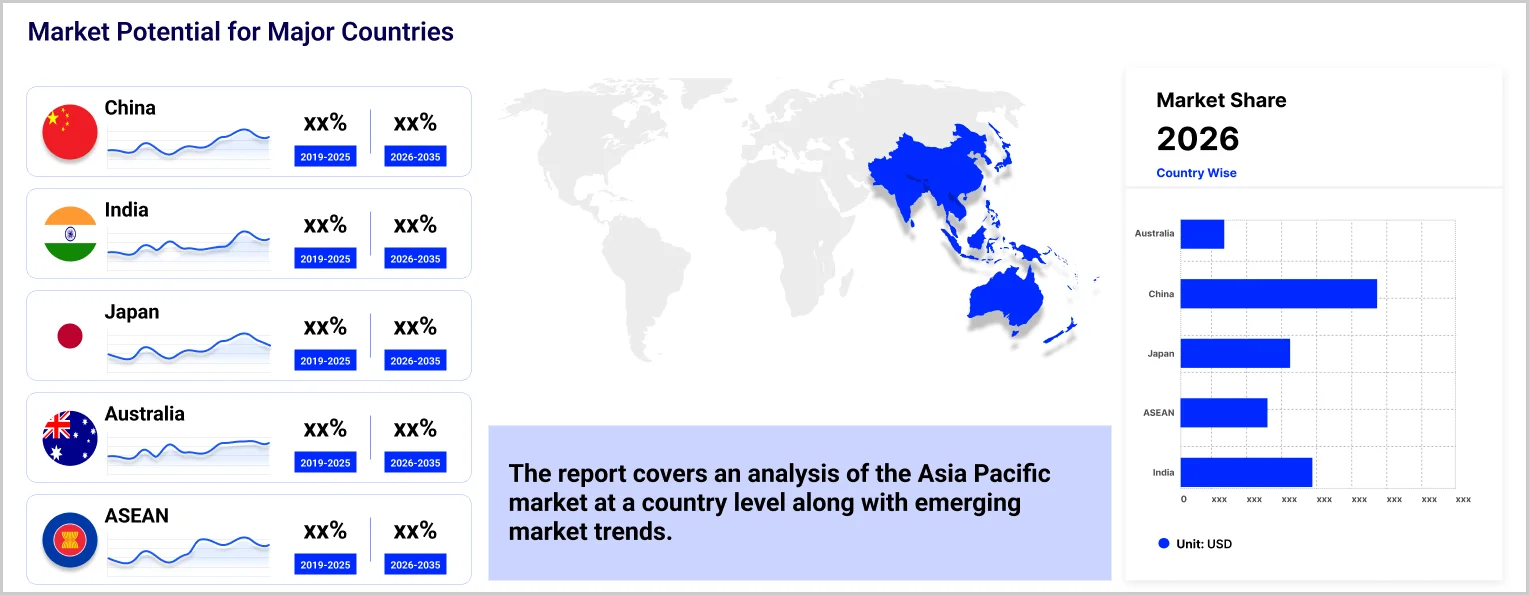
The market is broken down into China, Japan, India, ASEAN, Australia, and others.

Report Summary

Explore our key highlights of the report and gain a concise overview of key findings, trends, and actionable insights that will empower your strategic decisions.

Key Highlights of the Report

Please note that the figures mentioned in the description serve as estimates and may vary from the actual figures presented in the final report.

REPORT FEATURES DETAILS
Base Year 2025
Historical Period 2019-2025
Forecast Period 2026-2035
Scope of the Report

Historical and Forecast Trends, Industry Drivers and Constraints, Historical and Forecast Market Analysis by Segment:

  • Product Type
  • End Use
  • Region
Breakup by Product Type
  • Pizza/Pasta
  • Burgers/Sandwiches
  • Asian/Latin American Food
  • Others
Breakup by End Use
  • Full-Service Restaurants
  • Quick Service Restaurants
Breakup by Region
  • China
  • Japan
  • India
  • ASEAN
  • Australia
  • Others
Market Dynamics
  • SWOT Analysis
  • Porter's Five Forces Analysis
  • Key Indicators for Demand
  • Key Indicators for Price
Competitive Landscape
  • Market Structure
  • Company Profiles
    • Company Overview
    • Product Portfolio
    • Demographic Reach and Achievements
    • Certifications
Companies Covered
  • Wendy’s International, LLC
  • Domino's Pizza Inc.
  • Yum! Brands, Inc.
  • McDonald's Corp.
  • Papa John's International, Inc.
  • Subway IP LLC
  • Restaurant Brands International Inc.
  • Inspire Brands, Inc.
  • Focus Brands LLC
  • Little Caesar Enterprises, Inc.
  • Others

Single User License

10 % Off

USD

3,999

3,599

Datasheet

10 % Off

USD

2,499

2,249

Five User License

15 % Off

USD

4,999

4,249

Corporate License

15 % Off

USD

5,999

5,099

Single User License

One User

USD 3,999

USD 3,599

tax inclusive*

  • All Segments
  • Printing Restrictions
  • PDF Delivered via Email
  • Custom Report Layout
  • Post Sales Analysts Support
  • Periodic Updates
  • Unlimited Prints

Datasheet

One User

USD 2,499

USD 2,249

tax inclusive*

  • Selected Segments
  • Printing Restrictions
  • Excel Spreadsheet Delivered via Email
  • Full Report
  • Periodic Updates
  • Post Sales Analysts Support
  • Unlimited Prints

Five User License

Five User

USD 4,999

USD 4,249

tax inclusive*

  • All Segments
  • Five Prints Available
  • PDF Delivered via Email
  • Limited Free Customization
  • Post Sales Analyst Support
  • Custom Report Layout
  • Periodic Updates
  • Unlimited Prints

Corporate License

Unlimited Users

USD 5,999

USD 5,099

tax inclusive*

  • All Segments
  • Unlimited Prints Available
  • PDF & Excel Delivery via Email
  • Limited Free Customization
  • Post Sales Analysts Support
  • Discount On Next Update
  • Custom Report Layout

*Please note that the prices mentioned below are starting prices for each bundle type. Kindly contact our team for further details.*

Bundle Type

Flash Bundle

20% OFF Number of Reports: 3

Small Business Bundle

25% OFF Number of Reports: 5

Growth Bundle

30% OFF Number of Reports: 8

Enterprise Bundle

35% OFF Number of Reports: 10
Overview
  • Life Time Access
  • Analyst Support Related to Report
  • PDF Version of the Report
  • Complimentary Excel Data Set
  • Free Analyst Hours
  • Complimentary Free 1 Month Subscription to Trade Data Base
  • Complimentary One Month Subscription to Price Database (Chemicals only)
  • Complimentary PPT Version of the Report
  • Complimentary License Upgrade
  • Complimentary Power BI Dashboards
  • Life Time Access
  • Analyst Support Related to Report
  • PDF Version of the Report
  • Complimentary Excel Data Set
  • Free Analyst Hours - 50 Hours
  • Complimentary Free 1 Month Subscription to Trade Data Base
  • Complimentary One Month Subscription to Price Database (Chemicals only)
  • Complimentary PPT Version of the Report
  • Complimentary License Upgrade
  • Complimentary Power BI Dashboards
  • Life Time Access
  • Analyst Support Related to Report
  • PDF Version of the Report
  • Complimentary Excel Data Set
  • Free Analyst Hours - 80 Hours
  • Complimentary Free 1 Month Subscription to Trade Data Base
  • Complimentary One Month Subscription to Price Database (Chemicals only)
  • Complimentary PPT Version of the Report
  • Complimentary License Upgrade
  • Complimentary Power BI Dashboards
  • Life Time Access
  • Analyst Support Related to Report
  • PDF Version of the Report
  • Complimentary Excel Data Set
  • Free Analyst Hours - 100 Hours
  • Complimentary Free 1 Month Subscription to Trade Data Base
  • Complimentary One Month Subscription to Price Database (Chemicals only)
  • Complimentary PPT Version of the Report
  • Complimentary License Upgrade
  • Complimentary Power BI Dashboards

*Please note that the prices mentioned below are starting prices for each bundle type. Kindly contact our team for further details.*

Flash Bundle

Number of Reports: 3

20%

tax inclusive*

  • 3 Reports Included
  • Life Time Acess
  • Analyst Support Related to Report
  • PDF Version of the Report
  • Free 1 Month Subscription to Trade Data Base
  • 1 Month Subscription to Price Database (Chemicals only)
  • Complimentary Excel Data Set
  • PPT Version of the Report
  • Power BI Dashboards
  • License Upgrade
  • Free Analyst Hours

Small Business Bundle

Number of Reports: 5

25%

tax inclusive*

  • 5 Reports Included
  • Life Time Acess
  • Analyst Support Related to Report
  • PDF Version of the Report
  • Complimentary Excel Data Set
  • Free Analyst Hours - 50 Hours
  • Free 1 Month Subscription to Trade Data Base
  • 1 Month Subscription to Price Database (Chemicals only)
  • Complimentary Excel Data Set
  • PPT Version of the Report
  • Power BI Dashboards
  • License Upgrade

Growth Bundle

Number of Reports: 8

30%

tax inclusive*

  • 8 Reports Included
  • Life Time Acess
  • Analyst Support Related to Report
  • PDF Version of the Report
  • Complimentary Excel Data Set
  • Free Analyst Hours - 50 Hours
  • Free 1 Month Subscription to Trade Data Base
  • 1 Month Subscription to Price Database (Chemicals only)
  • License Upgrade
  • Free Analyst Hours - 80 Hours
  • Power BI Dashboards

Enterprise Bundle

Number of Reports: 10

35%

tax inclusive*

  • 10 Reports Included
  • Life Time Acess
  • Analyst Support Related to Report
  • PDF Version of the Report
  • Complimentary Excel Data Set
  • Free Analyst Hours - 50 Hours
  • Free 1 Month Subscription to Trade Data Base
  • 1 Month Subscription to Price Database (Chemicals only)
  • License Upgrade
  • Power BI Dashboards
  • Free Analyst Hours - 100 Hours

How To Order

This is a collaborative report by Neha Gawande, Siddharth David and Vishakha Agrawal reflecting perspectives and research-driven insights from Expert Market Research.

Our step-by-step guide will help you select, purchase, and access your reports swiftly, ensuring you get the information that drives your decisions, right when you need it.

License Type

Select License Type

Choose the right license for your needs and access rights.

shopping cart

Click on ‘Buy Now’

Add the report to your cart with one click and proceed to register.

Bookmark Icon

Select Mode of Payment

Choose a payment option for a secure checkout. You will be redirected accordingly.

Strategic Solutions for Informed Decision-Making

Connect For More Information

Our expert team of analysts will offer full support and resolve any queries regarding the report, before and after the purchase.

Our expert team of analysts will offer full support and resolve any queries regarding the report, before and after the purchase.

We employ meticulous research methods, blending advanced analytics and expert insights to deliver accurate, actionable industry intelligence, staying ahead of competitors.

Our skilled analysts offer unparalleled competitive advantage with detailed insights on current and emerging markets, ensuring your strategic edge.

We offer an in-depth yet simplified presentation of industry insights and analysis to meet your specific requirements effectively.

We’re here to help answer any questions about our products and services.

Contact us