

Consumer Insights
Uncover trends and behaviors shaping consumer choices today
Procurement Insights
Optimize your sourcing strategy with key market data
Industry Stats
Stay ahead with the latest trends and market analysis.
The India Proptech Market was valued at USD 1.72 Billion in 2025. The market is expected to grow at a CAGR of 17.00% during the forecast period of 2026–2035 to reach a value of USD 8.27 Billion by 2035. India's accelerating urban digitisation, expanding real estate sector, and progressive regulatory reforms including the SEBI SM-REIT framework are collectively driving rapid adoption of property technology platforms across residential and commercial real estate segments.
The India proptech market analysis reflects a sector undergoing rapid structural transformation, catalysed by government-led digitisation initiatives and a deepening integration of technology across real estate workflows. The Government of India reports that India processes over 1.6 billion property-related digital service transactions annually, covering online registrations, property mutations, municipal permissions, and tax payments. Under the Smart Cities Mission, more than 8,000 technology-enabled urban projects were completed by 2025, encompassing GIS-based property mapping, digital building approvals, and integrated urban command systems, directly expanding addressable demand for proptech platforms. India's digital infrastructure, with over 970 million internet users and 1.1 billion smartphones, provides a robust foundation for proptech adoption across residential and commercial real estate.
India proptech market dynamics are being shaped by intensifying consolidation activity and technology investment across the private sector. In 2025, Aurum PropTech acquired PropTiger through an all-equity deal, integrating digital brokerage and data analytics platforms to strengthen its proptech ecosystem. NoBroker launched AI-driven tools including CallZen.AI and ConvoZen.AI in 2025, enhancing customer engagement and B2B CRM capabilities while expanding its brokerage-free residential and commercial property transaction model. Private equity interest in the India proptech market has expanded beyond seed-stage investments, with deal counts up approximately 35% year-on-year in 2024 to 2025, reflecting growing institutional confidence in India's digital real estate market value.
Compound Annual Growth Rate
17%
Value in USD Billion
2026-2035
Read more about this report - REQUEST FREE SAMPLE COPY IN PDF
|
India Proptech Market Report Summary |
Description |
Value |
|
Base Year |
USD Billion |
2025 |
|
Historical Period |
USD Billion |
2019-2025 |
|
Forecast Period |
USD Billion |
2026-2035 |
|
Market Size 2025 |
USD Billion |
1.72 |
|
Market Size 2035 |
USD Billion |
8.27 |
|
CAGR 2019-2025 |
Percentage |
XX% |
|
CAGR 2026-2035 |
Percentage |
17.00% |
|
CAGR 2026-2035 - Market by Region |
Tier-2/3 Cities |
21.3% |
|
CAGR 2026-2035 - Market by Solution Type |
AI/ML Platforms |
18.6% |
|
CAGR 2026-2035 - Market by End-User |
Commercial Enterprises |
19.2% |
|
2025 Market Share by Region |
South India |
31.5% |
The India proptech market is expanding rapidly, driven by 806 million internet users, SEBI's formalisation of SM-REITs and fractional investment platforms, and consolidation such as Aurum PropTech's acquisition of PropTiger. Sustained venture capital inflows and co-working IPO activity signal a shift toward full-stack transaction platforms.
Aurum PropTech completed the acquisition of PropTiger through an all-equity transaction valued at approximately USD 10.4 million in 2025, integrating PropTiger's digital brokerage, data analytics, and developer marketing capabilities into its expanding proptech ecosystem. The deal reflects accelerating consolidation in the India proptech market analysis trend, where established platforms are acquiring complementary digital real estate services to achieve scale, broaden geographic reach, and deepen developer marketing and transaction management capabilities.
The Government of India reported that India processes over 1.6 billion property-related digital service transactions annually, covering online property registrations, mutations, municipal approvals, and tax payments. This transaction volume represents a substantial data asset and platform engagement opportunity for India proptech market companies, enabling AI-powered analytics, predictive valuation tools, and automated compliance solutions built on verified, government-sourced real estate data across Indian states and urban local bodies.
NoBroker Technologies Solutions launched AI-driven tools including CallZen.AI and ConvoZen.AI in 2025, significantly enhancing its B2B customer relationship management capabilities and automating customer interaction workflows across residential and commercial real estate verticals. These tools reduce transaction friction and scale operations without expanding broker commission models, reinforcing NoBroker's brokerage-free proposition and reflecting the India proptech market trend toward AI-enabled operational efficiency.
India's Securities and Exchange Board's SM-REIT framework, advancing implementation in 2025, is expected to unlock over USD 2 billion in new proptech capital and legitimise fractional ownership as an investable asset class for retail investors. The framework accelerates institutional and retail investor participation in digital real estate platforms, directly expanding the addressable India proptech market scope across both residential and commercial property segments with a compliant, regulated investment structure.
India's Smart Cities Mission completed over 8,000 technology-enabled urban projects by 2025, encompassing GIS-based property mapping, digital building approvals, and integrated command and control systems. These government-initiated urban infrastructure projects have directly expanded the addressable market for India proptech market players by increasing data availability, digitising local government property records, and creating interoperable property data ecosystems that proptech firms can leverage for analytics, compliance, and real estate intelligence products.
India's proptech sector secured over USD 550 million in funding across 32 deals in 2025, representing a strong resurgence in investor confidence. Infra.Market, NoBroker, Square Yards, and PropShare led capital deployment, with full-stack and transaction-led proptech models attracting the largest allocations. This structural shift reflects the India proptech market growth trajectory toward integrated property transaction ecosystems with deeper monetisation strategies over classifieds-only platform models.
India's co-working proptech segment witnessed a significant public listing wave in 2025, with WeWork India, IndiQube, and Smartworks completing IPOs following Awfis in 2024. These listings validate the commercial maturity of managed workspace platforms and reflect institutional investor confidence in recurring-revenue managed real estate models. The co-working segment collectively raised approximately USD 300 million, reinforcing its role as a high-growth sub-category of the India proptech market.
India reached 806 million internet users in 2025, with over 75% accessing real estate platforms via smartphones. NoBroker and Housing.com have each scaled to over 40 million registered users, driven by mobile-first user experience design and vernacular language content features. Rising smartphone penetration in Tier-2 and Tier-3 cities is materially expanding the addressable India proptech market beyond major metropolitan centres, reducing information asymmetry in property transactions.
India's Real Estate Regulatory Authority framework has created a significant digital compliance infrastructure that India proptech market companies leverage for verified listing data. Uttar Pradesh RERA registered thousands of residential projects across Noida and Greater Noida, while Haryana RERA data concentrated in Gurugram supports premium property analytics tools. State-level RERA databases enable proptech firms to build verified inventory tools, automated compliance products, and AI-powered market intelligence dashboards.
The Expert Market Research's report titled "India Proptech Market Report and Forecast 2026-2035" offers a detailed analysis of the market based on the following segments:
Market Breakup by Solution Type
Key Insight: Real Estate Search & Listing Platforms and digital brokerage dominate the India proptech market by solution type revenue, reflecting the high monetisation potential of property transaction facilitation versus classifieds-only listing models. Platforms that facilitate the complete transaction lifecycle from search through financing to documentation generate significantly higher revenue per transaction than traditional lead-generation portals. Property management software is the largest sub-segment by number of deployed instances, driven by the scale of India's residential cooperative housing society management market requiring digital billing, maintenance, and community service tools.
Market Breakup by End-User
Key Insight: Individual buyers and renters constitute the dominant end-user segment in the India proptech market, with residential property search platforms serving India's large urban population of first-time homebuyers, renters, and NRI investors. Real estate developers are the highest-revenue enterprise end-user segment, driving platform adoption of AI-enabled pre-sales, digital construction management, and smart community management solutions as major Indian developers invest in technology-differentiated project delivery and buyer engagement capabilities.
Market Breakup by Technology
Key Insight: AI and Machine Learning is the fastest-growing technology segment in the India proptech market, with a projected CAGR exceeding 18% through the forecast period, driven by widespread adoption of AI-powered property recommendation engines, automated valuation models, conversational AI for lead qualification, and predictive analytics for demand forecasting. NoBroker's CallZen.AI and ConvoZen.AI tool launches in 2025 exemplify the trend toward AI-enabled operational automation that is reshaping platform economics by reducing agent headcount requirements while scaling transaction volumes.
Market Breakup by Region
Key Insight: South India, anchored by Bengaluru's technology sector concentration, leads the India proptech market in platform innovation and tech-enabled transaction adoption, with the region hosting the headquarters of NoBroker, Square Yards India operations, and major co-working platforms. North India (Delhi NCR) represents the largest market by transaction volume, driven by Noida and Gurugram's massive residential and commercial real estate activity. West India (Mumbai) represents the highest property value concentration and the largest single-market revenue opportunity for premium proptech platforms and fractional investment solutions.
Read more about this report - REQUEST FREE SAMPLE COPY IN PDF
By Solution Type, Real Estate Search & Listing Platforms dominate the market due to high revenue per transaction and full-stack lifecycle monetisation capability
Real Estate Search & Listing Platforms and digital brokerage solutions account for the largest revenue share within the India proptech market, reflecting the high commercial value of facilitating complete property transaction lifecycles including search, verification, documentation, and financing. Platforms that operate a brokerage-free or reduced-commission transaction model at scale generate significantly higher revenue per engaged user than classifieds-only listing portals, driving strong investor preference for full-stack transaction platform business models.
Property management software contributes the largest share by number of deployed instances across residential housing societies, commercial building managers, and developer-operated projects. Co-working and managed workspace platforms, despite a smaller overall revenue share, are attracting disproportionate investor attention following the 2024-2025 IPO wave by WeWork India, IndiQube, and Smartworks, which has validated the managed workspace platform model and opened public market capital for further sector expansion.
By End-User, Individual Buyers and Renters lead due to India's large urban population driving high-volume residential property platform engagement
Individual buyers and renters constitute the dominant end-user segment within the India proptech market scope, reflecting India's large and urbanising population that generates consistent demand for residential property search, rental matching, home loan facilitation, and property documentation services. India's urban population of over 500 million, growing at approximately 2.3% annually, creates a structurally expanding consumer base for residential property technology platforms across search, discovery, and transaction verticals.
Real estate developers are the highest-revenue enterprise end-user segment within the India proptech market analysis, driving platform adoption of developer marketing technology, sales management software, and smart community management solutions as major Indian developers invest in technology-differentiated project delivery. Commercial real estate enterprises represent a growing proptech end-user category, adopting lease management, space analytics, and smart building IoT solutions to optimise commercial property portfolio performance and tenant experience.
By Technology, Artificial Intelligence and Machine Learning leads due to rapid integration into property recommendation, valuation, and transaction automation workflows
AI and machine learning is the dominant technology investment area within the India proptech market, applied across property recommendation engines, automated valuation models, document verification systems, and conversational AI tools for lead qualification and customer engagement. The adoption of AI is driven by the need to scale transaction volumes and improve matching accuracy without proportionally expanding human agent teams, making AI-driven automation a critical operational differentiator for India proptech market growth strategies.
Big data analytics and predictive valuation tools represent a rapidly growing technology segment, with proptech platforms leveraging RERA project databases, government property registration records, and platform transaction histories to build data-driven price discovery and market intelligence products. Blockchain is gaining exploratory adoption for property title verification and smart contract-based rental agreements, with regulatory interest from state governments exploring blockchain-based property registration pilots as part of India's broader digital governance modernisation agenda.
Read more about this report - REQUEST FREE SAMPLE COPY IN PDF
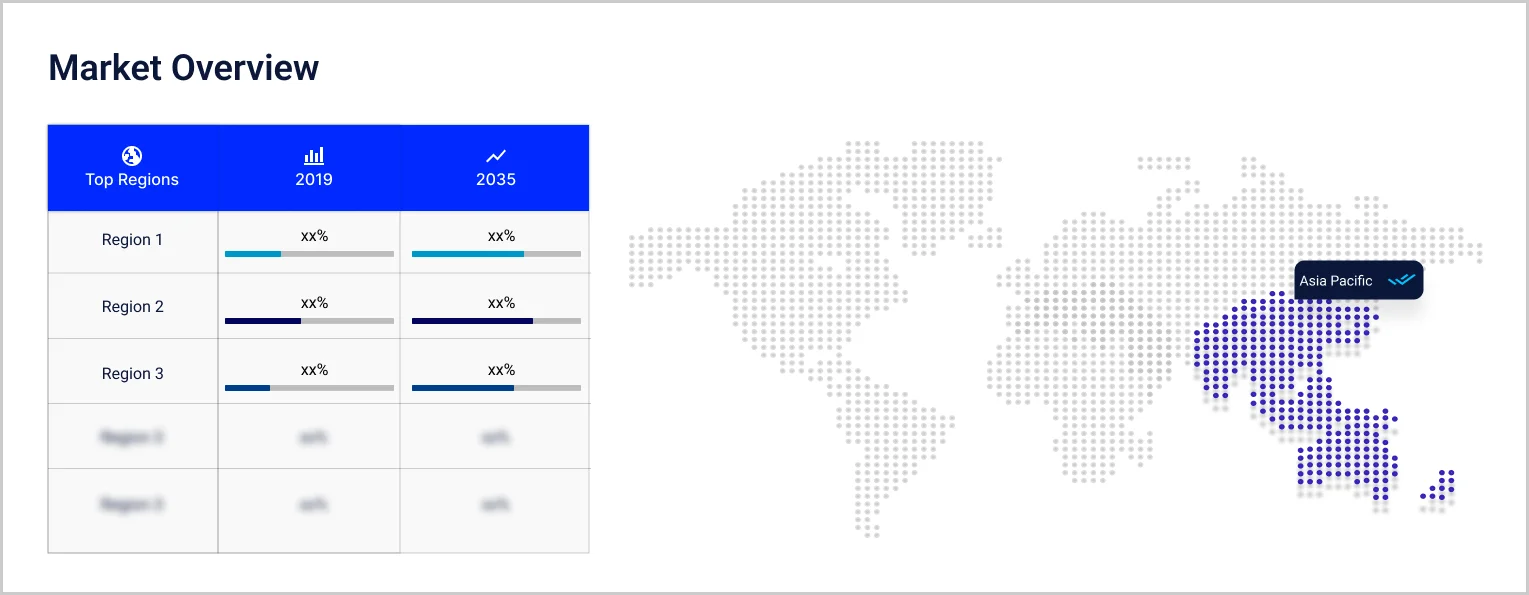
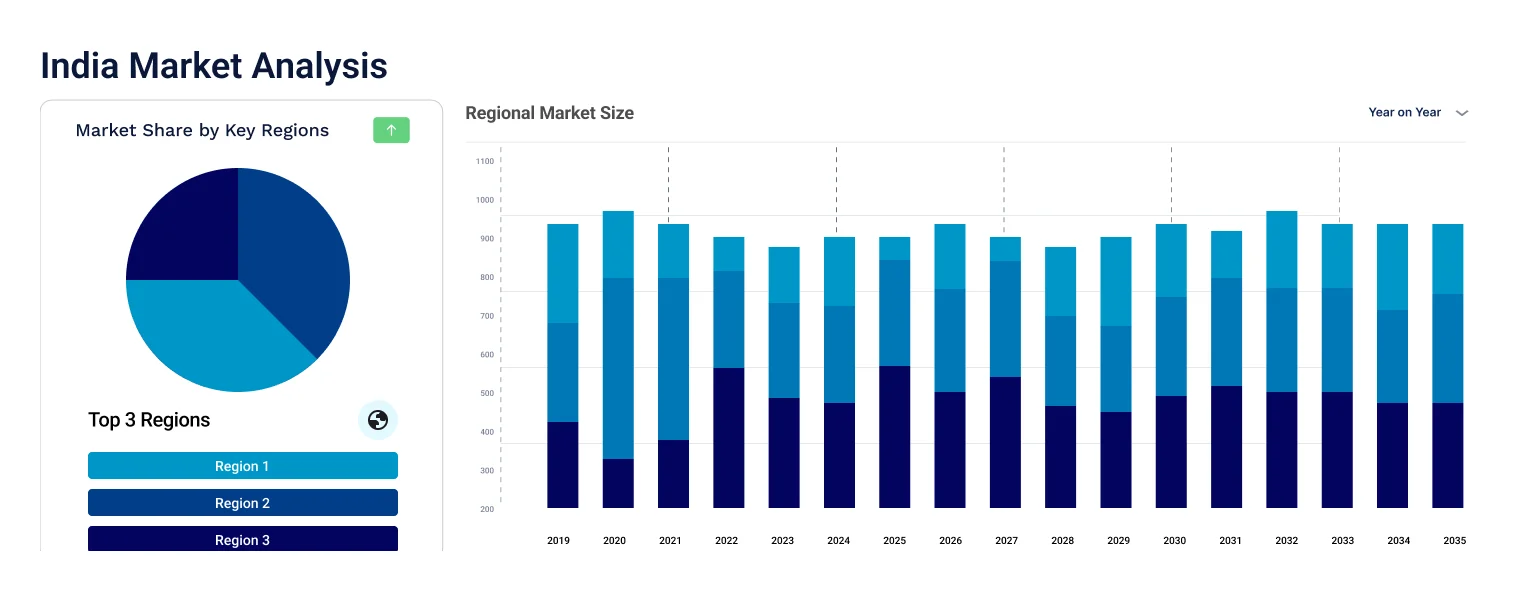
South India leads the market in proptech innovation due to Bengaluru's technology sector ecosystem, while North India's Delhi NCR represents the largest transaction volume concentration
South India leads the India proptech market in platform innovation and investment, anchored by Bengaluru's deep technology talent pool, startup ecosystem, and the presence of NoBroker's headquarters and major co-working platform operations. Bengaluru, Hyderabad, and Chennai collectively host some of India's highest residential transaction velocities among technology professionals, creating ideal test markets for AI-powered real estate product development and rapid user adoption.
North India, centred on Delhi NCR's Noida and Gurugram corridors, represents the largest India proptech market by residential transaction volume, driven by large-scale affordable housing projects, significant NRI investment activity, and the concentration of major property developer operations. West India, anchored by Mumbai's premium residential and commercial real estate market, offers the highest per-transaction revenue opportunity for proptech platforms facilitating premium property sales and fractional investment products. Tier-2 cities including Jaipur, Lucknow, and Coimbatore are emerging as growth frontiers as smartphone penetration extends proptech addressable markets.
|
CAGR 2026-2035 - Market by |
Region |
|
North India |
15.2% |
|
South India |
18.4% |
|
West India |
16.1% |
|
East India |
13.8% |
|
Others (Tier-2/3 Cities) |
21.3% |
The India proptech market players landscape is fragmented across multiple sub-verticals including residential transaction platforms, commercial real estate technology, property management software, and fractional investment platforms. The market is dominated at the national scale by a handful of well-funded platforms including NoBroker, Housing.com (REA Group subsidiary), 99acres (Info Edge India), and MagicBricks (Times Internet), each serving tens of millions of registered users.
India proptech market companies are differentiating through three primary strategies: AI and machine learning integration that enables more accurate property matching, valuation, and transaction automation; full-stack brokerage-free models that monetise the complete transaction lifecycle rather than only the listing or lead-generation stage; and geographic expansion into Tier-2 and Tier-3 cities where rising smartphone penetration is unlocking underserved property market demand. Consolidation through acquisition is accelerating as platform scale becomes a critical competitive advantage.
Founded in 2014 and headquartered in Bengaluru, Karnataka, India, NoBroker is India's leading brokerage-free real estate platform and the country's first proptech unicorn, connecting buyers, sellers, and renters without charging traditional brokerage commissions. The platform serves over 75 million registered users across Bengaluru, Mumbai, Pune, Delhi NCR, and Hyderabad. Key strength: NoBroker's brokerage-free model combined with its AI-powered CallZen.AI and ConvoZen.AI tools and adjacent services including movers, home services, and rental agreements creates a vertically integrated real estate services ecosystem that generates recurring revenue beyond the initial transaction.
PropTiger, now part of Aurum PropTech following the 2025 all-equity acquisition, is a developer-facing digital real estate platform providing new home sales, marketing, and analytics services to major Indian real estate developers. Backed by REA Group (Australia), PropTiger serves over 3,000 developer clients across more than 50 Indian cities. Key strength: PropTiger's deep developer relationship network and REA Group's global proptech operating experience provide a differentiated market position in India's new residential project sales segment, which is structurally growing as urbanisation and housing demand accelerate.
Founded in 2005 and headquartered in Gurugram, Haryana, 99acres is India's largest property listing portal by monthly active users and a flagship product of Info Edge India, which also operates Naukri.com and Jeevansathi.com. The platform covers residential, commercial, and rental property listings across all major Indian cities. Key strength: 99acres' market-leading traffic position, backed by Info Edge's significant marketing investment and cross-platform digital ecosystem, enables it to offer developers and property owners the widest consumer reach of any Indian real estate portal, making it the dominant choice for high-exposure property listings.
Founded in 2006 and headquartered in Noida, Uttar Pradesh, MagicBricks is one of India's largest online real estate property portals, operating as a subsidiary of Times Internet, the digital business of The Times of India Group. The platform lists over 1.3 million properties across 900 Indian cities. Key strength: MagicBricks' deep integration with India's largest media group provides unmatched brand reach and digital advertising capabilities for property marketing, supporting its position as a preferred developer portal for premium project launches in India's residential real estate segment.
Other key players in the India Proptech Market report include NestAway Technologies Pvt. Ltd., Stanza Living (Dtwelve Spaces Pvt. Ltd.), Anarock Property Consultants Pvt. Ltd., Square Yards Consulting Pvt. Ltd., Housing.com (PropTiger.com), CommonFloor, PropShare, and Livspace, among others.
*Please note that this is only a partial list; the complete list of key players is available in the full report. Additionally, the list of key players can be customized to better suit your needs.*
Explore the latest trends shaping the India Proptech Market 2026–2035 with our in-depth report. Gain strategic insights, future forecasts, and key market developments that can help you stay competitive. Download a free sample report or contact our team for customised consultation on India Proptech Market trends 2026.


Upto 15% Off
USD
$2499 $2249
$3999 $3599
$4999 $4249
$5999 $5099


*While we strive to always give you current and accurate information, the numbers depicted on the website are indicative and may differ from the actual numbers in the main report. At Expert Market Research, we aim to bring you the latest insights and trends in the market. Using our analyses and forecasts, stakeholders can understand the market dynamics, navigate challenges, and capitalize on opportunities to make data-driven strategic decisions.*
In 2025, the India Proptech Market reached an approximate value of USD 1.72 Billion.
The market is projected to grow at a CAGR of 17.00% between 2026 and 2035.
The key players in the market include NoBroker Technologies Solutions Pvt. Ltd., PropTiger.com (REA India), Housing.com (PropTiger.com), 99acres (Info Edge India Ltd.), MagicBricks (Times Internet Ltd.), Square Yards Consulting Pvt. Ltd., NestAway Technologies Pvt. Ltd., Stanza Living (Dtwelve Spaces Pvt. Ltd.), Anarock Property Consultants Pvt. Ltd., CommonFloor, PropShare, and Livspace.
Key strategies include AI and ML platform integration, fractional ownership via SEBI SM-REIT compliance, brokerage-free model expansion, and strategic acquisitions consolidating digital real estate platforms.
Primary challenges include digital literacy gaps in Tier-3 cities, fragmented real estate data quality, regulatory compliance complexity, high customer acquisition costs, and trust deficits in online property transactions.
Explore our key highlights of the report and gain a concise overview of key findings, trends, and actionable insights that will empower your strategic decisions.
|
Report Features |
Details |
|
Base Year |
2025 |
|
Historical Period |
2019-2025 |
|
Forecast Period |
2026-2035 |
|
Scope of the Report |
Historical and Forecast Trends, Industry Drivers and Constraints, Historical and Forecast Market Analysis by Segment:
|
|
Breakup by Solution Type |
|
|
Breakup by End-User |
|
|
Breakup by Technology |
|
|
Breakup by Region |
|
|
Market Dynamics |
|
|
Competitive Landscape |
|
|
Companies Covered |
|
Datasheet
One User
USD 2,499
USD 2,249
tax inclusive*
Single User License
One User
USD 3,999
USD 3,599
tax inclusive*
Five User License
Five User
USD 4,999
USD 4,249
tax inclusive*
Corporate License
Unlimited Users
USD 5,999
USD 5,099
tax inclusive*
*Please note that the prices mentioned below are starting prices for each bundle type. Kindly contact our team for further details.*
Flash Bundle
Small Business Bundle
Growth Bundle
Enterprise Bundle
*Please note that the prices mentioned below are starting prices for each bundle type. Kindly contact our team for further details.*
Flash Bundle
Number of Reports: 3
20%
tax inclusive*
Small Business Bundle
Number of Reports: 5
25%
tax inclusive*
Growth Bundle
Number of Reports: 8
30%
tax inclusive*
Enterprise Bundle
Number of Reports: 10
35%
tax inclusive*
How To Order

Select License Type
Choose the right license for your needs and access rights.

Click on ‘Buy Now’
Add the report to your cart with one click and proceed to register.

Select Mode of Payment
Choose a payment option for a secure checkout. You will be redirected accordingly.
Strategic Solutions for Informed Decision-Making
Gain insights to stay ahead and seize opportunities.

Get insights & trends for a competitive edge.

Track prices with detailed trend reports.

Analyse trade data for supply chain insights.

Leverage cost reports for smart savings

Enhance supply chain with partnerships.

Connect For More Information
Our expert team of analysts will offer full support and resolve any queries regarding the report, before and after the purchase.
Our expert team of analysts will offer full support and resolve any queries regarding the report, before and after the purchase.
We employ meticulous research methods, blending advanced analytics and expert insights to deliver accurate, actionable industry intelligence, staying ahead of competitors.
Our skilled analysts offer unparalleled competitive advantage with detailed insights on current and emerging markets, ensuring your strategic edge.
We offer an in-depth yet simplified presentation of industry insights and analysis to meet your specific requirements effectively.




