

Consumer Insights
Uncover trends and behaviors shaping consumer choices today
Procurement Insights
Optimize your sourcing strategy with key market data
Industry Stats
Stay ahead with the latest trends and market analysis.
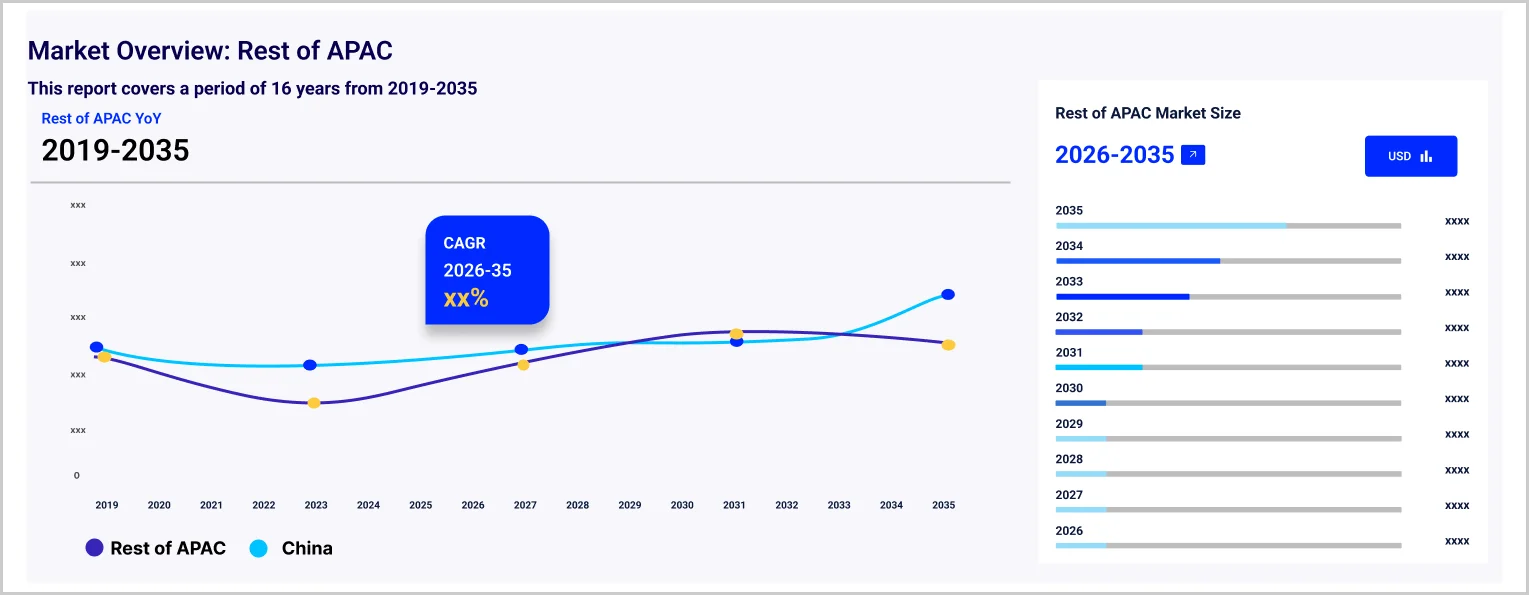
The Asia Pacific kiosk market size reached around USD 7.24 Billion in 2025. The market is projected to grow at a CAGR of 9.80% between 2026 and 2035 to reach nearly USD 18.44 Billion by 2035.
The total number of ATMs in India, including micro-ATMs, stands at 1.8 million, leading to the Asia Pacific kiosk market development.
As per industry reports, the Asia Pacific is experiencing rapid growth in the travel and tourism sector, accounting for 80% of the cities that are expanding the fastest in this sector. This region derives a substantial 33% of the direct GDP from travel and tourism.
The digital payments sector in Asia Pacific is projected to experience an annual growth rate of 19.8% by the year 2027, marking it as the fastest-growing market globally.
Compound Annual Growth Rate
9.8%
Value in USD Billion
2026-2035
As of March 2022, India had a total of 252,000 ATMs, both offline and online. The country boasts over 160,000 bank branches, which equates to approximately 15 branches for every 100,000 individuals. This extensive network is further supported by 217,000 ATMs, with 47% located in rural and semi-urban regions, thus augmenting growth in the kiosk market in Asia Pacific. As financial institutions broaden their service offerings and branch presence, they are increasingly implementing kiosks to enhance customer engagement. These self-service kiosks improve operational efficiency by providing services such as account management, bill payments, and document processing, thereby minimising wait times and reducing operational expenses.
As per the Asia Pacific kiosk market analysis, before the COVID-19 pandemic, the Asia Pacific region held the title of the largest travel market globally, however, it fell to the second position in 2021 following the pandemic's impact. By 2025, the market is anticipated to reach approximately USD 490 billion, reflecting a 10% increase compared to its 2019 figures. The growth of the tourism sector is also fuelling an increasing demand for kiosks in popular tourist destinations. As the number of visitors rises, these kiosks offer effective solutions for ticketing, information dissemination, and reservations at airports, train stations, and attractions. These self-service units significantly enhance the visitor experience by providing real-time updates, multilingual assistance, and convenient access to services, thereby aiding in the management of high foot traffic and optimising operations in busy tourist locales.
Rapid urbanisation in the region, the growth of the retail sector, the rising adoption of advanced technologies, and the increasing adoption of cashless payments are the major trends impacting the Asia Pacific kiosk market expansion.
In a significant achievement for the esteemed brand, ACK officially inaugurated its inaugural retail kiosk at Ambience Mall in India, signifying the company's foray into direct-to-consumer (D2C) retail. This initiative is part of a novel format known as Broadway, which facilitates D2C brands in creating a more immersive offline presence, thereby enabling consumers to engage with the brand in a vibrant and interactive retail setting.
Avis Budget Group unveiled its Self-Service Kiosks at ITB China 2024. These kiosks are designed to improve the vehicle collection experience for customers and are strategically located in key travel hubs. These imcludes airports, enabling travellers to obtain rental vehicle keys efficiently and securely from an automated system, thereby leading to the Asia Pacific kiosk market growth.
KFC introduced its inaugural To-Go coffee kiosk in Shanghai, China. This fast-food brand has established a specialised coffee shop format to meet the increasing demand for value and efficiency among the affluent younger coffee consumers in China.
One of the key Asia Pacific kiosk market trends is the expansion of the urban sector. The rapid urban development in cities throughout the Asia Pacific is driving an increased demand for kiosks in high-traffic locations such as shopping centres, transportation terminals, and public areas, thereby offering effective self-service options.
The growth of the retail sector, along with the emergence of shopping malls and convenience stores, is driving the demand for interactive kiosks to enhance customer engagement and optimise operational efficiency.
A key Asia Pacific kiosk market development is the advancements in kiosk technology, such as touchscreens, biometric systems, and the integration of the Internet of things (IoT), are improving the functionality of kiosks and promoting their widespread adoption across multiple sectors.
The shift towards cashless payment methods is significantly driving the growth and implementation of kiosks equipped with advanced payment systems. This transition is not only modernising the way transactions are conducted but also enhancing the overall customer experience.
With the increasing adoption of cashless transactions, kiosks facilitate a range of payment options, such as mobile wallets and contactless cards, thereby improving convenience and security for users in retail, transportation, and public services, leading to the Asia Pacific kiosk market expansion.
There is a notable shift towards the implementation of interactive and intelligent kiosks throughout the region. These kiosks are equipped with cutting-edge technologies, including touchscreens, AI-enhanced customer support, and real-time data analytics, which provide tailored experiences and effective information sharing across sectors such as retail, hospitality, and transportation.
The EMR’s report titled “Asia Pacific Kiosk Market Report and Forecast 2026-2035” offers a detailed analysis of the market based on the following segments:
Market Breakup by Type
Market Breakup by End-User Industry
Market Breakup by Country
Based on end use, the market is segmented into BFSI, healthcare, retail, hospitality, and transportation, among others. The BFSI segment is projected to grow at a CAGR of 11.1% during the forecast period. Kiosks within the BFSI sector offer self-service solutions for clients, facilitating rapid transactions including withdrawals, cash deposits, bill payments, and account inquiries. These kiosks contribute to increased efficiency, minimised wait times, and enhanced convenience and accessibility for customers.
Major players are focusing on technological advancements to gain a to improve Asia Pacific kiosk market outlook.
NCR Corp., founded in 1884, is headquartered in Atlanta, Georgia. The organisation specialises in self-service kiosks, automated teller machines (ATMs), and point-of-sale (POS) systems, serving sectors including retail, financial services, and hospitality by leveraging cutting-edge technological innovations.
Thales S.A., founded in 1893, is a multinational corporation based in Paris, France. The organisation engages in multiple sectors, including aerospace, defence, security, and transportation. It offers advanced solutions such as biometric systems, payment terminals, and self-service kiosks, all designed to enhance safety and operational efficiency.
Fujitsu Ltd., founded in 1935 and headquartered in Tokyo, Japan, is a leading global provider of information technology services. The company offers a diverse range of technological solutions, including self-service kiosks, serving various sectors such as retail and finance, consequently driving up the Asia Pacific kiosk market share.
Hitachi Ltd. founded in 1910, is a leading Japanese multinational corporation headquartered in Tokyo. The organisation specialises in electronics, information technology services, and industrial systems, providing solutions across various sectors, including infrastructure and advanced technology.
*Please note that this is only a partial list; the complete list of key players is available in the full report. Additionally, the list of key players can be customized to better suit your needs.*
Other major players in the market are Diebold Nixdorf Inc, Posiflex Technology Inc, Oki Electric Industry Co., Ltd, Glory Ltd., Hyosung Corp., and Advantech Co., Ltd., among others.
Upto 15% Off
USD
$2499 $2249
$3999 $3599
$4999 $4249
$5999 $5099


*While we strive to always give you current and accurate information, the numbers depicted on the website are indicative and may differ from the actual numbers in the main report. At Expert Market Research, we aim to bring you the latest insights and trends in the market. Using our analyses and forecasts, stakeholders can understand the market dynamics, navigate challenges, and capitalize on opportunities to make data-driven strategic decisions.*
In 2025, the market attained a value of nearly USD 7.24 Billion.
The market is assessed to grow at a CAGR of 9.80% between 2026 and 2035.
The market is estimated to witness a healthy growth in the forecast period of 2026-2035 to reach about USD 18.44 Billion by 2035.
The market is being driven by the rapid urbanisation in the region and expansion of the retail sector.
The key trends aiding the market expansion include the incorporation of advanced technologies in kiosks and the rising adoption of cashless transactions.
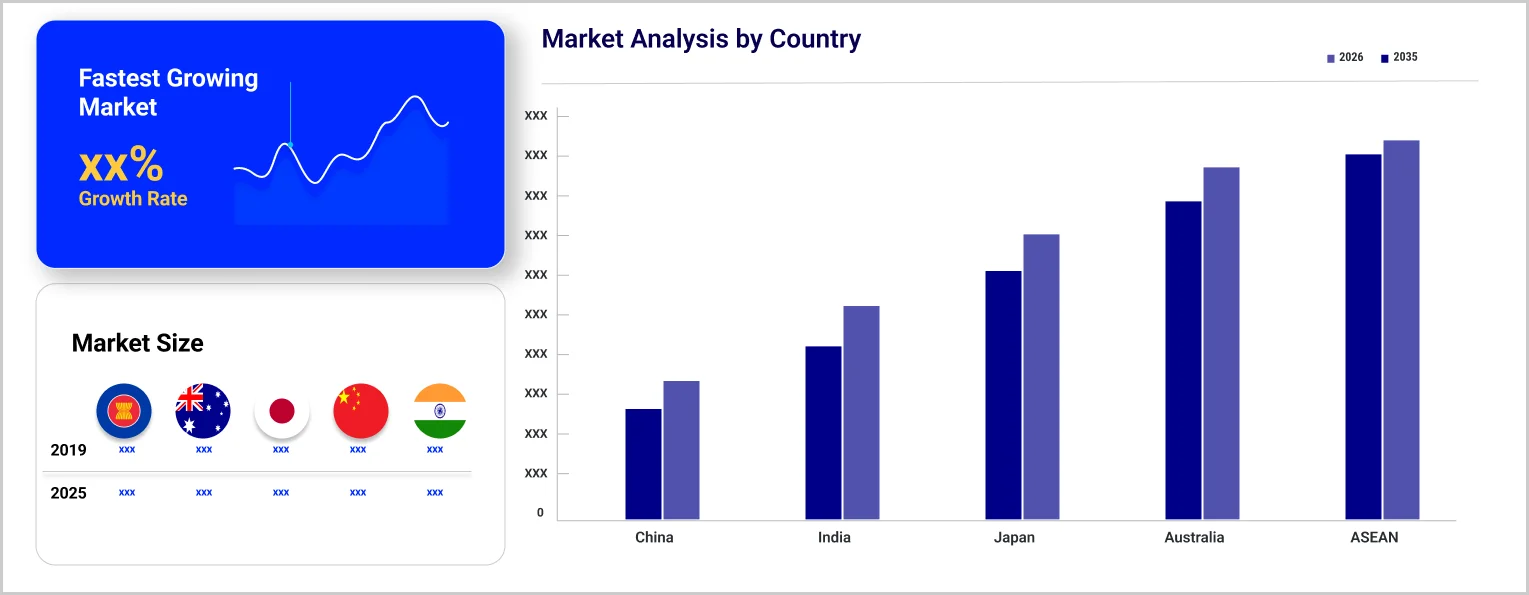
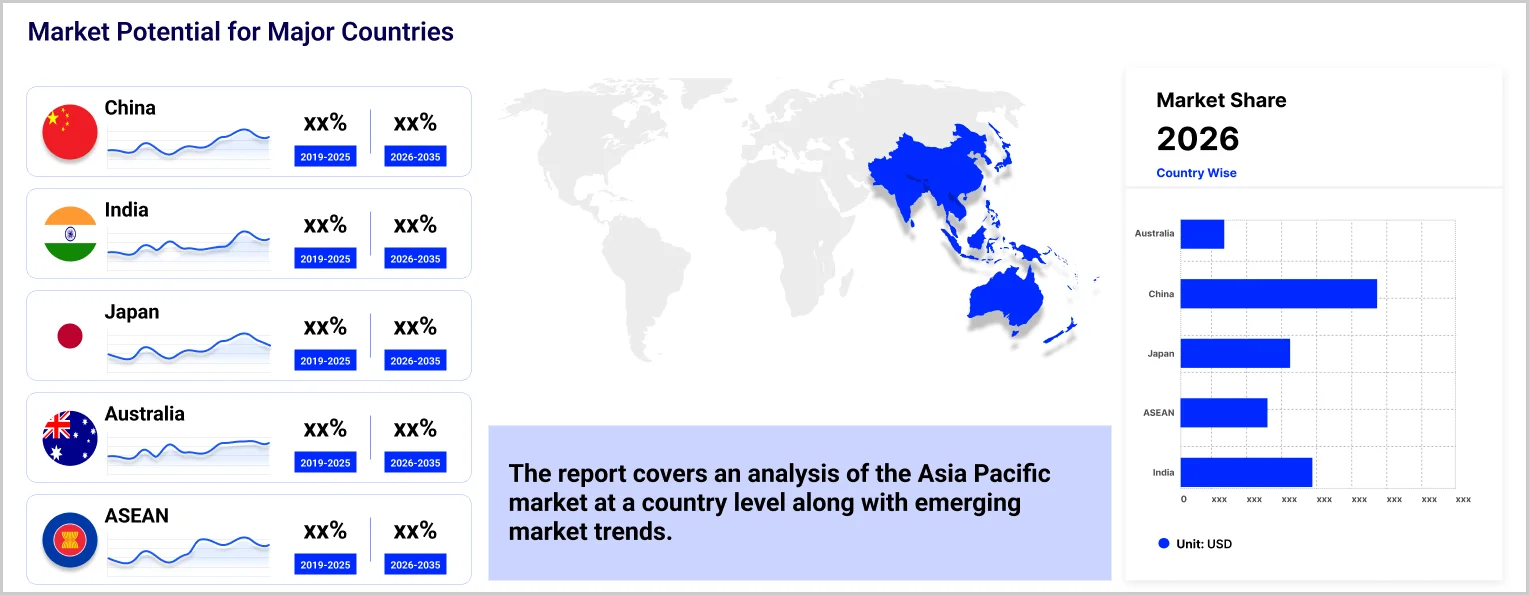
The major countries considered in the market are China, Japan, India, ASEAN, and Australia, among others.
The major players in the market are NCR Corporation, Diebold Nixdorf Incorporated, Thales S.A., Posiflex Technology Incorporated, Fujitsu Ltd., Oki Electric Industry Co., Ltd, Glory Ltd., Hitachi Ltd., Hyosung Corp., and Advantech Co., Ltd., among others.
Explore our key highlights of the report and gain a concise overview of key findings, trends, and actionable insights that will empower your strategic decisions.
| REPORT FEATURES | DETAILS |
| Base Year | 2025 |
| Historical Period | 2019-2025 |
| Forecast Period | 2026-2035 |
| Scope of the Report |
Historical and Forecast Trends, Industry Drivers and Constraints, Historical and Forecast Market Analysis by Segment:
|
| Breakup by Type |
|
| Breakup by End-User Industry |
|
| Breakup by Region |
|
| Market Dynamics |
|
| Competitive Landscape |
|
| Companies Covered |
|
Datasheet
One User
USD 2,499
USD 2,249
tax inclusive*
Single User License
One User
USD 3,999
USD 3,599
tax inclusive*
Five User License
Five User
USD 4,999
USD 4,249
tax inclusive*
Corporate License
Unlimited Users
USD 5,999
USD 5,099
tax inclusive*
*Please note that the prices mentioned below are starting prices for each bundle type. Kindly contact our team for further details.*
Flash Bundle
Small Business Bundle
Growth Bundle
Enterprise Bundle
*Please note that the prices mentioned below are starting prices for each bundle type. Kindly contact our team for further details.*
Flash Bundle
Number of Reports: 3
20%
tax inclusive*
Small Business Bundle
Number of Reports: 5
25%
tax inclusive*
Growth Bundle
Number of Reports: 8
30%
tax inclusive*
Enterprise Bundle
Number of Reports: 10
35%
tax inclusive*
How To Order

Select License Type
Choose the right license for your needs and access rights.

Click on ‘Buy Now’
Add the report to your cart with one click and proceed to register.

Select Mode of Payment
Choose a payment option for a secure checkout. You will be redirected accordingly.
Strategic Solutions for Informed Decision-Making
Gain insights to stay ahead and seize opportunities.

Get insights & trends for a competitive edge.

Track prices with detailed trend reports.

Analyse trade data for supply chain insights.

Leverage cost reports for smart savings

Enhance supply chain with partnerships.

Connect For More Information
Our expert team of analysts will offer full support and resolve any queries regarding the report, before and after the purchase.
Our expert team of analysts will offer full support and resolve any queries regarding the report, before and after the purchase.
We employ meticulous research methods, blending advanced analytics and expert insights to deliver accurate, actionable industry intelligence, staying ahead of competitors.
Our skilled analysts offer unparalleled competitive advantage with detailed insights on current and emerging markets, ensuring your strategic edge.
We offer an in-depth yet simplified presentation of industry insights and analysis to meet your specific requirements effectively.


