

Consumer Insights
Uncover trends and behaviors shaping consumer choices today
Procurement Insights
Optimize your sourcing strategy with key market data
Industry Stats
Stay ahead with the latest trends and market analysis.
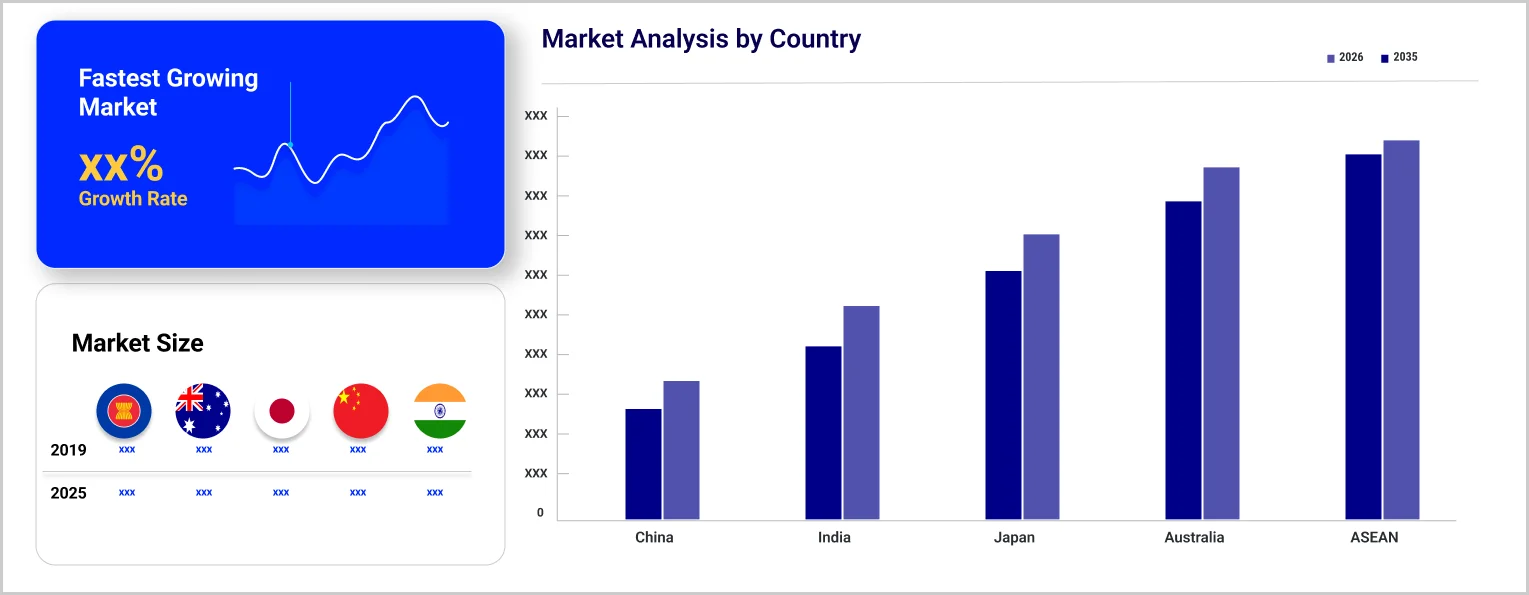
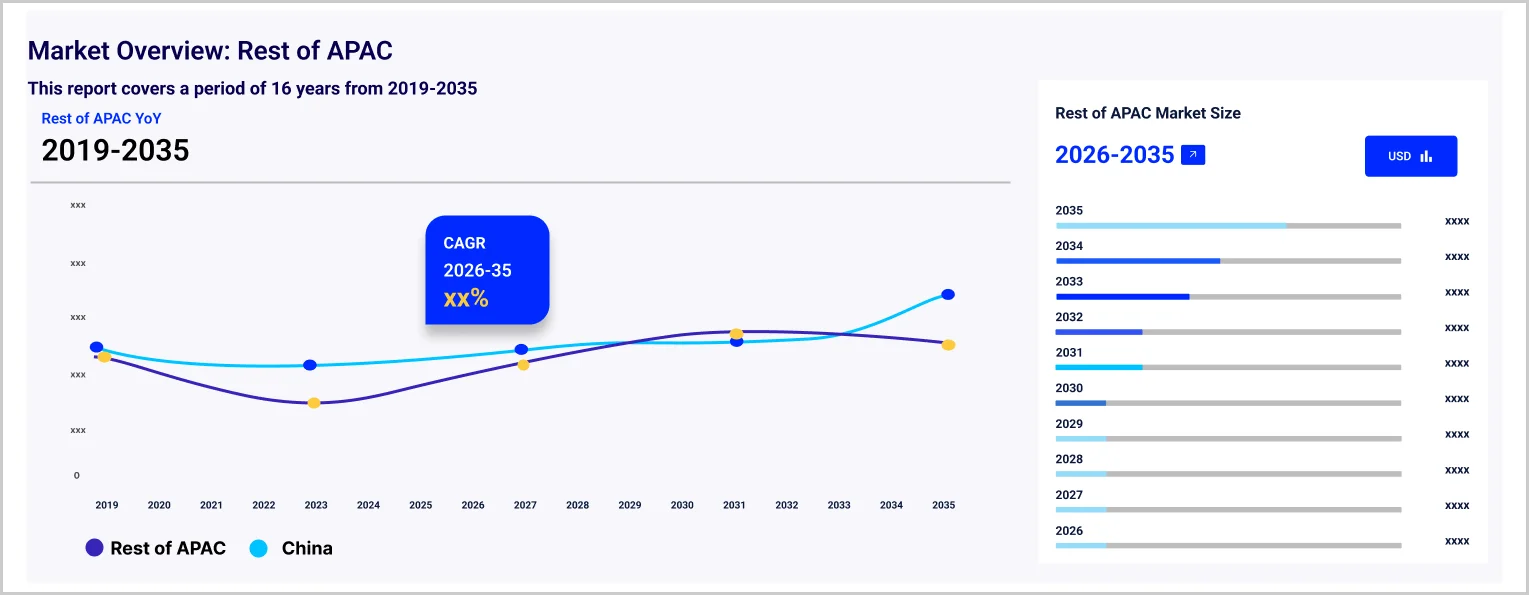
The Asia Pacific makeup market size reached USD 15.24 Billion in 2025. The market is expected to grow at a CAGR of 5.00% between 2026 and 2035, reaching almost USD 24.82 Billion by 2035.
Shiseido Company announced a restructuring of its China colour cosmetics operations in April 2026 amid persistent weakness in mainland prestige beauty consumption. As reported by Nikkei Asia, the Japanese cosmetics group is consolidating its premium makeup portfolio while doubling down on travel retail and Southeast Asian markets. The announcement reflects continued recalibration of regional strategies among major Asia Pacific makeup players adjusting to evolving Chinese consumer preferences.
L'Oréal completed the acquisition of a premium Asia based colour cosmetics brand in March 2026 to deepen its luxury division footprint across Japan, Korea, and Greater China. According to the South China Morning Post, the transaction targets Gen Z and millennial consumer growth. The deal reinforces continued premium segment consolidation across the Asia Pacific makeup market amid intensifying domestic and indie brand competition in major regional metros.
In India, the market for cruelty-free, vegetarian, and vegan cosmetics has experienced notable growth. The Indian Ministry of Health and Family Welfare has implemented a ban on cosmetic testing involving animals, reinforcing existing regulations under the Drugs and Cosmetics Rules with Rule 148-C. This regulation prohibits any person from using animals for cosmetic testing.
As per industry reports, across the Asia Pacific region, there is a substantial rise in disposable income, reaching USD 8,187 in 2022. Noteworthy countries in the region with significant disposable income include Japan at USD 22,970, South Korea at USD 22,258, Australia and New Zealand at USD 32,814, China at USD 10,529, and India at USD 5,497, among others.
Compound Annual Growth Rate
5%
Value in USD Billion
2026-2035
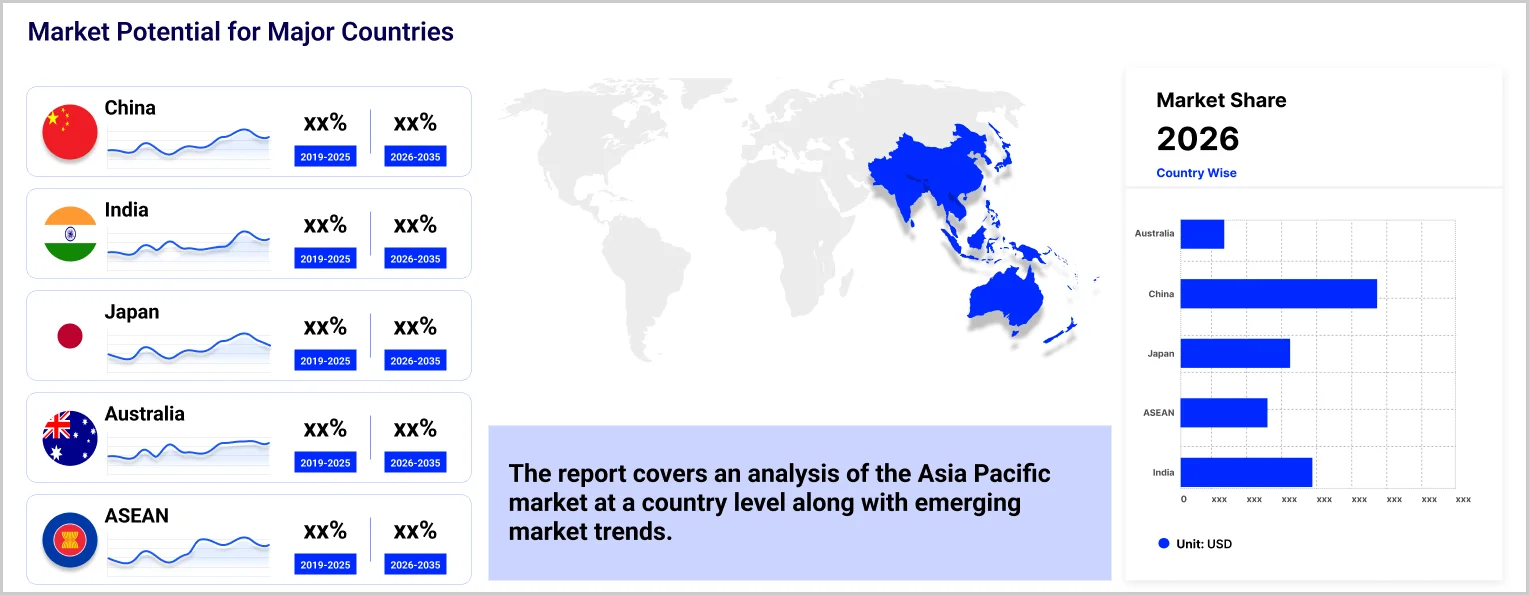
The Asia Pacific makeup market plays a vital role in both developed and developing economies, driven by accelerated urbanisation and evolving lifestyle demands. With urban populations expanding and disposable incomes rising, there's a notable surge in consumer spending on skincare and beauty products. Millennials, a significant demographic, are spearheading the beauty athleisure trend and are pivotal in driving cosmetic sales. Social media trends emphasising appearance contribute to market growth.
Cosmetics, crafted from artificial or natural sources, serve various purposes from hygiene to altering appearances, catering to both retail and professional needs. Recent market growth stems from an increased focus on hygiene and self-care, driven by consumer desires to combat stress and elevate personal appearance.
Digital technologies are reshaping consumer behaviour, allowing brands to connect and engage with customers more interactively. Innovations like personalised skincare and sustainability initiatives resonate with eco-conscious consumers, shaping industry trends towards greener practices and vegan alternatives. The embrace of vegan lifestyles has spurred demand for plant-based personal care products, driven by ethical considerations and increased awareness of animal cruelty issues within the cosmetics industry. This trend is prompting major cosmetic companies to shift towards mineral or plant-based ingredients, aligning with evolving consumer preferences playing an important role in the Asia Pacific makeup market development.
"Asia Pacific Makeup Market Report and Forecast 2026-2035" offers a detailed analysis of the market based on the following segments:
Market Breakup by Product
Market Breakup by Application Area
Market Breakup by Distribution Channel
Market Breakup by Region
To obtain a competitive advantage in the industry, companies are concentrating on growing their product lines and implementing fresh marketing techniques.
Upto 15% Off
USD
$2499 $2249
$3999 $3599
$4999 $4249
$5999 $5099


*While we strive to always give you current and accurate information, the numbers depicted on the website are indicative and may differ from the actual numbers in the main report. At Expert Market Research, we aim to bring you the latest insights and trends in the market. Using our analyses and forecasts, stakeholders can understand the market dynamics, navigate challenges, and capitalize on opportunities to make data-driven strategic decisions.*
The market is estimated to be valued at USD 15.24 Billion in 2025.
The market is projected to grow at a CAGR of 5.00% between 2026 and 2035.
The makeup market is expected to reach USD 24.82 Billion in 2035.
The market is categorised according to its product, which includes powders, gels, lotions, and others.
The key market players are L’Oréal S.A., Shiseido Co. Ltd., Estee Lauder Companies Inc., Natura &Co (Avon Products, Inc.), Chanel Limited, Revlon, Inc., Kao Corporation, Groupe Clarins, Coty Inc., HB USA Holdings, Inc., and others.
The market is driven by factors that include availability of wide range of makeup products rising demand for makeup for enhancing appearance, and growing expansion of e-commerce platforms.
The market is categorised according to its application area, which includes face, lips, eyes, and nails.
As per the Cosmetify report, the most cost-effective countries for beauty products, with GBP conversions, are Canada at $337 (£197.74), the United States at $265 (£201.67), and Turkey at £214.43. These findings highlight varying affordability across global beauty markets.
Explore our key highlights of the report and gain a concise overview of key findings, trends, and actionable insights that will empower your strategic decisions.
| REPORT FEATURES | DETAILS |
| Base Year | 2025 |
| Historical Period | 2019-2025 |
| Forecast Period | 2026-2035 |
| Scope of the Report |
Historical and Forecast Trends, Industry Drivers and Constraints, Historical and Forecast Market Analysis by Segment:
|
| Breakup by Product |
|
| Breakup by Application Area |
|
| Breakup by Distribution Channel |
|
| Breakup by Region |
|
| Market Dynamics |
|
| Competitive Landscape |
|
| Companies Covered |
|
Datasheet
One User
USD 2,499
USD 2,249
tax inclusive*
Single User License
One User
USD 3,999
USD 3,599
tax inclusive*
Five User License
Five User
USD 4,999
USD 4,249
tax inclusive*
Corporate License
Unlimited Users
USD 5,999
USD 5,099
tax inclusive*
*Please note that the prices mentioned below are starting prices for each bundle type. Kindly contact our team for further details.*
Flash Bundle
Small Business Bundle
Growth Bundle
Enterprise Bundle
*Please note that the prices mentioned below are starting prices for each bundle type. Kindly contact our team for further details.*
Flash Bundle
Number of Reports: 3
20%
tax inclusive*
Small Business Bundle
Number of Reports: 5
25%
tax inclusive*
Growth Bundle
Number of Reports: 8
30%
tax inclusive*
Enterprise Bundle
Number of Reports: 10
35%
tax inclusive*
How To Order

Select License Type
Choose the right license for your needs and access rights.

Click on ‘Buy Now’
Add the report to your cart with one click and proceed to register.

Select Mode of Payment
Choose a payment option for a secure checkout. You will be redirected accordingly.
Strategic Solutions for Informed Decision-Making
Gain insights to stay ahead and seize opportunities.

Get insights & trends for a competitive edge.

Track prices with detailed trend reports.

Analyse trade data for supply chain insights.

Leverage cost reports for smart savings

Enhance supply chain with partnerships.

Connect For More Information
Our expert team of analysts will offer full support and resolve any queries regarding the report, before and after the purchase.
Our expert team of analysts will offer full support and resolve any queries regarding the report, before and after the purchase.
We employ meticulous research methods, blending advanced analytics and expert insights to deliver accurate, actionable industry intelligence, staying ahead of competitors.
Our skilled analysts offer unparalleled competitive advantage with detailed insights on current and emerging markets, ensuring your strategic edge.
We offer an in-depth yet simplified presentation of industry insights and analysis to meet your specific requirements effectively.


