

Consumer Insights
Uncover trends and behaviors shaping consumer choices today
Procurement Insights
Optimize your sourcing strategy with key market data
Industry Stats
Stay ahead with the latest trends and market analysis.

The Australia home appliances market attained a value of USD 4.32 Billion in 2025 and is projected to expand at a CAGR of 2.20% through 2035. The market is further expected to achieve USD 5.37 Billion by 2035. Home renovation spending is rising, encouraging buyers to upgrade older appliances with modern, energy-efficient systems that deliver better functionality and lower running costs.
The market is inclining towards smarter systems as consumers go through a process of rethinking how daily products can be accommodated in compact spaces. Electrolux broadened its Australian range with an AI-powered laundry system that has adaptive wash cycles and remote diagnostics in July 2024. The introduction is representative of a larger trend in the Australia home appliances market, where big international brands are using machine learning along with energy-efficient hardware to attract a more discerning consumer base. The demand is largely influenced by the increase in electricity prices which is resulting in households and property developers being inclined to appliances that can deliver savings that are measurable over time.
The market is gaining momentum as retailers and manufacturers shift towards digital experience models. Smart fridges, induction cooktops, air purifiers, and heat pump dryers are becoming common choices, as online platforms highlight their long-term performance benefits. In July 2025, Coway launched the Airmega 50, the most compact model in its best-selling Airmega air purifier series, to the Australia home appliances market. Appliance makers now focus heavily on inverter drives, low-noise operation, water-efficient systems, and voice-activated controls integrated through home assistants.
Base Year
Historical Period
Forecast Period
Australian GDP saw continuous growth for 28 years until the COVID-19 pandemic initiated the country's largest peacetime recession since the 1930s.
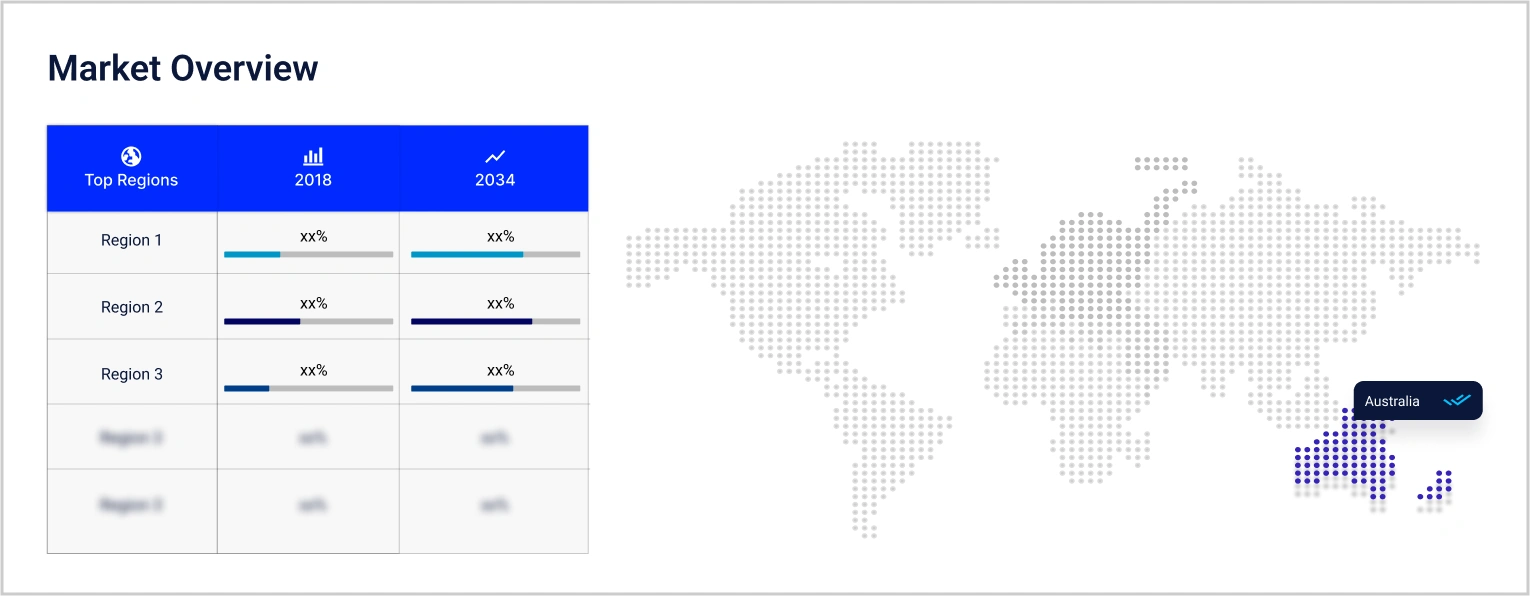
As of June 30, 2020, Australia's population reached 25,687,041, with an annual growth of 321,300 individuals (1.3%). This growth stemmed from a natural increase of 42.7% and net overseas migration of 57.3%. Despite its vast territory, approximately 90% of Australians reside in urban areas, with 67% concentrated in capital cities.
As per industry reports, over 17 million people live in these capitals, experiencing an increase of 303,100 individuals during 2018-19. Capital cities contributed 79% to the total population growth in the country during that period.
Compound Annual Growth Rate
2.2%
Value in USD Billion
2026-2035
*this image is indicative*
Smart and connected home appliances are reshaping the market dynamics as buyers seek convenience and efficiency. Leading brands are introducing AI-enabled systems that adapt performance based on load patterns, energy pricing, and user routines. In October 2025, Dreame Technology unveiled its largest product release in Australia and New Zealand, launching a suite of new smart home devices spanning robotic cleaning, kitchen appliances, home security, and beauty technology, accelerating demand in the Australia home appliances market. Builders and retailers are reporting higher sales of connected washers, dryers, and air conditioners. This is because these products align with eco-standards and deliver measurable operational cost reductions over traditional models.
Energy efficiency has become a central driving factor in the Australian market, especially as electricity costs rise and environmental standards tighten. Appliance makers are responding with heat pump dryers, inverter-driven HVAC units, and highly efficient dishwashers that significantly reduce consumption. In October 2023, Panasonic Australia and Reclaim Energy announced a partnership to launch a CO 2 hot water heat pump solution in the Australia home appliances market. Efficiency metrics are now being featured prominently in commercial tenders, and brands demonstrating superior performance often win fleet and bulk contracts.
Urban population growth in cities like Sydney and Melbourne is driving demand for compact, multifunction home appliances. Space-saving combinations, such as washer-dryer units or slimline dishwashers, are becoming standards in new apartment developments. In August 2025, Beko re-entered the Australian small domestic appliance (SDA) market with a new range of coffee machines and air fryers. Property developers and builders lean toward these compact formats to meet consumer expectations and regulatory space-use guidelines. This trend in the Australia home appliances market is reinforced by increased renovation activity, where existing homes are retrofitted with newer, smaller appliances to optimize space and efficiency.
E-commerce and digital sales experiences are transforming how home appliances are bought and specified in Australia. Retailers and brands now offer online visualization tools, augmented reality previews, and enhanced filters for energy rating, size, and performance features. B2B buyers, such as builders, architects, and procurement teams, use these tools to compare specifications before making bulk purchase decisions. Online channels also allow manufacturers to gather usage and preference data, reshaping the Australia home appliances market trends and dynamics. In July 2024, Ocado Group and Coles Group announced that both of their Customer Fulfilment Centres (CFCs) in Australia commenced operations with the introduction of a new level of customer service and differentiated home delivery to communities in Metropolitan Melbourne and Sydney.
After-sales service and predictive maintenance offerings are becoming key differentiators in the market. Brands now embed sensors and connectivity that report performance issues before failures occur, enabling service teams to pre-empt breakdowns, reduce onsite costs, and enhance product uptime. B2B buyers, such as hospitality groups and property managers, value these predictive service models because they minimize disruptions in high-usage environments, propelling the Australia home appliances market value. In April 2025, Samsung introduced a new AI-powered feature called AI Pre-Care Notification, designed to predict potential breakdowns in household appliances before they occur.
The EMR’s report titled “Australia Home Appliances Market Report and Forecast 2026-2035” offers a detailed analysis of the market based on the following segments:
Market Breakup by Type
Key Insight: The major appliance category leads within the Australia home appliances market dynamics because they anchor essential kitchen and laundry functions and consistently align with replacement and renovation cycles. Smart appliances are gaining rapid popularity due to digital adoption and software-driven efficiency. Small appliances support fast convenience trends, vacuum cleaners gain momentum owing to the increasing focus on hygiene, and cooking appliances respond to lifestyle shifts around home dining. Heating and cooling products benefit from comfort expectations and climate patterns.
Market Breakup by Distribution Channel
Key Insight: Supermarkets and hypermarkets account for the largest Australia home appliances market revenue share due to immediacy, visibility, and brand range. Online channels accelerate their market shares as convenience, transparency, and delivery reliability improve. Speciality stores remain important for premium models, personalized guidance, and installation support, while other outlets fill niche roles in small appliances and regional markets. Across channels, inventory accuracy, bundled services, and fast fulfilment drive loyalty.
Market Breakup by Region
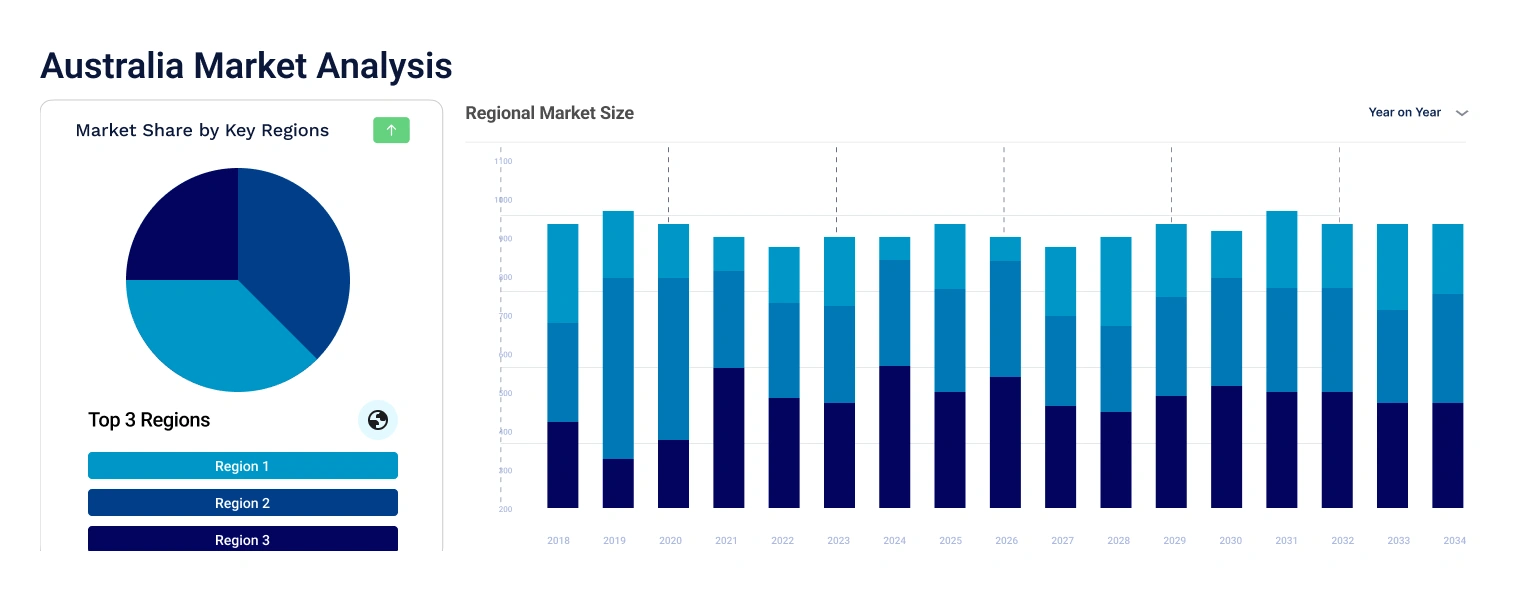
Key Insight: According to the Australia home appliances market report, New South Wales leads the market with dense homebuilding and renovation demand. Queensland rises at the fastest pace owing to population shifts and rapid housing demand growth. Victoria remains steady with strong retail networks and design-focused buyers, while Western Australia benefits from mining-linked income and ongoing construction. The Australian Capital Territory sees demand tied to compact housing stock and efficient appliances, and other regions progress with replacement cycles and lifestyle upgrades.
By type, major appliances dominate the market due to replacement cycles and rising energy standards
Major appliances hold the largest share of the market because Australian households and commercial properties rely heavily on refrigerators, dishwashers, stoves, and washers for daily function. This category benefits from consistent replacement cycles and stricter energy ratings that push buyers to upgrade older units. Manufacturers emphasize quieter operation, lower water usage, and easier integration into modern kitchen and laundry layouts. In December 2025, Hitachi Home Appliances expanded its premium refrigeration portfolio with the launch of its new Made in Japan 670-litre multi door refrigerator to the Australia home appliances market.
Smart home appliances are growing at the fastest pace as Australian buyers shift toward automated routines and remote control. Manufacturers are embedding connected features into fridges, ovens, washers, and HVAC systems, giving users a single dashboard to manage both comfort and energy use. Voice connectivity and app-based controls are becoming baseline expectations, and retailers report more interest in cross-brand platforms that sync with lighting, security, and energy management.
Supermarkets and hypermarkets largely contribute to the market revenue from broad assortment and immediate availability
Supermarkets and hypermarkets lead the market because shoppers appreciate in-person evaluation, quick pick up, and bundled pricing during routine visits. These stores house products of trusted national brands and private labels, offering seasonal promotions that influence impulse buying. Larger footprints also support clearance events and exclusive models. B2B customers, especially rental operators and property managers, use these channels for rapid procurement. Retail partnerships help manufacturers secure floor visibility and build awareness for new releases.
Online channels often lead to Australia home appliances market expansion because buyers want product transparency, flexible delivery, and easier comparison of energy ratings, dimensions, and noise levels. Retailers enhance search filters and analytics to recommend models by lifestyle, property size, or usage intensity. This channel is attractive for contractors, developers, and renovators who need precise specifications without store visits. Digital platforms also enable rapid customer support, installation scheduling, and extended warranty activation.
New South Wales accounts for the largest share of the market due to dense housing and strong renovation activity
New South Wales leads the market because Sydney and surrounding areas continue to see strong residential turnover, renovation investment, and apartment construction. These dynamics fuel demand for both major and small appliances tailored to compact layouts. Retail penetration is high, with broad access to premium and mid-range brands across physical and online channels.
Queensland observes fast growth in the Australia home appliances market as population increases drive housing demand, retrofit spending, and small business expansion. Warmer climate patterns elevate cooling demand, lifting sales in AC units and air treatment appliances. Regional growth corridors attract developers and property managers who standardize appliance packages to streamline procurement. Retailers invest more in online service and flexible delivery networks to cover diverse geographies.
The competitive landscape in the market is shaped by smart connectivity, premium design, and energy efficiency. Prominent Australia home appliances market players are competing to lock in long-term consumer and B2B loyalty through software-driven features and tightly integrated service models. Appliance makers now focus more on air quality, fabric care, predictive alerts, and app-based personalization.
Australia home appliance companies are focusing on more digitization, more sustainability, and deeper collaboration with retailers and property developers. Companies are also leaning towards compact, modular designs to suit smaller urban homes while smoothing installation and service pathways for builders and facility teams. A big opportunity lies in after-sales ecosystems such as extended warranties, remote diagnostics, replacement parts, and upgrade paths, because they create recurring value well beyond the initial product sale.
Established in 1985 and headquartered in New South Wales, Australia, Samsung Electronics Australia delivers a broad appliance lineup with a strong focus on connected living. Smart fridges, washers, and air treatment systems tie into a unified app platform for remote control and diagnostics. The company emphasizes energy-aware features and sleek design, appealing to developers and renovators who want efficient installations and strong product reliability.
Founded in 1978 and based in New South Wales, Australia, Panasonic Australia specializes in sustainable appliance solutions, from air purifiers and microwaves to smart cooking devices. Its direction leans toward quiet operation, air quality optimization, and space-saving builds, supporting urban homeowners and rental portfolios.
BSH, formed in 1967 and headquartered in Melbourne, Australia operates premium brands including Bosch and Siemens. It focuses on water and energy efficiency, advanced cooking platforms, and durable laundry systems. BSH develops appliances with modular installation options, appealing to design firms and multi-residential projects.
Founded in 1934 and headquartered in New South Wales, Australia, Fisher & Paykel targets design-led appliances with strong aesthetic and ergonomic cues. Its DishDrawer and column refrigeration systems deliver modular flexibility prized by architects and renovators. The brand prioritizes precision cooking and gentle fabric care features while building strong service delivery.
*Please note that this is only a partial list; the complete list of key players is available in the full report. Additionally, the list of key players can be customized to better suit your needs.*
Other key players in the market include Arisit Pty Ltd., LG Electronics Inc., and Electrolux Home Products Pty Limited, among others.
Unlock the latest insights with our Australia home appliances market trends 2026 report. Discover regional growth patterns, consumer preferences, and key industry players. Stay ahead of competition with trusted data and expert analysis. Download your free sample report today and drive informed decisions in the market.
Saudi Arabia Home Appliances Market
South Korea Major Home Appliances Market


Upto 15% Off
USD
$2499 $2249
$3999 $3599
$4999 $4249
$5999 $5099


*While we strive to always give you current and accurate information, the numbers depicted on the website are indicative and may differ from the actual numbers in the main report. At Expert Market Research, we aim to bring you the latest insights and trends in the market. Using our analyses and forecasts, stakeholders can understand the market dynamics, navigate challenges, and capitalize on opportunities to make data-driven strategic decisions.*
Get in touch with us for a customized solution tailored to your unique requirements and save upto 35%!
In 2025, the market reached an approximate value of USD 4.32 Billion.
The market is projected to grow at a CAGR of 2.20% between 2026 and 2035.
The revenue generated from the home appliances market is expected to reach USD 5.37 Billion in 2035.
The market is categorised according to its type, which includes small appliances, major appliances, smart home appliances and others.
The key players in the market include Samsung Electronics Australia Pty Limited, Panasonic Australia Pty Ltd., BSH Home Appliances Pty Ltd., Fisher & Paykel Australia Pty Limited, Arisit Pty Ltd., LG Electronics Inc., and Electrolux Home Products Pty Limited, among others.
Investing in connected platforms, expanding localized service networks, co-designing with developers, optimizing supply chains, and leveraging data insights help stakeholders strengthen resilience and capture premium consumer value.
The market is categorised according to its distribution channel, which includes supermarkets and hypermarkets, specialty stores, online channels, and others.
Some Australian-owned kitchen appliance brands renowned for high-quality, locally designed products include Qasair for kitchen ventilation, Oliveri for sinks, Billi for water dispensers, Zip for boiling water taps, and Sussex Taps for faucets.
High energy expectations, fast design cycles, supply chain friction, and price competition pressure appliance makers while buyers demand better durability, smarter software, smaller footprints, and stronger after-sales support.
Explore our key highlights of the report and gain a concise overview of key findings, trends, and actionable insights that will empower your strategic decisions.
| REPORT FEATURES | DETAILS |
| Base Year | 2025 |
| Historical Period | 2019-2025 |
| Forecast Period | 2026-2035 |
| Scope of the Report |
Historical and Forecast Trends, Industry Drivers and Constraints, Historical and Forecast Market Analysis by Segment:
|
| Breakup by Type |
|
| Breakup by Distribution Channel |
|
| Breakup by Region |
|
| Market Dynamics |
|
| Competitive Landscape |
|
| Companies Covered |
|
Datasheet
One User
USD 2,499
USD 2,249
tax inclusive*
Single User License
One User
USD 3,999
USD 3,599
tax inclusive*
Five User License
Five User
USD 4,999
USD 4,249
tax inclusive*
Corporate License
Unlimited Users
USD 5,999
USD 5,099
tax inclusive*
*Please note that the prices mentioned below are starting prices for each bundle type. Kindly contact our team for further details.*
Flash Bundle
Small Business Bundle
Growth Bundle
Enterprise Bundle
*Please note that the prices mentioned below are starting prices for each bundle type. Kindly contact our team for further details.*
Flash Bundle
Number of Reports: 3
20%
tax inclusive*
Small Business Bundle
Number of Reports: 5
25%
tax inclusive*
Growth Bundle
Number of Reports: 8
30%
tax inclusive*
Enterprise Bundle
Number of Reports: 10
35%
tax inclusive*
How To Order

Select License Type
Choose the right license for your needs and access rights.

Click on ‘Buy Now’
Add the report to your cart with one click and proceed to register.

Select Mode of Payment
Choose a payment option for a secure checkout. You will be redirected accordingly.
Gain insights to stay ahead and seize opportunities.

Get insights & trends for a competitive edge.

Track prices with detailed trend reports.

Analyse trade data for supply chain insights.

Leverage cost reports for smart savings

Enhance supply chain with partnerships.

Connect For More Information
Our expert team of analysts will offer full support and resolve any queries regarding the report, before and after the purchase.
Our expert team of analysts will offer full support and resolve any queries regarding the report, before and after the purchase.
We employ meticulous research methods, blending advanced analytics and expert insights to deliver accurate, actionable industry intelligence, staying ahead of competitors.
Our skilled analysts offer unparalleled competitive advantage with detailed insights on current and emerging markets, ensuring your strategic edge.
We offer an in-depth yet simplified presentation of industry insights and analysis to meet your specific requirements effectively.


Share