

Consumer Insights
Uncover trends and behaviors shaping consumer choices today
Procurement Insights
Optimize your sourcing strategy with key market data
Industry Stats
Stay ahead with the latest trends and market analysis.
The Australia total spend management market attained a value of USD 190.40 Million in 2025 and is projected to expand at a CAGR of 7.65% through 2035. The market is further expected to achieve USD 397.93 Million by 2035. AI-powered spend classification and automated procurement processes are assisting businesses to streamline disjointed procurement information, ensure policy compliance, and find savings within their disjointed supplier expense information.
The increasing complexity of their suppliers is driving companies in the Australia total spend management market to implement central supplier intelligence systems, while strict governance mandates are leading to an increase in automation of approvals, contract management, and policy-compliant purchases. Simultaneously, AI-powered analytics can assist procurement departments in identifying rogue spending, benchmarking suppliers, and negotiating deals based on transactional information instead of relying on reports. This is highly beneficial for companies that deal with thousands of suppliers and recurrent contracts with services.
The trend towards autonomous procurement is being championed by SAP through SAP Ariba, launched in May 2026, source to contract, procure to pay, supplier management and AI agents that compare suppliers, advise on next steps and automate workflows supervised by humans. This Australia total spend management market trend is relevant as its procurement context is getting increasingly bigger and data-intensive. The Australian Government recorded 86,926 contracts with a total value of AUD 104.9 billion during 2024-25 procurement season.
Moreover, the market context is also being affected by the need to integrate procurement with finance, supplier risk management and operational planning instead of controlling expenditure as a stand-alone purchasing process. Hence, providers are aiming to deliver intelligent category management, contract analytics, guided purchasing and spend intelligence for procurement teams to manage their service-based procurement environments. For example, in August 2026, Snowflake launched AI routing to help enterprises optimize AI workloads, reduce spending, and improve cost efficiency across operations.
Compound Annual Growth Rate
7.65%
Value in USD Million
2026-2035
Read more about this report - REQUEST FREE SAMPLE COPY IN PDF
Credit lines were introduced by Nexo Australia, allowing for eligible users to draw liquidity against their crypto without having to liquidate their investments. Companies in the Australia total spend management market are able to build regulated asset-based lending and liquidity services that increase financial flexibility.
Stripe Treasury was rolled out in Australia, providing companies with the ability to manage multiple currencies in one system. Companies are able to create a multi-currency wallet, automatic currency conversions, supplier payments, and cross-border cash management.
Budgetly came up with AI Bookkeeping to automate transaction classification, GST tracking, receipt verification, and financial record keeping for small and medium-sized businesses in Australia. Businesses in the Australia total spend management market can use AI-powered bookkeeping and transactions monitoring, as well as automated compliance functionalities, to ease financial processing and get better spend visibility.
Cirrova introduced a spend management platform for Azure that provides real-time spend visibility, anomaly detection, forecast, and optimization insights without the need for FinOps professionals. Businesses can create cloud spend analytics with predictive forecasts and optimization suggestions to solve increasing cloud spend, boosting growth in the Australia total spend management market.
AI is transforming the Australia total spend management market dynamics through the automation of spend classification, supplier discovery, contract analysis, and procurement activities. For example, SAP deploys Joule and AI agents throughout its procurement ecosystem, and Coupa is working on the development of AI-native solutions that enable the identification of potential cost savings and supplier risks. Responsible AI adoption is also being stressed by the Digital Transformation Agency of Australia within government procurement, in line with the general enterprise trend towards trusted automation. In August 2026, SAP Concur launched AI-powered travel expense tools to automate reporting, improve compliance, and streamline expense management for businesses.
Integration of procurement, finance, ERP, and supplier management systems is emerging as an important procurement concern for organizations in Australia. Vendors such as SAP, Oracle, and Coupa are enhancing connected source-to-pay systems that harmonize procurement, invoicing, contracts, and suppliers' data. Interoperable digital services continue to be promoted by the Australian Government Digital Transformation Agency as part of the broader trend towards integrated enterprise systems. It is especially important for organizations dealing with dispersed procurement in various departments, boosting demand in the Australia total spend management market. Integration of spend platforms helps finance executives to see commitments and invoices quickly. In February 2026, Weel launched a payments tool addressing employee spending anxiety, offering greater control, visibility, and confidence over business expenses.
Supplier risk management is becoming increasingly significant as Australia-based companies are looking to gain insight into their financial, operational, cyber and geographic risks in their complex supply networks. As a result, Australia total spend management market players are incorporating supplier intelligence, risk scores, monitoring and third-party data into their procurement process. There is growing focus on resilience and supply chain risks among critical infrastructure because of the Critical Infrastructure Act framework developed by the Australian Government. In response, providers such as SAP and Coupa are introducing solutions that integrate supplier intelligence with risk signals, allowing procurement departments to pinpoint vulnerable suppliers and mitigate risks. The development provides platforms an opportunity to integrate supplier onboarding, compliance, performance monitoring, and contingency plans into a single workflow. In March 2025, SpendHQ launched a supplier risk solution, helping businesses identify, monitor, and mitigate supplier-related risks through enhanced visibility.
Digitization of government procurement creates the need for spend management platforms that will manage larger supplier networks while ensuring transparency and compliance. Large-scale supplier ecosystem requires automation of onboarding, purchase control, invoice processing and supplier documentation. Digital procurement and automated procurement workflow solutions are being offered by SAP, Oracle, and Coupa with regard to those needs. At the same time, government efforts to promote digitization and standardization of procurement processes encourage organizations to streamline manual processes, accelerating the Australia total spend management market scope. In August 2026, Melio launched an AI-powered expense management tool enabling SMBs to automate financial operations, improve visibility, and reduce administrative workloads.
The use of e-invoicing is facilitating automation in the procure-to-pay process, which is urging companies to integrate their invoice processing with more comprehensive spend management systems, broadening the Australia total spend management market scope. E-invoicing is being actively promoted by the Australian Taxation Office through the Australian Peppol system, allowing businesses to exchange their invoices electronically in a standard way with the government. Invoice automation, three-way matching, approval processes, and fraud prevention tools are becoming increasingly common in procurement software. This is presenting a chance for solution providers to go beyond purchase order management and offer complete transaction visibility solutions. In December 2025, Zoho launched enterprise billing and spend management solutions, helping businesses automate expenses, control costs, and improve financial visibility.
The Expert Market Research's report titled “Australia Total Spend Management Market Report and Forecast 2026-2035” offers a detailed analysis of the market based on the following segments:
Market Breakup by Deployment
Key Insight: Deployment options on cloud platforms are being increasingly prioritized due to scalability, centralization, automation of updates, finance management capabilities, boosting the Australia total spend management market growth. The subscription-based model of these systems is beneficial for buyers that would prefer to grow their capabilities without additional infrastructure investment. In some cases, buyers choose deployment on premises if it is more important for them to have control over confidential procurement data and processes, customization, ability to integrate with legacy systems, and so on. Deployment on premises also appeals to buyers who would like to have more direct access to the infrastructure. Both types of deployment require consideration of interoperability, security, configurable approval processes, analytics, and supplier management capabilities due to increased need for expenditure management.
Market Breakup by Enterprise
Key Insight: As per the Australia total spend management market report, SMEs emphasize cost, speed to implementation, simplified approval process, and technology to eliminate manual spreadsheet-based procurement. Large-scale enterprises emphasize intricate supplier networks, enterprise governance, category savings, contract management, and business unit integration. SMEs are more inclined towards scalable cloud-based modules that grow as the business grows, whereas large enterprises require customized solutions with robust analysis, risk management, and multi-organization management capabilities. Automated invoicing, supplier management, compliance, and spend analysis are important for both SMEs and large-scale organizations, but the emphasis differs depending upon the complexities of the procurement process.
Market Breakup by Application
Key Insight: Manufacturing focuses on supplier consolidation, purchase of production related items, compliance with contracts, and facility visibility, redefining the Australia total spend management market dynamics and trends. For the healthcare industry, emphasis is on controlled procurement, supplier and spend management at clinical level. BFSI needs robust policy control, audit ability, vendor management, and secure workflow. The IT & Telecom industry focuses on software, cloud, infrastructure, and service cost, which makes visibility of licenses and contracts important. Hospitality needs automation of purchases within properties as well as suppliers whereas retail needs category-level control, inventory-related purchases, and supplier negotiation. Others include professional services and government sector operations, where configurable approvals, supplier management, and analytics help in disciplined procurement.
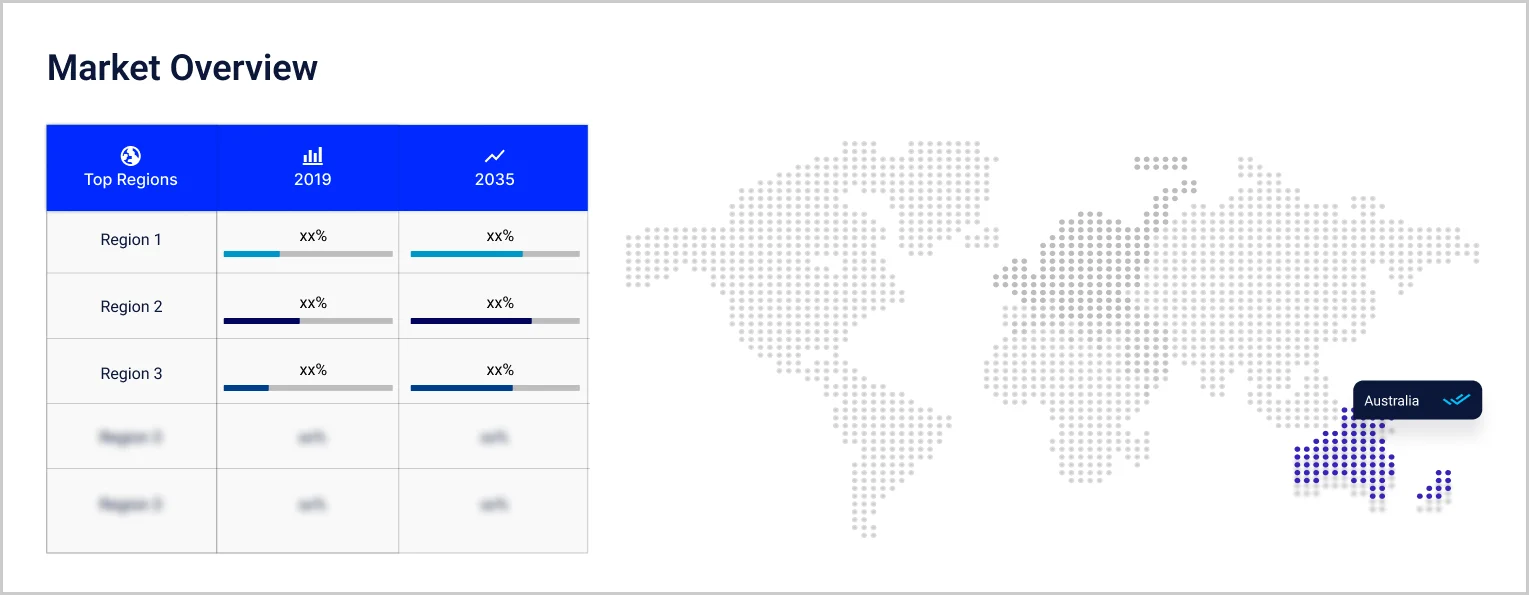
Market Breakup by Region
Key Insight: NSW excels due to having a number of corporate headquarters, banks, technology companies, and other organizations that need active spend management. Victoria leverages diversification in industries and digital procurements in manufacturing, healthcare, professional services, and retail sectors. Queensland benefits from infrastructural needs, resource extraction, tourism, and procurement for other business operations where it is important to coordinate suppliers. ACT procurement is driven by the need to follow the procurement rules of the government. The Western Australia total spend management market is driven by mining and energy industries. Other states tend to pay more attention to scalable systems, supplier management, automated workflows, and analytics to manage dispersed purchasing.
By deployment, the cloud platform leads growth in the market due to scalability and integration
Cloud deployment is the leading segment that is generating maximum demand in the Australia total spend management market due to scalability, quick deployment, and low maintenance needs. The preference of companies lies in centralized visibility of expenditure amid decentralized purchasing departments, whereas cloud systems provide continuous updates, remote accessibility, automation, and integration with ERP and finance solutions. In such an environment, vendors are capable of offering advanced capabilities for AI-driven spending classification and vendor analysis without asking their customers to manage complicated infrastructure. These features make cloud deployment attractive for those organizations which look for flexibility of procurement processes, timely introduction of new features, and standardization of controls. In July 2026, Infront launched Opess to help Australian businesses apply FinOps practices, optimize cloud costs, and improve spending visibility.
The growth rate of on-premises deployment is increasing fast as organizations with high requirements for data governance opt for more control over procurement data and configurations of procurement systems. Banks, governmental organizations, and companies that have to work with highly confidential information related to suppliers might prefer locally hosted infrastructure, personalized access rights, and integration with existing legacy systems. The Australia total spend management market is seeing increased demand from purchasing departments for customized workflows aligned with internal procedures.
Large enterprises dominate the market by a considerable margin due to complex procurement and supplier ecosystems
Large-scale enterprises continue to dominate the Australia total spend management market as complex procurement and supplier networks need advanced spend management functionalities. They emphasize centralized governance, category management, contracts management, supplier risk management, and ERP/financial systems integration. Analytics help procurement executives detect leakage, consolidate purchasing volume, and source products or services across all business units. They require highly customizable approval hierarchies and audit logs. Competing vendors provide more advanced enterprise spend management automation, AI analytics, and interoperability so that procurement teams can handle different spend categories with dynamic workflows. In November 2025, ISH acquired Australian spend management platform ProSpend to strengthen its capabilities in automated expense management and financial controls.
SMEs largely contribute to the Australia total spend management market value since companies want solutions that do not require too much investment but at the same time offer visibility and automation of expenses. Spend management platforms allow SMEs to build approval processes, control suppliers, automate invoices, and implement spend management policies despite the lack of well-developed procurement infrastructure. Vendors highlight flexibility of subscriptions, intuitive interfaces, and quick implementation process. With the growth of digital finance technology, scalable spend management is becoming increasingly important for SMEs. In July 2026, RewardPay launched a new payment portal enabling Australian SMEs to earn loyalty points across multiple programs on business expenses.
Manufacturing applications secure the dominant share of the market due to complex sourcing and supplier management requirements
Manufacturing is by far the largest application due to complicated sourcing, direct materials, indirect procurements, and vendor relationships, creating ample opportunities in the Australia total spend management market. It needs centralized spending visibility due to the complexity of the process. Manufacturers are using total spend management to aggregate procurement volumes, streamline supplier selections, check contract compliance, and detect leakage in different plants. They are also integrating their systems with ERP so as to combine procurement decisions with manufacturing plans and finances. In July 2025, Ramp launched AI agents to automate finance operations, enforce expense policies, reduce unauthorized spending, and streamline financial workflows.
The IT and telecom industry is witnessing the highest rate of growth in the Australia total spend management market. Procurement teams are managing technology procurement, subscription, cloud-based services, and suppliers. It uses spend management solutions to track software licenses, telecommunications contracts, professional services, and infrastructure commitments through workflows. They are using renewal notifications and contract analytics to reduce costs and improve supplier visibility. Vendors are targeting this segment with integrations across enterprise business applications and AI-powered classification and benchmarking.
Read more about this report - REQUEST FREE SAMPLE COPY IN PDF
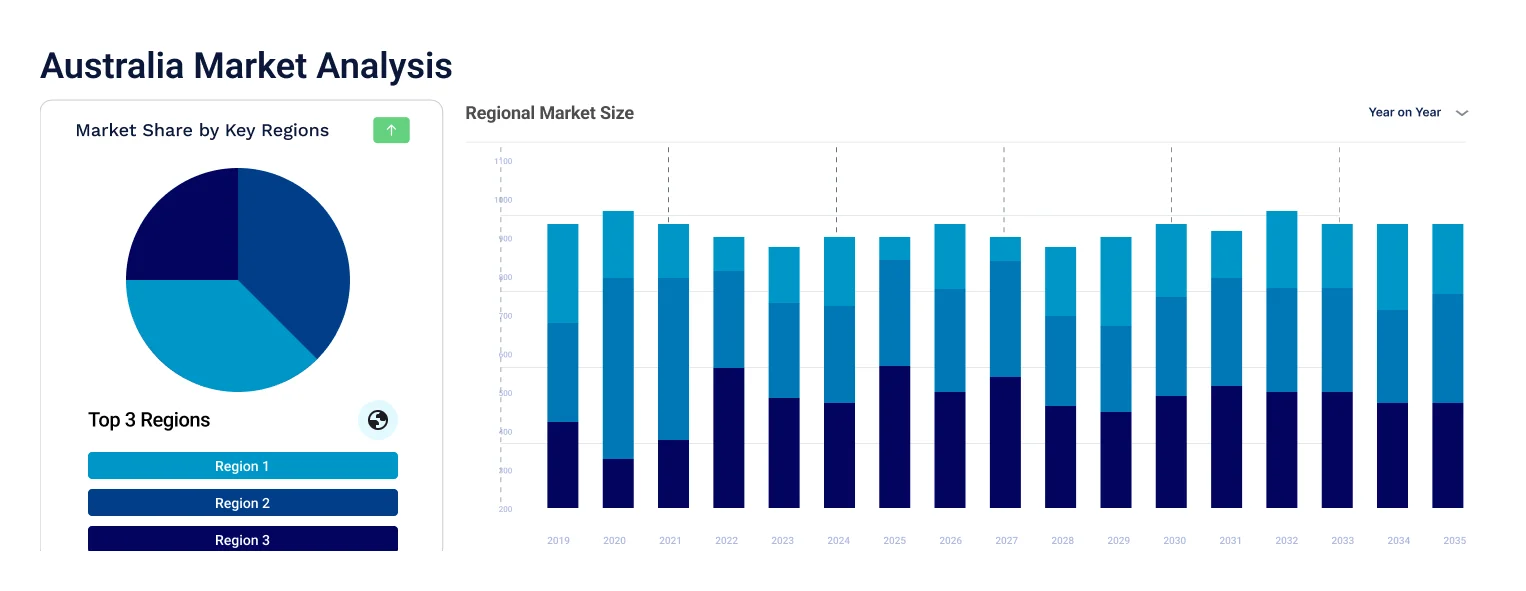
New South Wales clocks in the dominant share of the market due to corporate concentration and complexity
New South Wales is the leading regional total spend management market in Australia owing to the concentration of financial services, technology firms, and headquarters of established corporations in Sydney. In such a scenario, there would be a need for centralized procurement controls, supplier management, contract analytics, and organization-wide procurement spending insights. Firms want to have platforms that link procurement with finances and ERP systems. There are opportunities for vendors to leverage AI spend analysis, automated approval and supplier risk features which enable the procurement leaders to save resources, standardize procurement policies and governance in a consistent manner in organizations. In September 2025, Cape and Basiq partnered to accelerate SME access to credit and spend management tools through open banking technology.
Victoria is growing at an accelerated pace owing to accelerated adoption of digital procurement, automation and integrated finance workflows by the businesses of Melbourne, boosting the Australia total spend management market growth. The diverse presence of organizations in Victoria in various sectors like professional services, manufacturing, healthcare, retail and technology makes different demands from organizations. There is a need for platforms that can give visibility and controls on the purchases.
Competitiveness in the market is increasing, with fintechs and enterprise software companies moving from simple expense reporting to financial controls. Australia total spend management market players are emphasizing corporate cards, automated account payables, real-time budgets, artificial intelligence-powered expense management, supply chain visibility, and integrations with accounting applications. Volopay and Weel are developing their unified spend management platforms, and Budgetly is offering AI-first spend controls to Australian SMEs with its new "Control Loop" method. ELMO is adding to its expense management platform via its partnership with Emburse, linking travel, expense, and invoice management processes.
Australia total spend management companies can differentiate through artificial intelligence transaction decisions, predictive cash flow management, fraud prevention, and automatic compliance solutions. Companies with the ability to link purchase decisions to accounting systems and localized data management will be able to add value to the market in the coming years.
Formed in 2020, Volopay is based in Singapore and manages its Australian operations from Sydney. It delivers corporate cards, expense management, bill payments, reimbursement, and accounting through a single financial control platform. For the Australia total spend management market, its service includes real-time insights, approval process, automation process, and centralized expense management for growing firms.
Founded in 2019, Budgetly is located in Brisbane, Australia. The company caters to the needs of Australian SMEs with its AI-first approach to spend management platform through prepaid cards, real-time budgets, approvals, receipt matching, bill payments, and accounting integrations. Its 2026 Control Loop is planned to bridge the gap between decision-making, execution, recording, and learning finance.
Formed in 2002, ELMO Software operates from Australia. ELMO’s expense management system links up expenses incurred by employees with other Human Resources and payroll processes. ELMO’s partnership with Emburse expands configurable solutions for travel, expense, and invoice automation across Australia and New Zealand.
Founded in 2016, Weel is based in Sydney, Australia. The company offers a suite of services such as digital corporate cards, budgets, expense management, bill payments, reimbursements, accounts payable automation, and accounting integration. Expansion into accounts payable automation and collaborations with Nium and Visa are facilitating Weel’s expansion in the Australia total spend management market.
Other key players in the market include Rippling People Center Inc., Concur Technologies, Inc., and Cape Pty Ltd., among others.
*Please note that this is only a partial list; the complete list of key players is available in the full report. Additionally, the list of key players can be customized to better suit your needs.*
Unlock the latest insights with our Australia total spend management market trends 2026 report. Discover regional growth patterns, consumer preferences, and key industry players. Stay ahead of competition with trusted data and expert analysis. Download your free sample report today and drive informed decisions in the market.


Upto 15% Off
USD
$2499 $2249
$3999 $3599
$4999 $4249
$5999 $5099


*While we strive to always give you current and accurate information, the numbers depicted on the website are indicative and may differ from the actual numbers in the main report. At Expert Market Research, we aim to bring you the latest insights and trends in the market. Using our analyses and forecasts, stakeholders can understand the market dynamics, navigate challenges, and capitalize on opportunities to make data-driven strategic decisions.*
The market was valued at USD 190.40 Million in 2025.
The market is projected to grow at a CAGR of 7.65% between 2026 and 2035.
The revenue generated from the market is expected to reach USD 397.93 Million in 2035.
The total spend management market is categorised according to deployment, which includes cloud-based and on-premises.
The total spend management market key players are Volopay Pty Ltd., Budgetly Pty Ltd., ELMO Software Pty Ltd., Weel Holdings Pty Ltd., Rippling People Center Inc., Concur Technologies, Inc., and Cape Pty Ltd. among others.
Based on the enterprise, the market is divided into small & medium enterprises and large enterprises.
The market is broken down into New South Wales, Victoria, Queensland, Australian Capital Territory, Western Australia, and others
Companies face fragmented financial data, integration complexity, cybersecurity risks, regulatory requirements, employee adoption barriers, supplier-data quality issues, and pressure to deliver measurable savings without disrupting purchasing workflows.
Stakeholders are integrating AI analytics, strengthening local data controls, expanding accounting integrations, automating supplier workflows, improving SME affordability, and developing predictive tools for real-time spending decisions.
Explore our key highlights of the report and gain a concise overview of key findings, trends, and actionable insights that will empower your strategic decisions.
| REPORT FEATURES | DETAILS |
| Base Year | 2025 |
| Historical Period | 2019-2025 |
| Forecast Period | 2026-2035 |
| Scope of the Report |
Historical and Forecast Trends, Industry Drivers and Constraints, Historical and Forecast Market Analysis by Segment:
|
| Breakup by Deployment |
|
| Breakup by Enterprise |
|
| Breakup by Application |
|
| Breakup by Region |
|
| Market Dynamics |
|
| Competitive Landscape |
|
| Companies Covered |
|
Datasheet
One User
USD 2,499
USD 2,249
tax inclusive*
Single User License
One User
USD 3,999
USD 3,599
tax inclusive*
Five User License
Five User
USD 4,999
USD 4,249
tax inclusive*
Corporate License
Unlimited Users
USD 5,999
USD 5,099
tax inclusive*
*Please note that the prices mentioned below are starting prices for each bundle type. Kindly contact our team for further details.*
Flash Bundle
Small Business Bundle
Growth Bundle
Enterprise Bundle
*Please note that the prices mentioned below are starting prices for each bundle type. Kindly contact our team for further details.*
Flash Bundle
Number of Reports: 3
20%
tax inclusive*
Small Business Bundle
Number of Reports: 5
25%
tax inclusive*
Growth Bundle
Number of Reports: 8
30%
tax inclusive*
Enterprise Bundle
Number of Reports: 10
35%
tax inclusive*
How To Order

Select License Type
Choose the right license for your needs and access rights.

Click on ‘Buy Now’
Add the report to your cart with one click and proceed to register.

Select Mode of Payment
Choose a payment option for a secure checkout. You will be redirected accordingly.
Strategic Solutions for Informed Decision-Making
Gain insights to stay ahead and seize opportunities.

Get insights & trends for a competitive edge.

Track prices with detailed trend reports.

Analyse trade data for supply chain insights.

Leverage cost reports for smart savings

Enhance supply chain with partnerships.

Connect For More Information
Our expert team of analysts will offer full support and resolve any queries regarding the report, before and after the purchase.
Our expert team of analysts will offer full support and resolve any queries regarding the report, before and after the purchase.
We employ meticulous research methods, blending advanced analytics and expert insights to deliver accurate, actionable industry intelligence, staying ahead of competitors.
Our skilled analysts offer unparalleled competitive advantage with detailed insights on current and emerging markets, ensuring your strategic edge.
We offer an in-depth yet simplified presentation of industry insights and analysis to meet your specific requirements effectively.




