

Consumer Insights
Uncover trends and behaviors shaping consumer choices today
Procurement Insights
Optimize your sourcing strategy with key market data
Industry Stats
Stay ahead with the latest trends and market analysis.
The global carbon footprint management market size reached a value of USD 10.99 Billion in 2025. The market is likely to grow further at a CAGR of 6.30% during 2026-2035 to reach a value of USD 20.25 Billion in 2035.
Compound Annual Growth Rate
6.3%
Value in USD Billion
2026-2035
| Global Carbon Footprint Management Market Report Summary | Description | Value |
| Base Year | USD Billion | 2025 |
| Historical Period | USD Billion | 2019-2025 |
| Forecast Period | USD Billion | 2026-2035 |
| Market Size 2025 | USD Billion | 10.99 |
| Market Size 2035 | USD Billion | 20.25 |
| CAGR 2019-2025 | Percentage | XX% |
| CAGR 2026-2035 | Percentage | 6.30% |
| CAGR 2026-2035 - Market by Region | North America | 7.2% |
| CAGR 2026-2035 - Market by Country | UK | 7.3% |
| CAGR 2026-2035 - Market by Country | USA | 7.1% |
| CAGR 2026-2035 - Market by End-User | Manufacturing | 7.0% |
| CAGR 2026-2035 - Market by Lifetime | Material Production | 6.8% |
| Market Share by Country 2025 | Italy | 3.2% |
In August 2023, Sumitomo Mitsui Banking Corporation (SMBC), IBM Japan and Persefoni collaborated to offer a decarbonisation solution to Japanese customers, which enables them to analyse and support carbon footprint management. Also, the digitally-enabled services help meet regulatory and compliance requirements.
In June 2023, Salesforce developed Net Zero Cloud to enhance the tracking and reporting of the company’s carbon footprint in order to accelerate its transition to net zero. The Net Zero Cloud is used by organisations of all sizes as it helps streamline and improve the availability of emissions reporting. Such initiatives by the key players are expected to support the carbon footprint management market growth.
In May 2023, Sphera® introduced its Life Cycle Assessment (LCA) Automation software, a next-generation solution that helps customers to gain real-time insights into the environmental footprint of their products and also calculate the carbon footprint at scale. The company intends to enable engineers to develop sustainable products and establish lower carbon emission supply chains.
In September 2021, Engie launched Ellipse, a carbon intelligence platform that allows companies to track their carbon emissions in real-time, design strategies to reduce emissions, and efficiently use sustainability investments. It is tailored to build an accurate emissions footprint using artificial intelligence, allows carbon-first decision-making, and enables the gathering of vast amounts of data. The new product launches by the leading manufacturers are expected to increase the carbon footprint management market share.
In April 2021, Schneider Electric decided to collaborate with 1,000 suppliers to help reduce their CO2 emissions throughout their operations by 50% by 2025. This will be achieved by delivering digital tools and resources to help them achieve carbon reduction targets. The decision is a part of the company’s Zero Carbon Project initiative, designed to enable the suppliers to develop innovative strategies for emissions reduction.
Read more about this report - REQUEST FREE SAMPLE COPY IN PDF
Carbon footprint management is a strategic approach adopted by organisations to reduce carbon emissions from daily activities to contribute towards limiting the impact of climate change. Also, it helps businesses to identify their potential, supporting the efficient usage of carbon emissions, leading to cost savings.
Read more about this report - REQUEST FREE SAMPLE COPY IN PDF
The EMR’s report titled “Carbon Footprint Management Market Report and Forecast 2026-2035” offers a detailed analysis of the market based on the following segments:
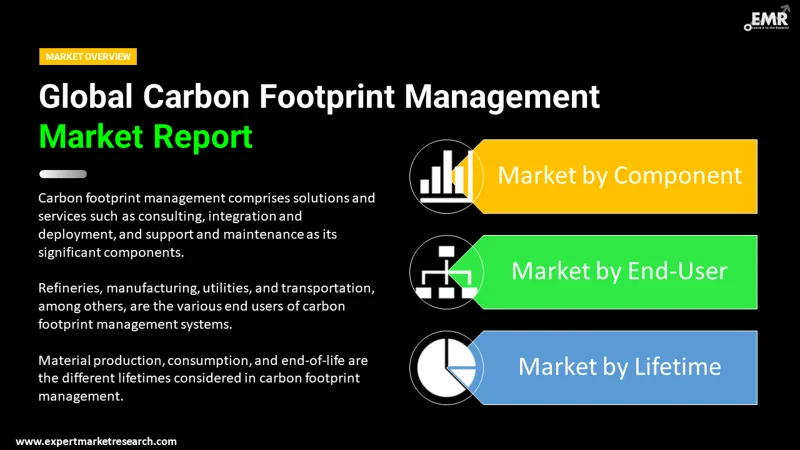
Market Breakup by Component
Market Breakup by End-User
Market Breakup by Lifetime
Market Breakup by Region
| CAGR 2026-2035 - Market by | Country |
| UK | 7.3% |
| USA | 7.1% |
| China | 6.6% |
| Germany | 6.5% |
| Australia | 6.4% |
| Canada | XX% |
| France | 6.2% |
| Italy | XX% |
| Japan | XX% |
| India | XX% |
| Saudi Arabia | XX% |
| Brazil | XX% |
| Mexico | 5.9% |
There is a rising use of integrated digital solutions for carbon footprint calculation, carbon reduction, and carbon offsetting that are tailored to meet the requirements of customers. The market players are offering efficient carbon footprint management solutions that help organisations to achieve the goals of carbon neutrality and enable them to use cost-effective and reliable, clean energy sources in order to coexist with the global environment.
In July 2023, Alibaba Cloud introduced its Energy Expert, a software-as-a-service offering that allows customers to measure, analyse, and manage the carbon emissions of their activities and products. The platform offers energy-saving insights and energy-efficient technologies that enable clients to attain sustainability and reduce their carbon footprint. The initiatives taken by the key players in offering such innovative solutions that meet the customer expectations are likely to support the carbon footprint management market in the long run.
Also, there are carbon footprint management services that provide the expertise and resources to enable the clients to aggregate, calculate, and track carbon emissions annually. These services help with the complexity of carbon accounting, deliver digital tools, and offer a comprehensive view of carbon emissions through inventory management plans.
For instance, in December 2021, Fujitsu Limited and Ridgelinez Limited announced new services that support the customers in the Japanese market to bring their carbon emissions to zero and achieve carbon neutrality. These consulting services offered by Ridgelinez help the clients to measure and visualise carbon emissions in their supply chains.


The growing awareness about the detrimental effects of carbon emissions is leading to the rising adoption of carbon footprint management by small and mid-size manufacturing companies. These solutions and services are used to analyse and visualise the emissions throughout the supply chain from procurement of raw materials to disposal or recycling of the materials, further helping measure the carbon footprint of the individual products. This helps the manufacturing sector to achieve carbon neutrality through integrated cloud applications and reduction measures.
The stringent government regulations, such as the setting of heavy-duty GHG regulations to reduce carbon emissions in the transportation sector, are resulting in the increased demand for carbon footprint management. These solutions help vehicle owners know the carbon footprint of all types of vehicles, such as petrol, hybrid, and electric, to help them reduce their impact on the environment, which is expected to support the carbon footprint management market development. Moreover, they offer suggestions to reduce the carbon footprint, such as turning off the engine when not needed, changing the oil, switching off the air conditioning, and others.
The surge in eco-consciousness among the refiners is resulting in the need to lower the carbon intensity by reducing emissions on a per barrel of refined crude basis. Thus, the emerging need for net-zero emissions in oil refineries is leading to the growing need to calculate carbon footprint, thus resulting in the demand for carbon footprint management solutions or services.
The market players are developing innovative solutions using technologies to reduce carbon emissions from buildings by helping owners optimise energy use. In June 2023, Honeywell Building Technologies introduced its cloud-based carbon and energy management software with data, analytics, and Internet of Things (IoT) capabilities to enable buildings to reduce carbon emissions and achieve sustainability. The software calculates the carbon data from emission sources, such as gas, electricity, and fuel source and also offers a roadmap for carbon neutrality.
The report gives a detailed analysis of the following key players in the market, covering their competitive landscape and latest developments like mergers, acquisitions, investments, and expansion plans.
Engie is a France-based utility company that delivers services in renewable energy and storage. The company intends to accelerate the transition to net zero carbon by promoting low carbon infrastructure and reducing energy consumption.
IBM Corporation or International Business Machines Corporation is a United States-based company that offers real-world solutions and insights to help the organisations become more sustainable.
Carbon Footprint Ltd provides solutions to cut carbon footprint by calculating the emissions, helping reduce energy costs, meet regulatory standards, and improve the products or services through approved carbon offsetting.
*Please note that this is only a partial list; the complete list of key players is available in the full report. Additionally, the list of key players can be customized to better suit your needs.*
Other carbon footprint management market players include Schneider Electric, Salesforce Inc., Sphera, Isometrix, Accuvi, Dakota Software, and SAP SE, among others.
Upto 15% Off
USD
$2499 $2249
$3999 $3599
$4999 $4249
$5999 $5099


*While we strive to always give you current and accurate information, the numbers depicted on the website are indicative and may differ from the actual numbers in the main report. At Expert Market Research, we aim to bring you the latest insights and trends in the market. Using our analyses and forecasts, stakeholders can understand the market dynamics, navigate challenges, and capitalize on opportunities to make data-driven strategic decisions.*
In 2025, the market attained a value of nearly USD 10.99 Billion.
The market is estimated to witness a healthy growth in the forecast period of 2026-2035 to reach almost USD 20.25 Billion by 2035.
The major market drivers include increasing use by organisations to save costs and meet regulatory standards, escalating eco-consciousness, and initiatives taken by the market players to develop efficient solutions and deliver superior services.
The key market trends guiding the growth of the market include the stringent government regulations towards lowering the carbon emissions and technological developments in the carbon footprint management solutions and services.
The significant components of carbon footprint management are solution and services (consulting, integration & deployment, support & maintenance).
The market is assessed to grow at a CAGR of 6.30% between 2026 and 2035.
The various end users of carbon footprint management system are refineries, manufacturing, utilities, and transportation, among others.
The different lifetimes are material production, consumption, and end-of-life.
The major players in the carbon footprint management market are Schneider Electric, Salesforce Inc., Sphera, Engie, Carbon Footprint Ltd, IBM Corporation, Isometrix, Accuvi, Dakota Software, and SAP SE, among others.
Explore our key highlights of the report and gain a concise overview of key findings, trends, and actionable insights that will empower your strategic decisions.
| REPORT FEATURES | DETAILS |
| Base Year | 2025 |
| Historical Period | 2019-2025 |
| Forecast Period | 2026-2035 |
| Scope of the Report |
Historical and Forecast Trends, Industry Drivers and Constraints, Historical and Forecast Market Analysis by Segment:
|
| Breakup by Component |
|
| Breakup by End-User |
|
| Breakup by Lifetime |
|
| Breakup by Region |
|
| Market Dynamics |
|
| Competitive Landscape |
|
| Companies Covered |
|
Datasheet
One User
USD 2,499
USD 2,249
tax inclusive*
Single User License
One User
USD 3,999
USD 3,599
tax inclusive*
Five User License
Five User
USD 4,999
USD 4,249
tax inclusive*
Corporate License
Unlimited Users
USD 5,999
USD 5,099
tax inclusive*
*Please note that the prices mentioned below are starting prices for each bundle type. Kindly contact our team for further details.*
Flash Bundle
Small Business Bundle
Growth Bundle
Enterprise Bundle
*Please note that the prices mentioned below are starting prices for each bundle type. Kindly contact our team for further details.*
Flash Bundle
Number of Reports: 3
20%
tax inclusive*
Small Business Bundle
Number of Reports: 5
25%
tax inclusive*
Growth Bundle
Number of Reports: 8
30%
tax inclusive*
Enterprise Bundle
Number of Reports: 10
35%
tax inclusive*
How To Order

Select License Type
Choose the right license for your needs and access rights.

Click on ‘Buy Now’
Add the report to your cart with one click and proceed to register.

Select Mode of Payment
Choose a payment option for a secure checkout. You will be redirected accordingly.
Strategic Solutions for Informed Decision-Making
Gain insights to stay ahead and seize opportunities.

Get insights & trends for a competitive edge.

Track prices with detailed trend reports.

Analyse trade data for supply chain insights.

Leverage cost reports for smart savings

Enhance supply chain with partnerships.

Connect For More Information
Our expert team of analysts will offer full support and resolve any queries regarding the report, before and after the purchase.
Our expert team of analysts will offer full support and resolve any queries regarding the report, before and after the purchase.
We employ meticulous research methods, blending advanced analytics and expert insights to deliver accurate, actionable industry intelligence, staying ahead of competitors.
Our skilled analysts offer unparalleled competitive advantage with detailed insights on current and emerging markets, ensuring your strategic edge.
We offer an in-depth yet simplified presentation of industry insights and analysis to meet your specific requirements effectively.


