


Consumer Insights
Uncover trends and behaviors shaping consumer choices today
Procurement Insights
Optimize your sourcing strategy with key market data
Industry Stats
Stay ahead with the latest trends and market analysis.
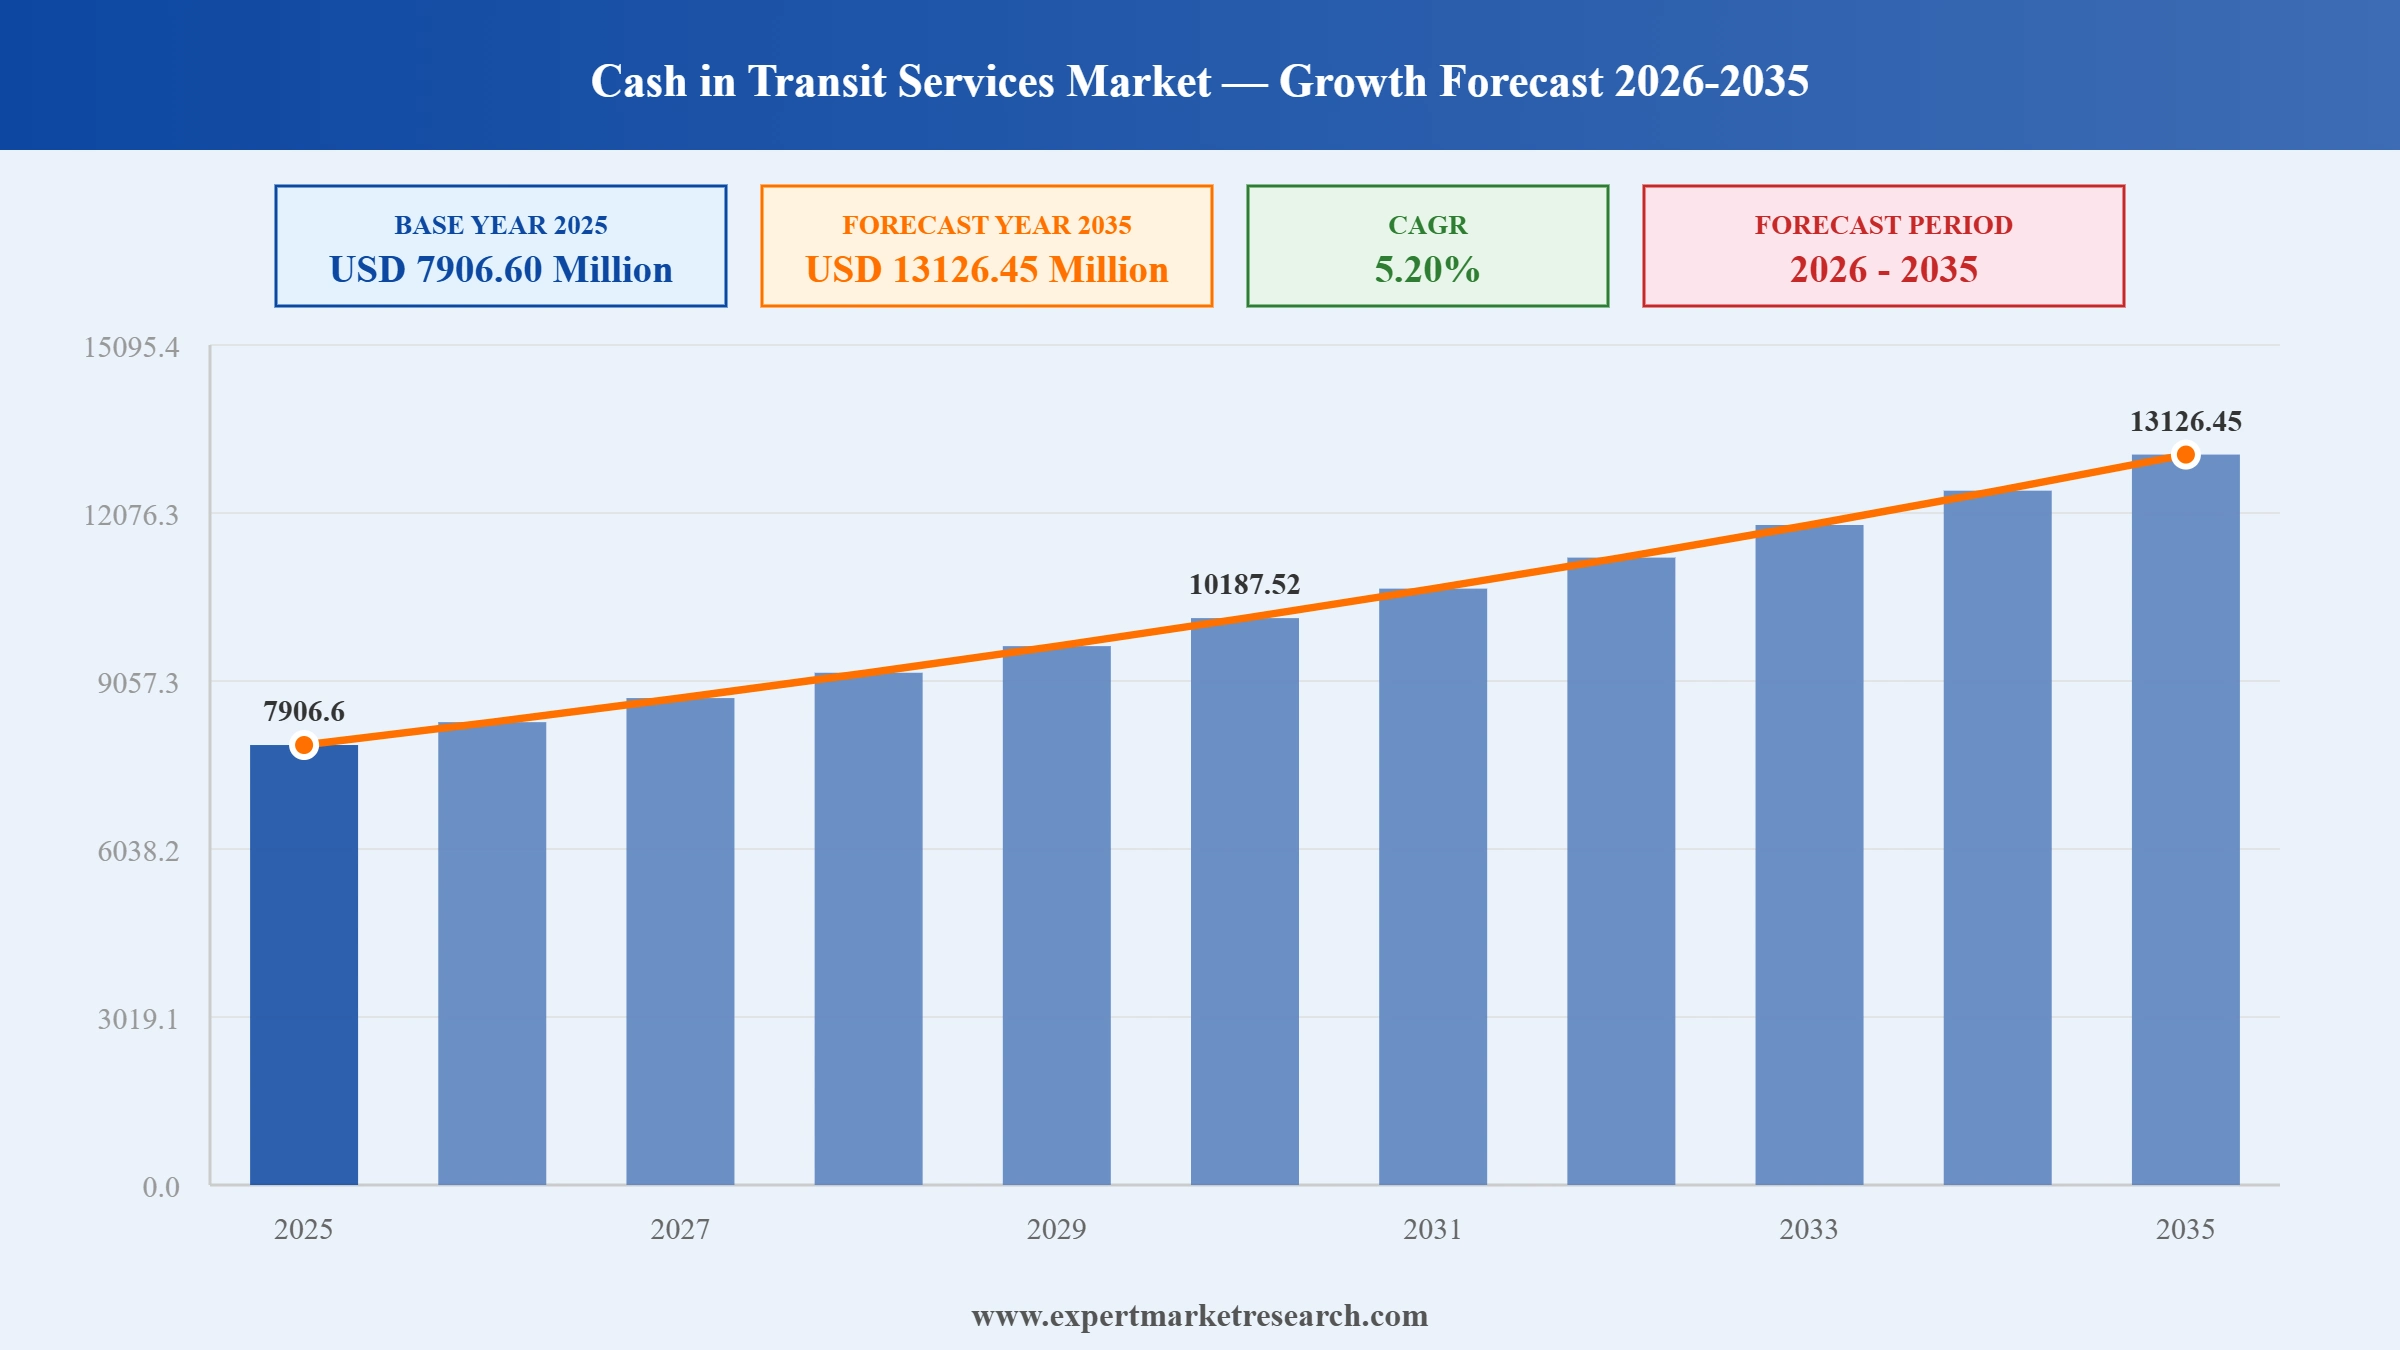
The Global Cash in Transit Services Market reached a value of USD 7906.60 Million at 2025 and is projected to expand at a CAGR of around 5.20% during the forecast period of 2026-2035. With sustained cash usage in many economies, expansion of ATM managed services, growing retailer outsourcing, and rising adoption of smart safes and electric armored vehicles, the market is expected to reach USD 13126.45 Million by 2035.
Read more about this report - REQUEST FREE SAMPLE COPY IN PDF
| Global Cash in Transit Services Market Report Summary | Description | Value |
| Base Year | USD Million | 2025 |
| Historical Period | USD Million | 2019-2025 |
| Forecast Period | USD Million | 2026-2035 |
| Market Size 2025 | USD Million | 7906.60 |
| Market Size 2035 | USD Million | 13126.45 |
| CAGR 2019-2025 | Percentage | XX% |
| CAGR 2026-2035 | Percentage | 5.20% |
| CAGR 2026-2035 - Market by Region | Asia Pacific | 5.3% |
| CAGR 2026-2035 - Market by Country | India | 6.0% |
| CAGR 2026-2035 - Market by Country | Mexico | 5.7% |
| CAGR 2026-2035 - Market by End Use | Commercial Banks | 5.3% |
| Market Share by Country 2025 | USA | 24.9% |
The Global Cash in Transit Services market growth is being shaped by ATM managed services expansion, geographic consolidation, fleet electrification, and the integration of digital retail and smart-safe technologies into traditional armored transport.
The Brink's Company announced a strategic investment in KAL ATM Software, a global leader in hardware-independent ATM software, to deepen its ATM Managed Services portfolio for financial institutions worldwide. The investment supports a more flexible, multi-vendor architecture in which banks can mix hardware while standardising on a single software stack managed by Brink's. The move underscores the strategic shift among large cash-in-transit providers from pure transportation to integrated cash-ecosystem optimisation, including Digital Retail Solutions and AI-enabled forecasting for route and inventory planning.
The Brink's Company entered a strategic joint venture with Meedaf, an Abu Dhabi Global Market-licensed entity launched earlier in April 2025, to serve financial institutions across the Gulf Cooperation Council. The Brink's-Meedaf alliance targets transformation of the United Arab Emirates' cash management and ATM managed services landscape, combining Brink's global operating model with Meedaf's local financial-sector relationships. The partnership reflects accelerating regional bank consolidation, growing ATM outsourcing in the GCC, and the desire to standardise cash logistics across multi-country footprints in the Middle East.
Loomis completed the acquisition of Burroughs, a United States provider of payment device maintenance and servicing, on June 1, 2025, deepening Loomis's hybrid physical and digital cash ecosystem in North America. The deal supports Loomis's strategy to broaden beyond traditional armored transport into ATM and self-service device maintenance, smart safes, and integrated cash recycling. Combined with a partnership with Castles Technology in Android-based POS, the Burroughs acquisition reinforces Loomis's positioning around comprehensive cash and payment infrastructure services for retail and financial-institution customers in the United States.
Prosegur Cash unveiled Spain's first fully electric armored vehicle in collaboration with the Polytechnic University of Madrid and TSD, aiming to reduce greenhouse gas emissions across cash collection routes and showcase a sustainable model for urban cash logistics. The pilot vehicle will operate in Madrid, with route data feeding ongoing engineering refinements before broader European deployment. The launch reflects rising regulatory and customer pressure on cash-in-transit operators to decarbonise fleets, particularly in low-emission urban zones across Spain, France, the United Kingdom, and the Nordics.
The merger of Linfox Armaguard and Prosegur Australia received conditional regulatory approval in 2025 from the Australian Competition and Consumer Commission, consolidating the country's two largest cash-in-transit operators into a single national network. The combined entity is expected to preserve route density and ensure cash availability across regional and remote communities as cash use declines. The conditions imposed by regulators target service-level commitments, fair-access pricing for smaller banks and retailers, and ongoing consultation with the Reserve Bank of Australia to support resilient national cash distribution.
Cash-in-transit majors are transforming into ATM managed-services providers, taking ownership of fleets, software, and end-to-end uptime to capture recurring revenue from banks and large retailers. Hardware-independent ATM software, AI forecasting, and IoT-linked devices are central to this shift. In June 2025, Brink's announced a strategic investment in KAL ATM Software to enable multi-vendor ATM operations for financial institutions worldwide, supporting Brink's broader Digital Retail Solutions strategy and underpinning Cash in Transit Services market growth as banks accelerate ATM outsourcing.
Cross-border alliances and joint ventures are reshaping cash management across emerging and high-growth regions, particularly the Gulf Cooperation Council, where bank consolidation, growing ATM networks, and tourism-driven cash usage are increasing complexity. In June 2025, Brink's announced a joint venture with Meedaf, an ADGM-licensed entity launched earlier in 2025, to revolutionise cash and ATM operations across the United Arab Emirates and the wider GCC. The deal underscores how global cash-in-transit leaders are using local partnerships to scale faster while sharing regulatory and political risk.
Cash-in-transit operators are piloting and scaling electric armored vehicles to comply with low-emission urban zones, customer ESG mandates, and corporate net-zero targets. Electrification programmes also reduce fuel costs over the long run and improve route reliability in stop-start urban duty cycles. In March 2025, Prosegur Cash launched Spain's first fully electric armored vehicle in partnership with the Polytechnic University of Madrid and TSD, signalling a structural shift in fleet strategy across European CIT operators that are increasingly tying capital expenditure to decarbonisation roadmaps.
Cash-in-transit operators are consolidating at the national level to defend route density as cash transactions decline in some segments while remaining resilient in others. Mergers concentrate fixed-cost networks, branch and ATM relationships, and cross-skilled drivers across larger footprints. In 2025, the Australian Competition and Consumer Commission granted conditional approval for the merger of Linfox Armaguard and Prosegur Australia, creating a single national CIT operator with conditions on service levels, regional access, and consultation with the Reserve Bank of Australia to safeguard nationwide cash distribution.
The Expert Market Research’s report titled “Global Cash in Transit Services Market Report and Forecast 2026-2035” offers a detailed analysis of the market based on the following segments:
Market Breakup by End Use
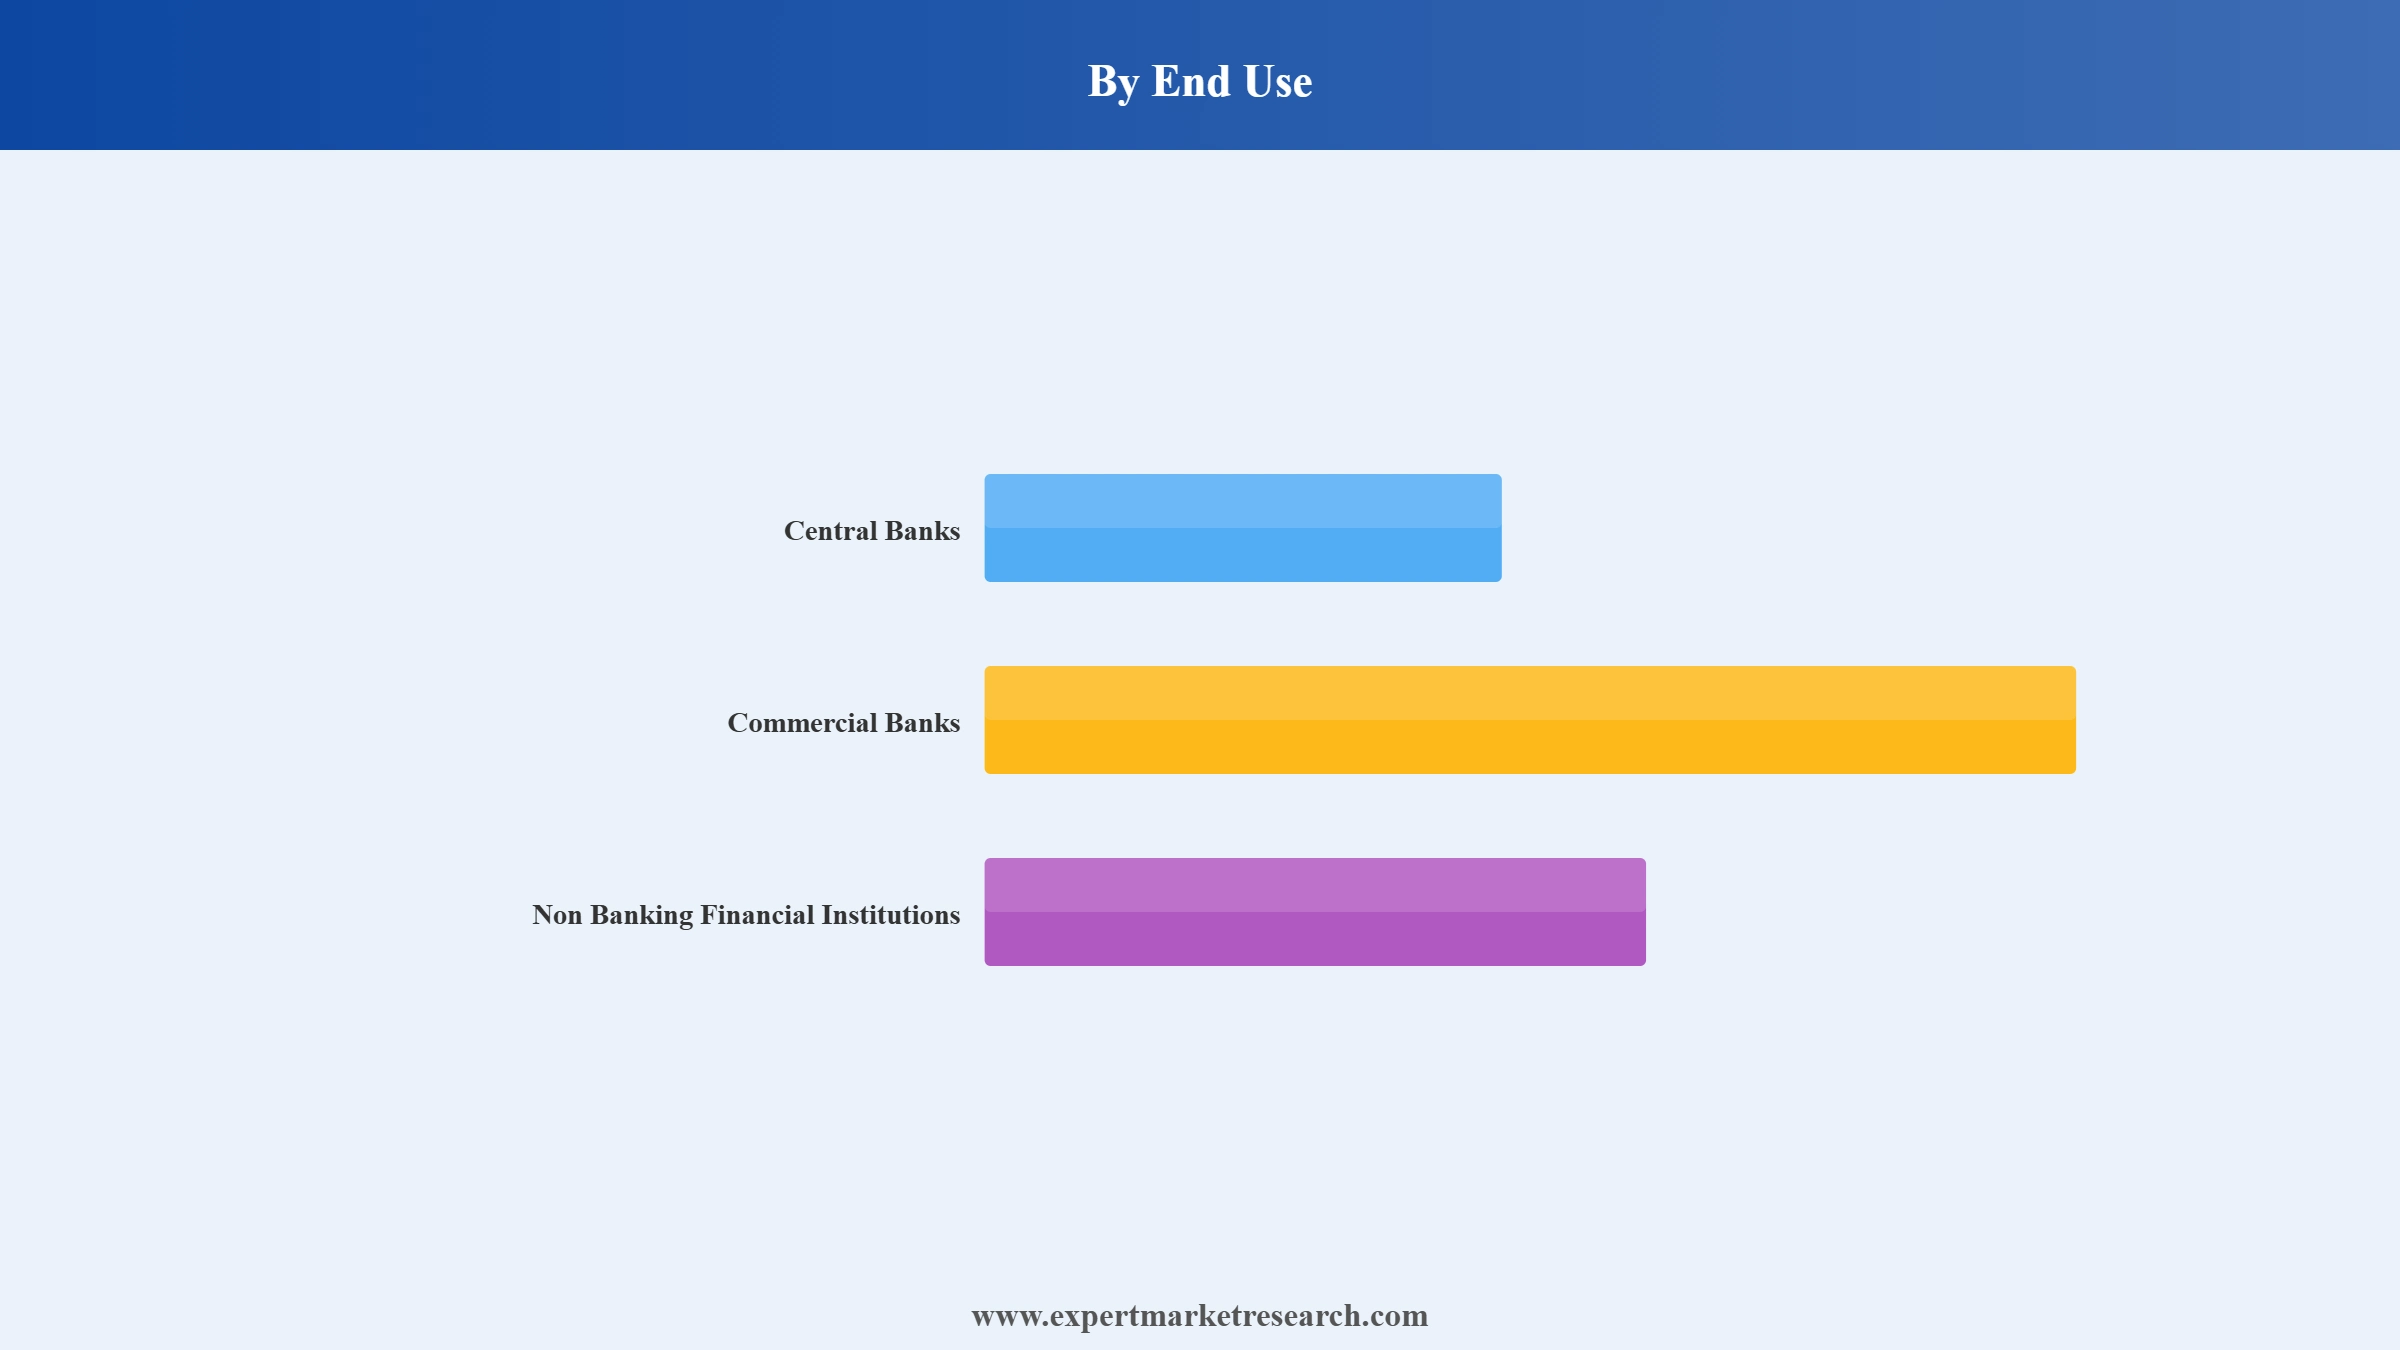
Key Insight: Commercial Banks form the largest end-use segment, supported by extensive ATM networks, branch cash logistics, and high-volume vault operations across the United States, Western Europe, India, and Southeast Asia. ATM managed services contracts, exemplified by Brink's investment in KAL ATM Software in June 2025 and the Brink's-Sainsbury's UK partnership, are expanding the share of revenue derived from this segment. Central banks remain critical anchor customers, contracting CIT providers for inter-branch and inter-bank cash distribution, while Non Banking Financial Institutions, including microfinance, retail, and fintech players, are emerging as fast-growing buyers, particularly in India, Africa, and Latin America.
Market Breakup by Region
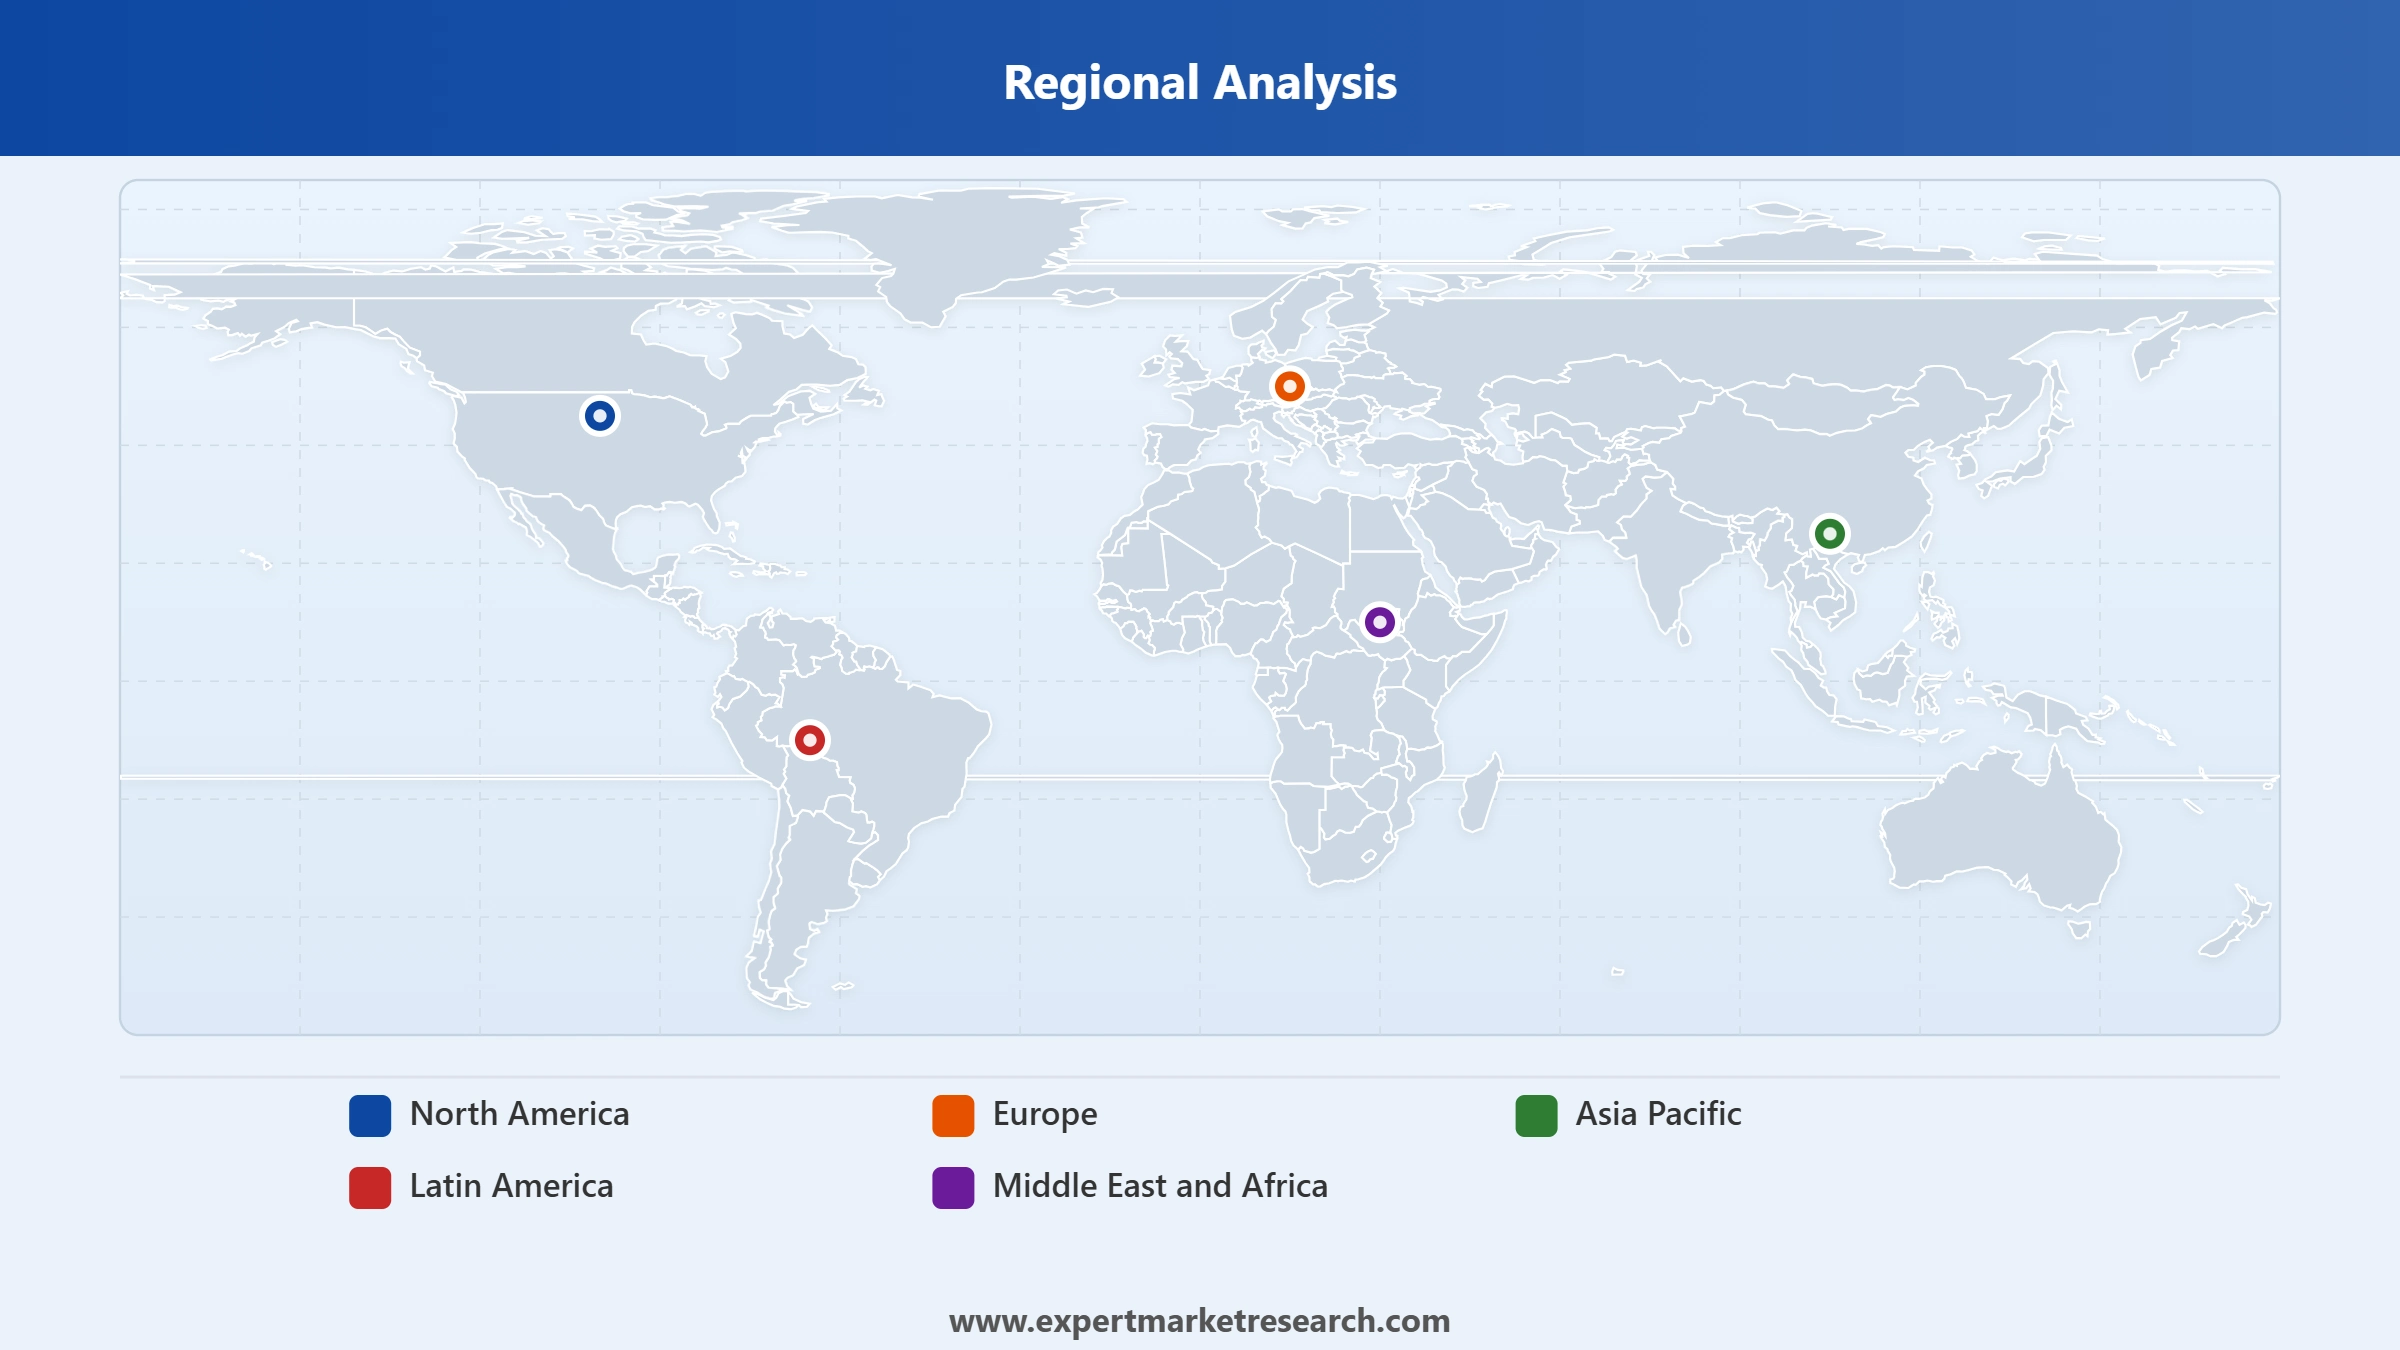
Key Insight: North America is the largest regional market, supported by mature commercial banking, dense ATM networks, and high outsourcing penetration among retail and financial customers. Europe is a sophisticated market with a strong consolidation trend, exemplified by ongoing fleet electrification investments by Prosegur and Loomis. Asia Pacific is the fastest-growing region, driven by India's expanding ATM and retail networks, Australia's market consolidation, and rising cash usage in Southeast Asia. The Middle East and Africa region is being reshaped by alliances such as Brink's-Meedaf, while Latin America benefits from Prosegur's strong incumbent footprint and growing demand for secure cash logistics.


Read more about this report - REQUEST FREE SAMPLE COPY IN PDF
Market by End Use: Commercial Banks dominate the cash-in-transit services share, accounting for the largest portion of revenue thanks to their ownership of vast ATM networks, branch cash flows, and back-office reconciliation needs. The dominance is reinforced by the trend toward outsourcing core cash management functions to specialised providers, with banks such as Sainsbury's Bank in the United Kingdom transferring entire ATM estates to Brink's NoteMachine in 2024 and 2025. Non Banking Financial Institutions are emerging as a fast-growing sub-segment, driven by retail giants, microfinance lenders, and fintech players who require integrated smart safe and cash-recycling solutions. Central banks remain critical anchor clients, particularly in emerging markets where currency distribution is centralised.
Read more about this report - REQUEST FREE SAMPLE COPY IN PDF
North America: North America is the dominant region in the global cash-in-transit services market, anchored by the United States and Canada. Mature commercial banking, federal agency requirements, and large retail networks underpin demand for armored transport, vault management, ATM servicing, and cash-recycling solutions. Brink's, Loomis, and GardaWorld are the principal players, supported by significant investments in ATM managed services and digital retail solutions. Loomis's June 2025 acquisition of Burroughs and Brink's reported strong organic growth in ATM Managed Services and Digital Retail Solutions reflect the region's strategic shift from pure transport to integrated cash and payments servicing. Strict regulatory frameworks, mature insurance markets, and high labour costs continue to favour large, scaled CIT providers across the region.
Read more about this report - REQUEST FREE SAMPLE COPY IN PDF
Asia Pacific: Asia Pacific is the fastest-growing region in the global cash-in-transit services market, driven by India, Southeast Asia, China, Japan, and Australia. India's expanding ATM networks, retail outsourcing trends, and the rapid growth of microfinance and fintech sectors are creating broad demand for CIT operators such as Radiant Cash Management Services and CMS Info Systems. Australia's market is undergoing structural consolidation following the conditional approval of the Armaguard-Prosegur merger in 2025, designed to safeguard route density and nationwide cash distribution. Southeast Asian markets such as Indonesia, the Philippines, and Vietnam continue to exhibit resilient cash usage, supporting demand for armored transport, smart safes, and currency processing services across both banking and retail clients.
The global cash-in-transit services market is highly consolidated at the top, with Brink's, Loomis, GardaWorld, and Prosegur jointly controlling the majority of global revenue. Allied Universal, Linfox Armaguard, and Radiant Cash Management Services hold strong national positions, while smaller players support specialised verticals such as fintech, retail microfinance, and high-value precious-metal logistics.
Competitive priorities now centre on ATM managed services, integrated cash-ecosystem solutions, and fleet electrification. Major operators are deploying AI-enabled forecasting, smart safes, and IoT-linked ATMs to shift from pure transportation toward end-to-end cash optimisation services. Strategic acquisitions, joint ventures such as Brink's-Meedaf, and merger consolidation, illustrated by the Armaguard-Prosegur deal in Australia, are reshaping route density, customer relationships, and regulatory engagement across mature and emerging cash markets globally.
Founded in 1859 and headquartered in Richmond, Virginia, The Brink's Company is the world's largest cash-management and CIT provider, operating across more than one hundred countries. Its capabilities span armored transport, ATM managed services, vaulting, cash recycling, and Digital Retail Solutions. Brink's strategic investments in KAL ATM Software and joint ventures such as Brink's-Meedaf in the UAE underline its push into integrated cash and payments servicing for global financial institutions and large retailers.
Founded in 1925 with origins in Securitas's cash-handling business and headquartered in Stockholm, Loomis AB is one of the world's leading cash-management providers. It operates in more than twenty countries with strong positions in the United States, the United Kingdom, and the Nordics. Capabilities include armored transport, ATM servicing, smart safes, cash recycling, and payment device maintenance. The 2025 acquisition of Burroughs deepens Loomis's hybrid physical and digital cash ecosystem across North America.
Founded in 1995 and headquartered in Montreal, GardaWorld Corporation is one of the largest privately held security and cash services companies globally. Its portfolio spans armored transport, ATM services, secure logistics, and security operations across North America, Europe, the Middle East, and Africa. GardaWorld's Sesami arm focuses on cash automation technology, having acquired Tidel and Gunnebo's cash automation assets, broadening the company's reach in smart safes and integrated cash ecosystems for retail and financial customers worldwide.
Founded in 1976 and headquartered in Madrid, Prosegur Group is a leading global security and cash services provider with strong positions across Europe, Latin America, and Asia. Its Prosegur Cash subsidiary delivers armored transport, ATM management, vaulting, and cash automation services. Prosegur is a pioneer in fleet electrification, launching Spain's first electric armored vehicle in March 2025, and is part of major regional consolidation events such as the Armaguard-Prosegur merger in Australia.
Other key players in the market are Allied Universal, Linfox Armaguard Pty Ltd., Radiant Cash Management Services Limited, and Others.
*Please note that this is only a partial list; the complete list of key players is available in the full report. Additionally, the list of key players can be customized to better suit your needs.*
Discover the latest insights on the Global Cash in Transit Services Market 2026 with our comprehensive report. Stay ahead of the curve with valuable data on ATM managed services growth, fleet electrification, and high-growth regional markets. Whether you are a bank evaluating outsourcing options, a CIT operator planning expansion, or an investor assessing M&A opportunities, this report gives you the clarity you need. Download your free sample now and discover the key opportunities in the thriving Global Cash in Transit Services industry.
Nigeria Cash in Transit Services Market
Armored Vehicle Fleet Modernisation
Cash Logistics Software Market
Upto 15% Off
USD
$2499 $2249
$3999 $3599
$4999 $4249
$5999 $5099


*While we strive to always give you current and accurate information, the numbers depicted on the website are indicative and may differ from the actual numbers in the main report. At Expert Market Research, we aim to bring you the latest insights and trends in the market. Using our analyses and forecasts, stakeholders can understand the market dynamics, navigate challenges, and capitalize on opportunities to make data-driven strategic decisions.*
In 2025, the cash in transit services market reached an approximate value of USD 7906.60 Million.
The market is projected to grow at a CAGR of 5.20% between 2026 and 2035.
The market is estimated to witness healthy growth in the forecast period of 2026-2035 to reach a value of around USD 13126.45 Million by 2035.
Diversifying services, investing in telematics and green fleets, partnering with fintechs, automating reconciliation, upskilling staff, and negotiating longer SLAs are strengthening resilience and optimizing route economics for sustained competitive advantage.
The strict regulations for cash movement from one location to another by banks and rising crime rates are expected to be key trends guiding the growth of the market.
North America, Europe, the Asia Pacific, Latin America, and the Middle East and Africa are the leading regions in the market.
The leading end uses for the market are Central Banks, Commercial Banks, and Non Banking Financial Institutions, among others.
The key players in the market include The Brink's Company, Allied Universal, Loomis AB, GardaWorld Corporation, Prosegur Group, Linfox Armaguard Pty Ltd., and Radiant Cash Management Services Limited, among others.
The market is projected to grow at a CAGR of 5.20% between 2026 and 2035.
Rising operational costs, armed robberies, regulatory compliance variability, driver shortages, and integrating legacy systems with new tech are constraining margins and service reliability for CIT firms globally and insurance premiums.
Explore our key highlights of the report and gain a concise overview of key findings, trends, and actionable insights that will empower your strategic decisions.
| REPORT FEATURES | DETAILS |
| Base Year | 2025 |
| Historical Period | 2019-2025 |
| Forecast Period | 2026-2035 |
| Scope of the Report |
Historical and Forecast Trends, Industry Drivers and Constraints, Historical and Forecast Market Analysis by Segment:
|
| Breakup by End Use |
|
| Breakup by Region |
|
| Market Dynamics |
|
| Competitive Landscape |
|
| Companies Covered |
|
| Report Price and Purchase Option | Explore our purchase options that are best suited to your resources and industry needs. |
| Delivery Format | Delivered as an attached PDF and Excel through email, with an option of receiving an editable PPT, according to the purchase option. |
Datasheet
One User
USD 2,499
USD 2,249
tax inclusive*
Single User License
One User
USD 3,999
USD 3,599
tax inclusive*
Five User License
Five User
USD 4,999
USD 4,249
tax inclusive*
Corporate License
Unlimited Users
USD 5,999
USD 5,099
tax inclusive*
*Please note that the prices mentioned below are starting prices for each bundle type. Kindly contact our team for further details.*
Flash Bundle
Small Business Bundle
Growth Bundle
Enterprise Bundle
*Please note that the prices mentioned below are starting prices for each bundle type. Kindly contact our team for further details.*
Flash Bundle
Number of Reports: 3
20%
tax inclusive*
Small Business Bundle
Number of Reports: 5
25%
tax inclusive*
Growth Bundle
Number of Reports: 8
30%
tax inclusive*
Enterprise Bundle
Number of Reports: 10
35%
tax inclusive*
How To Order

Select License Type
Choose the right license for your needs and access rights.

Click on ‘Buy Now’
Add the report to your cart with one click and proceed to register.

Select Mode of Payment
Choose a payment option for a secure checkout. You will be redirected accordingly.
Strategic Solutions for Informed Decision-Making
Gain insights to stay ahead and seize opportunities.

Get insights & trends for a competitive edge.

Track prices with detailed trend reports.

Analyse trade data for supply chain insights.

Leverage cost reports for smart savings

Enhance supply chain with partnerships.

Connect For More Information
Our expert team of analysts will offer full support and resolve any queries regarding the report, before and after the purchase.
Our expert team of analysts will offer full support and resolve any queries regarding the report, before and after the purchase.
We employ meticulous research methods, blending advanced analytics and expert insights to deliver accurate, actionable industry intelligence, staying ahead of competitors.
Our skilled analysts offer unparalleled competitive advantage with detailed insights on current and emerging markets, ensuring your strategic edge.
We offer an in-depth yet simplified presentation of industry insights and analysis to meet your specific requirements effectively.


