

Consumer Insights
Uncover trends and behaviors shaping consumer choices today
Procurement Insights
Optimize your sourcing strategy with key market data
Industry Stats
Stay ahead with the latest trends and market analysis.
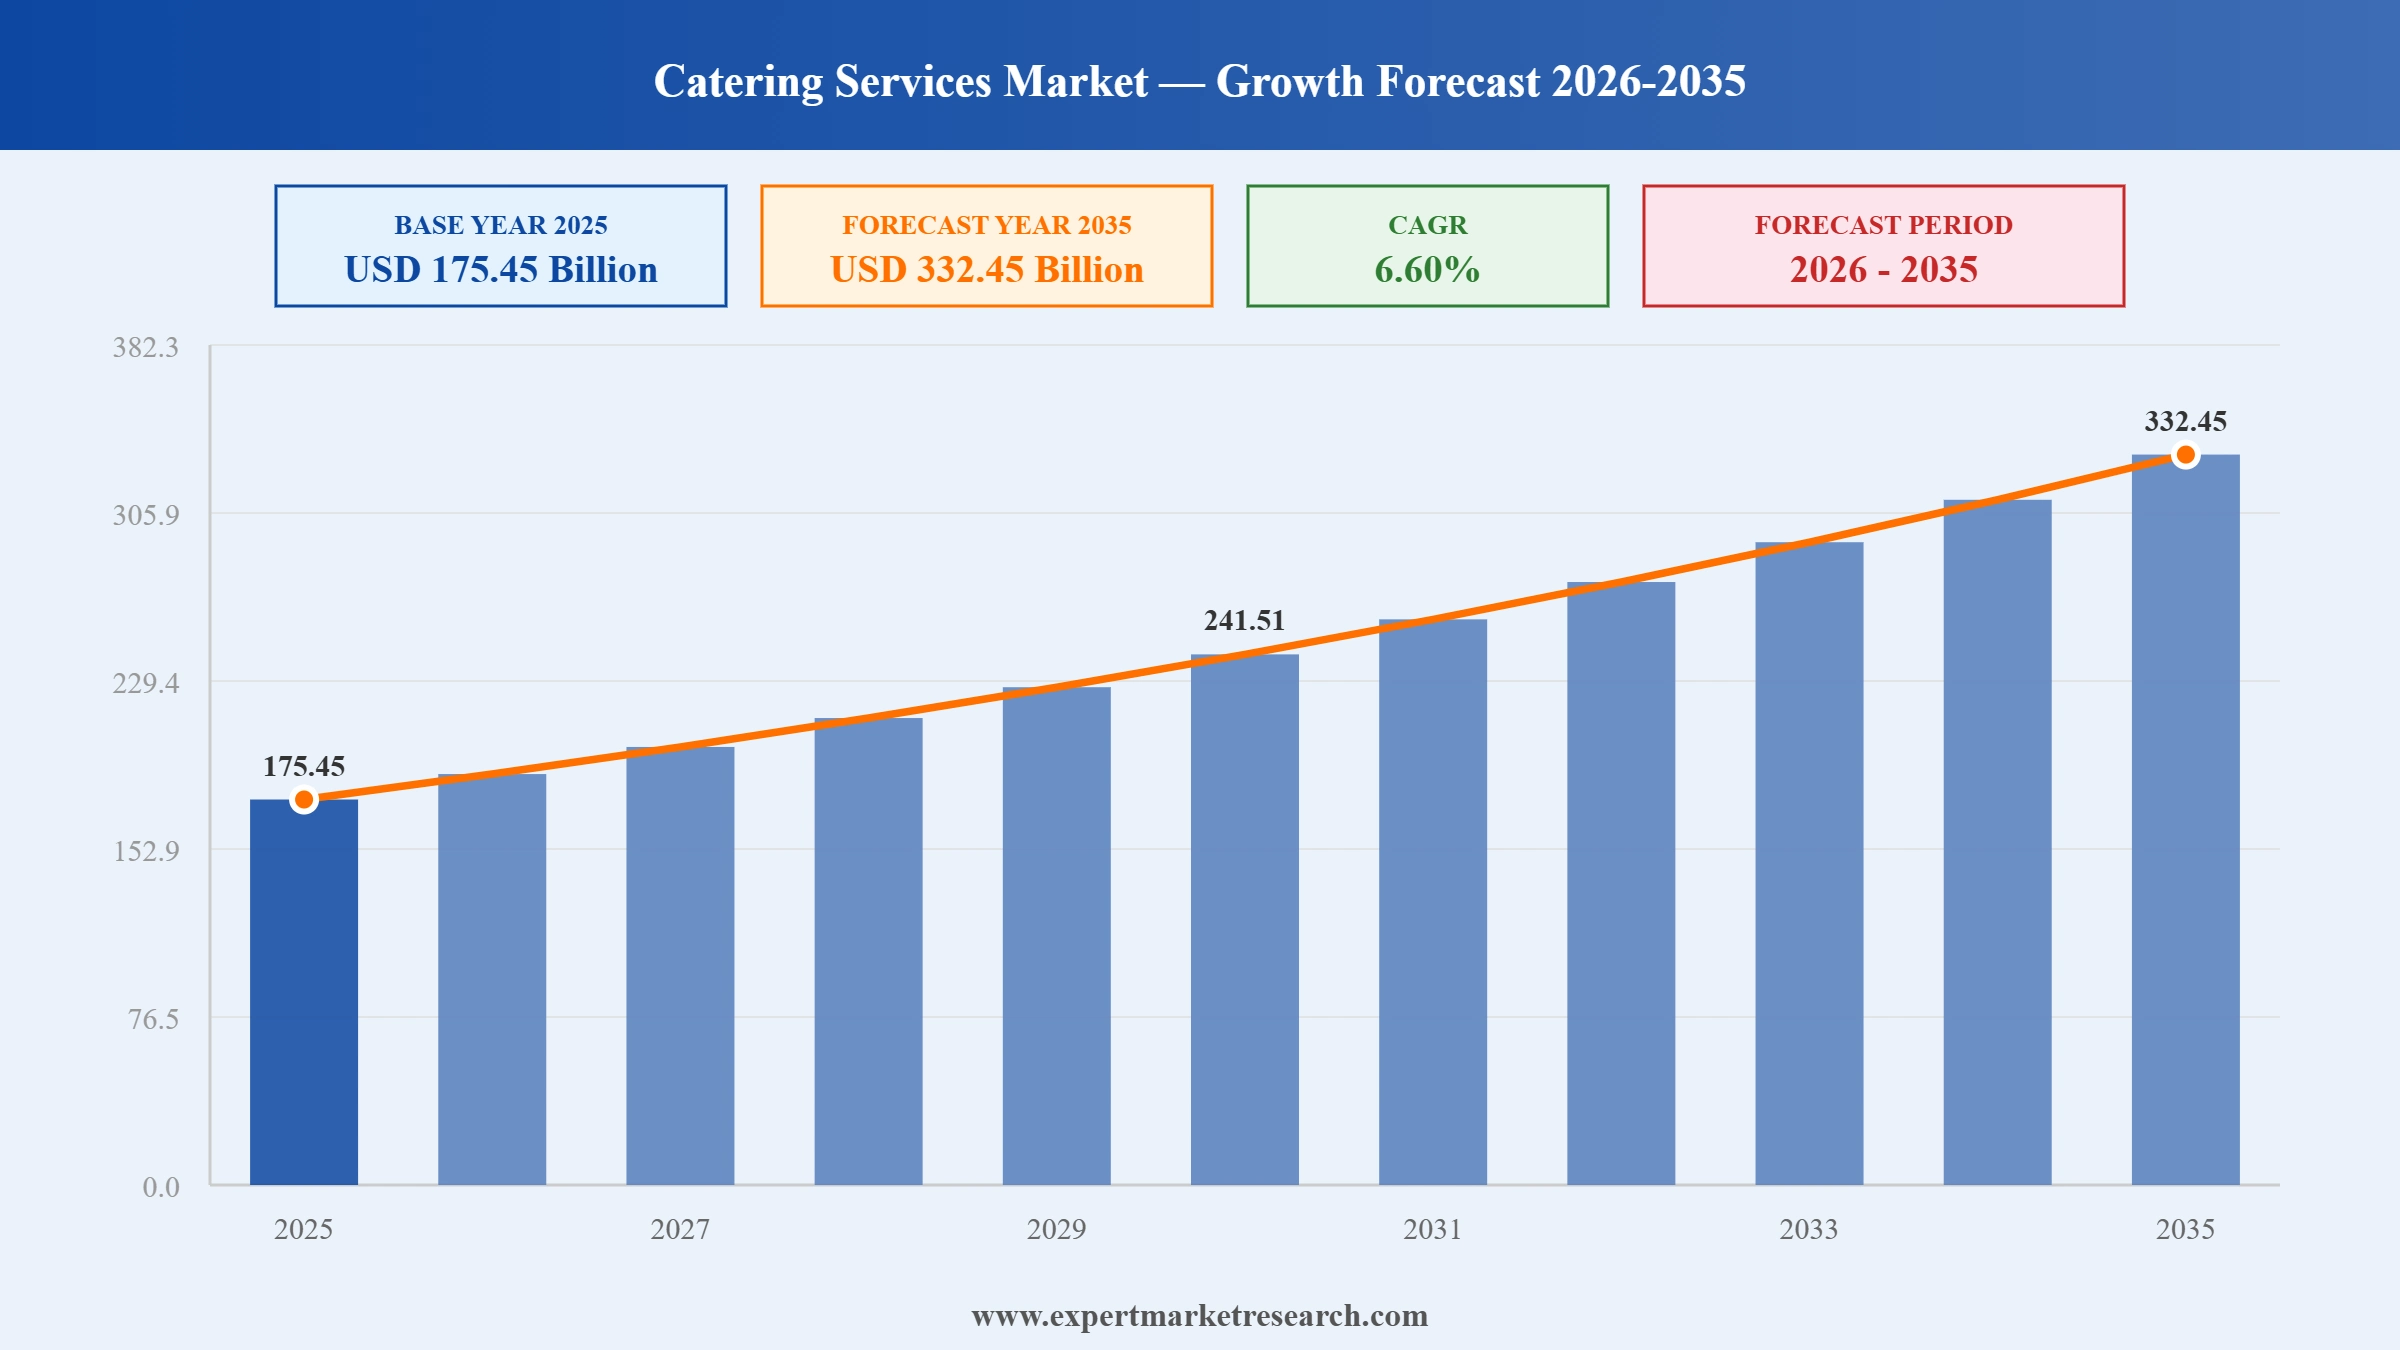
The global catering services market reached a value of USD 175.45 Billion at 2025 and is projected to grow at a compound annual growth rate CAGR of around 6.60% during the forecast period of 2026-2035, reaching USD 332.45 Billion by 2035. This sustained expansion is driven by rising demand for outsourced food service solutions across corporate, healthcare, education, and event sectors, growing consumer expectations for premium dining experiences, expanding foodservice infrastructure in emerging markets, and the accelerating adoption of AI-driven menu planning and sustainable food service practices that enable caterers to deliver higher quality at improved operational efficiency. The global catering services industry serves as a critical enabler across multiple sectors, providing professional food preparation, presentation, and service solutions that allow organisations to focus on their core operations while delegating food service management to specialist providers.
Europe and North America lead the global catering services market, supported by the high presence of global players and specialised service providers, a mature contract catering ecosystem, and strong institutional outsourcing adoption across corporate, healthcare, and educational sectors. The industry has reached high market maturity in Western European countries such as the United Kingdom, France, and Germany, where contract catering is the standard model for large institutions. However, the industry is expected to demonstrate high growth potential in the Middle Eastern regions, India, China, Canada, Japan, Mexico, and Australia, where professional contract catering penetration remains below Western European levels and rapid economic growth is creating expanding institutional food service demand.
Read more about this report - REQUEST FREE SAMPLE COPY IN PDF
The global catering services market is experiencing robust expansion driven by increasing outsourcing of food service operations by corporations, healthcare institutions, educational facilities, and event organisers seeking quality, efficiency, and cost management benefits. Leading contract catering companies are accelerating growth through strategic acquisitions, geographic expansion into high-growth markets across Asia Pacific and the Middle East, and technology-enabled service delivery improvements. Consumer preference shifts toward premium, sustainable, and personalised dining experiences are also reshaping service offering development across all catering market segments.
Compass Group plc announced the acquisition of iLUKA Collective, a specialist provider of premium luxury hospitality and venue catering services, in February 2026. The acquisition expands Compass Group's capabilities in the high-margin luxury venue and events catering segment, adding premium service expertise, distinctive brand positioning, and a portfolio of prestigious venue partnerships. The deal reflects Compass Group's strategy to capture growth in the premium end of the event and hospitality catering market, complementing its broad contract catering operations across corporate, healthcare, and education sectors.
Compass Group plc reported revenue growth of 7.3% in Q1 2026, reflecting the successful integration of Vermaat Group, the premium Dutch food service operator acquired for GBP 1.3 billion in July 2025. The strong quarterly performance demonstrated the strategic value of the Vermaat acquisition in expanding Compass Group's European premium catering footprint and diversifying its geographic revenue base. The results confirmed the company's continued momentum as the world's largest contract catering group, with organic growth supplemented by acquisition-driven expansion across key European and global markets.
Elior UK was appointed as the catering partner for the Wildfowl and Wetlands Trust (WWT) London Wetland Centre in February 2026, securing the contract to operate all food and beverage services at one of London's leading urban nature reserves and visitor attractions. The appointment reflects Elior's strategy of building a diversified contract catering portfolio spanning corporate, heritage, leisure, and visitor attraction venues in the United Kingdom. The WWT partnership supports Elior's commitment to sustainability-aligned catering operations, providing menus that reflect the environmental values of its client organisation.
Sodexo S.A. expanded its China operations to more than 950 corporate and healthcare catering sites across major Chinese cities by January 2026, reflecting the sustained demand for professional outsourced catering services from multinational corporations, technology companies, and hospital networks operating in the country. The growth in Sodexo's China footprint underscores Asia Pacific's position as the fastest-growing regional market for contract catering services, driven by corporate workplace food service expansion, healthcare catering outsourcing, and rising standards for professionally managed institutional food service across the region.
Corporate Outsourcing Growth: Multinational corporations globally are accelerating the outsourcing of workplace catering and food service operations to specialist contract providers, driven by the need to reduce overhead costs, improve employee dining quality, and align food service with workplace wellness and sustainability programmes. The growth of hybrid working models has also reshaped corporate catering demand, with operators adapting service delivery to serve variable daily attendance and providing premium food experiences designed to incentivise office attendance among employees with flexible working arrangements.
Healthcare Catering Expansion: The healthcare sector represents one of the most structurally resilient growth segments in the global catering services market, with hospitals, rehabilitation facilities, and aged care operators increasingly outsourcing patient, staff, and visitor catering to specialist contract providers. Ageing populations across developed markets in Europe, North America, and East Asia are expanding the healthcare catering customer base, while rising quality and nutrition standards for patient food service are driving procurement toward professional contract catering operators with clinical dietitian capabilities and regulated kitchen management systems.
Sustainability Integration: Leading catering service providers are embedding sustainability commitments across all service operations, with plant-based menu development, food waste reduction programmes, local sourcing partnerships, and carbon footprint measurement becoming standard competitive differentiators. Corporate clients are increasingly embedding sustainability performance criteria into catering contract evaluation frameworks, requiring providers to demonstrate measurable progress on scope 3 emissions, food waste diversion targets, and ethical supply chain certification in their service delivery model.
Technology and Digitisation: Digital transformation is reshaping the global catering services market as leading operators deploy AI-powered menu planning, predictive demand forecasting, digital ordering applications, and smart kitchen management systems to improve operational efficiency and customer experience. Technology investment enables catering companies to reduce food waste through data-driven production planning, personalise menu offerings based on dietary preferences and nutritional requirements, and streamline payment and loyalty systems for high-frequency corporate and institutional food service environments.
Event and Wedding Catering Recovery: The global catering services market is benefiting from sustained growth in premium event and wedding catering, as consumers prioritise memorable dining experiences for social celebrations following a period of deferred event spending. The trend toward premium, bespoke, and experiential catering concepts is lifting average spend per event and expanding the addressable market for specialist event caterers. International destination weddings, corporate incentive events, and luxury social occasions represent particularly high-value growth opportunities for specialist catering operators with premium service and logistics capabilities.
The catering services market encompasses the professional provision of food and beverage services for events, institutions, and organisations at locations away from the caterer's primary premises. Catering services range from the preparation and delivery of single-event meals for weddings, corporate conferences, and social gatherings, to long-term contractual food service management arrangements for hospitals, schools, universities, corporate campuses, oil and gas facilities, and government institutions. A caterer typically provides comprehensive food service management including menu creation, food procurement, cooking, presentation, and service staff, tailored to the client's preferences, dietary requirements, budget, and venue specifications.
The market is broadly divided into two service types: contractual catering in which a caterer operates under a long-term management agreement with an institution that delegates full food service responsibility and non-contractual catering, which encompasses event-specific engagements typically awarded project-by-project. Applications span corporate catering (employee dining, corporate events, business meetings), wedding and celebration catering, social events catering (parties, galas, fundraisers), healthcare catering (hospitals and care facilities), educational catering (school and university dining), sports and stadium catering, in-flight catering for airlines, and offshore facility catering for energy sector operations.
The strategic decision by corporations, healthcare institutions, educational facilities, and government entities to outsource their food service operations to specialist catering providers rather than managing in-house cafeterias is the most significant structural driver of global catering services market growth. Outsourcing delivers cost predictability, quality specialisation, regulatory compliance management, and access to professional culinary talent that most organisations cannot develop cost-effectively in-house. In Asia Pacific particularly, companies are showcasing premium dining services as a talent attraction and retention benefit, offering customised menus and themed dining experiences at subsidised rates to employees as a means of differentiating their workplace proposition in competitive talent markets across India, China, and Singapore.
Consumer expectations for food quality, dietary customisation, and dining experience sophistication have risen significantly across both corporate and social catering segments. Corporate clients now expect caterers to offer regularly rotating menus featuring locally sourced ingredients, allergen-transparent labelling, culturally diverse cuisine options, and plant-based alternatives that accommodate the dietary preferences of increasingly health-conscious workforces. Social event and wedding catering is experiencing premiumisation as couples and event organisers invest in bespoke menu design, live cooking stations, and immersive food experiences that differentiate their events. The growing integration of themed dining, interactive food presentation, and experiential catering concepts within high-value social events is supporting above-market pricing growth within the premium non-contractual catering segment.
The digitalisation of catering operations encompassing mobile-based ordering platforms, AI-driven menu planning, predictive demand forecasting, and automated inventory management is transforming operational efficiency and consumer engagement across both contractual and non-contractual catering segments. Mobile technology has simplified the customer-caterer transaction by enabling direct digital ordering, real-time menu browsing, allergen filtering, customised meal selection, and seamless payment processing. AI platforms are enabling caterers to predict demand patterns based on historical data, event type, guest profile, and environmental factors, reducing food waste and improving margin management. The growing penetration of mobile payment solutions including Apple Pay, Samsung Pay, and Google Pay has accelerated cashless adoption within institutional catering settings.
The global rise in health consciousness among consumers is compelling caterers to expand their healthy eating offerings, including organic foods, balanced vegan and vegetarian menus, allergen-free options, and fresh, locally sourced produce. Frozen and heavily processed food options are being progressively replaced by freshly prepared items featuring farm-to-fork provenance transparency that resonates with increasingly discerning corporate and social catering clients. Sustainability has simultaneously emerged as a significant competitive differentiator, with leading catering operators committing to single-use plastic elimination, compostable packaging adoption, food waste minimisation through better demand forecasting, and responsible sourcing frameworks that meet the environmental procurement criteria of large institutional clients operating under ESG reporting obligations.
The global recovery and expansion of the events, hospitality, and tourism sectors following the pandemic has driven significant restoration and growth in social catering demand across wedding, corporate event, conference, stadium, and entertainment venue catering segments. The expansion of convention centres, sports stadia, luxury hotels, and corporate campuses in emerging markets across the Middle East, India, Southeast Asia, and Latin America is creating new large-scale catering infrastructure requirements that global and regional catering operators are competing to serve. The FIFA World Cup 2022 in Qatar and ongoing mega-event hosting across the Gulf Cooperation Council has built significant professional events catering infrastructure in the Middle East that is creating a legacy of elevated catering service standards across the region.
Artificial intelligence is being deployed across catering operations for predictive demand forecasting, automated menu rotation, real-time inventory management, and personalised meal recommendation engines. Platforms including CaterAI are enabling caterers to dynamically adjust menu offerings based on guest profiles, event type, historical purchasing patterns, and weather forecasts, reducing food waste by improving supply-demand alignment. Kitchen management systems integrating IoT sensors, temperature monitoring, and automated cooking timers are improving food safety compliance and operational consistency across large-scale institutional catering deployments. Event caterers are using AI to personalise client proposals, automatically generating menu suggestions and pricing packages based on event type, dietary preferences, guest count, and budget parameters.
The catering industry is experiencing a structural shift toward plant-based, allergen-free, and nutritionally transparent menu offerings, driven by the combined pressure of changing consumer dietary preferences, corporate ESG commitments, and regulatory requirements. The FDA's allergen labelling requirements have compelled catering operators to build systematic allergen management processes, with specialist providers including Green Fork Catering and Plantein Events positioning themselves as full-service vegan and allergen-managed catering specialists for corporate and social event clients. Real-time menu translation and allergen alert systems delivered via QR codes and mobile applications are being deployed in event catering settings, improving accessibility and safety for guests with dietary restrictions.
The rapid growth of online catering platforms has created a new channel layer between corporate clients and catering providers, enabling businesses to discover, compare, order, and manage catering services through digital intermediaries. EzCater's evolution from a marketplace to an enterprise workplace food platform following sustained double-digit bookings growth illustrates the structural shift toward digital procurement of corporate catering services. On-demand catering services targeting the corporate lunch and meeting segment are expanding as employers adopt recurring food programmes to incentivise office attendance and support hybrid working arrangements, with 91% of US workplaces planning to maintain or increase catering expenditure.
Sustainability has moved from a differentiating attribute to a baseline expectation among large institutional catering clients, particularly those operating under corporate ESG reporting frameworks. Leading contract catering operators are implementing comprehensive food waste reduction programs combining AI-driven demand forecasting, portion optimisation, surplus food redistribution partnerships with food banks, and compostable packaging as integrated components of their institutional service proposals. Locally sourced ingredients, reduced food miles, seasonal menu design, and carbon footprint labelling on institutional catering menus are becoming standard features of premium contract catering agreements with large corporate and healthcare clients.
Corporate campus dining has evolved from a basic employee welfare function into a strategic human resources tool for talent attraction and retention, particularly across technology, financial services, and professional services companies competing for skilled workforces in tight labour markets. Companies across Asia Pacific and North America are offering customised dining experiences, themed restaurant concepts, healthy meal subsidies, and interactive cooking demonstrations as workplace benefits, with the quality of the corporate dining experience cited by employees as a meaningful factor in workplace satisfaction and employer brand perception. This shift is creating significant expansion in the corporate catering segment, which is growing at the highest application CAGR within the global catering services market.
The global catering services market faces significant operational challenges rooted in food safety compliance complexity, labour market pressures, and rising input cost volatility. Food safety regulations imposed by the FDA, EFSA, and equivalent national authorities across global markets create a continuous compliance burden for catering operators particularly those managing multi-site institutional contracts across different regulatory jurisdictions. Labour shortages across culinary and food service roles intensified by post-pandemic workforce restructuring are driving up wage costs and creating service capacity constraints for catering operators in North America and Europe, where skilled chef and hospitality worker availability has not recovered to pre-pandemic levels despite resumed catering demand. Supply chain disruptions affecting key food commodities, packaging materials, and kitchen equipment have introduced cost volatility and menu planning complexity that compress catering operator margins and complicate fixed-price contract management.
Structural restraints moderate the pace of market expansion in several important dimensions. The seasonal and event-driven nature of a significant share of non-contractual catering demand creates revenue volatility that makes workforce planning, supplier relationship management, and equipment investment difficult to optimise within individual catering businesses. The high capital requirements for large-scale contract catering operations encompassing purpose-built kitchen facilities, food service equipment investment, staff training, and compliance infrastructure create barriers to entry that concentrate market share among large established operators and limit the competitive viability of smaller regional caterers in institutional contract tendering processes. The growing adoption of digital ordering platforms and AI-driven food procurement by corporate clients is increasing price transparency and competitive benchmarking that puts downward pressure on contract catering pricing, compressing margins for operators who have not yet achieved the scale or technological efficiency to compete effectively.
Despite these structural challenges, the global catering services market presents compelling and expanding growth opportunities throughout the forecast period. Asia Pacific represents the highest-growth regional opportunity, driven by the adoption of corporate campus dining as a talent retention strategy, rapid growth in the healthcare catering segment as private hospital infrastructure expands, and increasing middle-class consumer spending on premium event catering across China, India, Indonesia, and Vietnam.The Middle East and particularly the GCC offers a distinctive growth vector supported by Vision 2030 and related economic diversification programs that are driving significant corporate, hospitality, and events catering infrastructure investment across Saudi Arabia, UAE, Qatar, and Oman. Online catering platforms connecting corporate clients with a curated network of catering providers represent a structural growth channel that is expanding the addressable market for smaller specialist caterers by reducing client acquisition costs and improving discovery. The full Expert Market Research Catering Services Market Report and Forecast 2026-2035 provides granular analysis across service type, services model, application, and regional market to equip catering operators, investors, institutional procurement teams, and strategic planners with the intelligence to capitalise on the most valuable growth vectors in this large and evolving global market.
"Global Catering Services Market Report and Forecast 2026-2035" offers a detailed analysis of the market based on the following segments:
Market Breakup by Service Type
Key Insight: Contractual catering holds the dominant share of the global catering services market by service type, driven by the structural preference of large corporations, healthcare systems, educational institutions, and government facilities for long-term outsourcing arrangements with established catering operators. Contractual catering delivers predictability of service quality, cost management, and operational compliance that non-contractual arrangements cannot replicate at scale. Contractual catering is also the fastest-growing service type at a CAGR of 6.8%, driven by accelerating outsourcing adoption in healthcare and education sectors in Asia Pacific and Middle East markets where professional contract catering penetration remains below Western market levels.
Market Breakup by Application
Key Insight: The catering services market is segmented by application into wedding catering, corporate catering, social events catering, and others. Wedding catering represents a premium and high-value application segment, characterised by bespoke menu design, live cooking stations, immersive dining experiences, and high average order values driven by the willingness of couples and families to invest significantly in the food and beverage dimension of milestone celebrations. Corporate catering is the fastest-growing application segment, supported by organisations adopting employee dining programmes as a talent attraction and retention tool and by growing demand for professional food service across corporate events, board meetings, and client entertainment. Social events catering encompasses a broad range of occasions including galas, fundraisers, community celebrations, and milestone events, representing a high-volume segment driven by recurring social and cultural traditions. The others category covers healthcare and patient meal catering, educational and university campus dining, sports and stadium food service, in-flight and transport catering, and offshore facility catering for the energy sector.
Market Breakup by Region
Key Insight: Europe holds the largest share of the global catering services market, underpinned by high contract catering penetration across corporate, healthcare, education, and government sectors in the United Kingdom, Germany, France, Netherlands, and Nordic countries. The European market is characterised by long-established relationships between institutional clients and major contract caterers, sophisticated service standards, and strong sustainability and nutritional regulation requirements. Asia Pacific is the fastest-growing region at a CAGR of 7.5%, driven by corporate sector expansion, healthcare catering outsourcing growth, and rising consumer dining standards across China, India, Japan, South Korea, and Southeast Asian emerging markets.


Read more about this report - REQUEST FREE SAMPLE COPY IN PDF
North America is the largest catering services market globally, led by the United States, which operates the most commercially significant single national catering market in the world. The US catering market is characterised by a well-developed corporate catering ecosystem, a large and active events and wedding catering segment, a mature contract food service sector serving healthcare, education, and government institutions, and significant inflight catering operations. The Far West region particularly California is the most commercially significant within the US market, representing the highest concentration of corporate dining establishments, tech company campuses with premium employee dining programmes, and high-value social event catering. The US corporate catering segment is being transformed by digital platforms including ezCater, which has reported that the majority of US workplaces plan to maintain or increase catering expenditure, with daily meal programmes growing steadily year-on-year.
Europe is the most mature regional catering services market, characterised by high contract catering penetration across corporate, healthcare, and educational institutions, a well-developed event catering infrastructure, and strong competitive presence of global contract catering majors including Compass Group (UK), Sodexo (France), Elior (France), and Mitie Group (UK). The United Kingdom has the most advanced contract catering market in Europe, with a dense ecosystem of managed service operators competing for NHS healthcare catering contracts, university campus dining agreements, and corporate head office food service management. France and Germany represent the second and third-largest national markets within Europe, with France supported by its sophisticated culinary culture driving premium event catering demand, and Germany by its large corporate campus and trade fair catering sector.
Asia Pacific is the fastest-growing catering services region, driven by the adoption of corporate campus dining as a talent retention tool in India, China, Japan, and South Korea, rapid private healthcare infrastructure expansion creating new institutional catering demand, and rising middle-class spending on premium social event and wedding catering. India is the most significant emerging catering market within Asia Pacific, with large technology campuses, business parks, and corporate headquarters in Bengaluru, Hyderabad, Mumbai, and Gurgaon increasingly outsourcing food service management to professional catering operators. Australia is a mature and high-value catering market within the region, supported by a well-developed event and corporate catering sector and high consumer spending on premium social dining experiences.
The Middle East is a high-growth and structurally important catering services region, driven by the ongoing execution of Vision 2030 in Saudi Arabia, the UAE's position as a global business and tourism hub, Qatar's FIFA World Cup legacy hospitality infrastructure, and the growing corporate catering demand driven by multinational office presence and high-income resident populations across the GCC. Halal-compliant catering, which meets dietary requirements across the GCC's predominantly Muslim population, is a mandatory service specification for institutional and event catering in the region and represents a significant market differentiator. Offshore catering serving oil and gas exploration and production facilities in the Gulf is a distinct and commercially significant sub-segment within the Middle East catering market.
Latin America represents an emerging but increasingly significant catering services market, with Brazil and Colombia as the most commercially active national markets. Spanish and Portuguese-language search queries confirm growing regional organic search interest in catering market intelligence. Brazil's catering market is supported by its large corporate sector, significant events and social celebration culture, and expanding healthcare and education institutional catering demand in major metropolitan areas including São Paulo, Rio de Janeiro, and Brasília.
The global catering services market is moderately concentrated at the top with a small number of large multinational contract catering companies controlling significant institutional market share, alongside a large and fragmented base of regional, local, and specialist event catering operators. Competitive dynamics in the contractual segment are shaped by scale, geographic coverage, client retention capability, service quality consistency, and increasingly by sustainability and technology credentials that institutional clients are incorporating into procurement criteria.
Founded in 1901 and headquartered in Copenhagen, Denmark, ISS A/S is a global integrated facility services company with significant catering and food service operations across corporate, healthcare, education, and government sectors. ISS provides a broad range of food service solutions as part of integrated workplace management contracts, operating across more than 30 countries with a strong presence in Northern Europe, Asia Pacific, and the Americas, delivering both standalone catering services and bundled facility management contracts to major institutional clients.
Founded in 1966 and headquartered in Issy-les-Moulineaux, France, Sodexo S.A. is one of the world's largest contract catering and integrated services companies, operating food service and on-site services across corporate, healthcare, education, government, and remote site sectors in over 50 countries. Sodexo's catering operations serve millions of consumers daily and the company has been expanding its footprint aggressively in Asia Pacific, with operations at over 950 sites in China and growing presence across Southeast Asian and Indian markets.
Founded in 1941 and headquartered in Chertsey, United Kingdom, Compass Group plc is the world's largest contract catering and foodservices company, operating in approximately 40 countries across corporate, healthcare, education, defence, leisure, and offshore sectors. In February 2026, Compass Group announced the acquisition of iLUKA Collective to expand its premium luxury catering capabilities, following its GBP 1.3 billion acquisition of Dutch premium caterer Vermaat Group in July 2025, reinforcing its strategy of growth through high-quality M&A alongside strong organic revenue expansion.
Founded in 1991 and headquartered in Paris, France, Elior Group is a leading European contract catering and services company operating in business and industry, education, healthcare, and concession catering segments across France, United Kingdom, Italy, and Spain. In February 2026, Elior UK was appointed as catering partner to the WWT London Wetland Centre, reflecting its strategy of building a diversified venue and visitor attraction catering portfolio alongside its core institutional contract base in corporate and healthcare sectors.
Other key players in the market are Aramark Corporation, AVI Foodsystems Inc., Thompson Hospitality Corporation, Albron B.V., Hutten Catering B.V., and Others.
*Please note that this is only a partial list; the complete list of key players is available in the full report. Additionally, the list of key players can be customized to better suit your needs.*
Unlock the growth potential of the rapidly expanding global catering services market with our comprehensive market report for 2026. Whether you are a contract catering operator planning geographic expansion, an institutional client benchmarking catering service models, an investor evaluating foodservice sector opportunities, or a hospitality group assessing competitive positioning, our research delivers the data-driven insights you need. Access detailed segment forecasts, competitive profiles of leading catering companies, and regional demand analysis. Download your free sample today and gain the intelligence needed to succeed in the dynamic global catering services market.
Upto 15% Off
USD
$2499 $2249
$3999 $3599
$4999 $4249
$5999 $5099


*While we strive to always give you current and accurate information, the numbers depicted on the website are indicative and may differ from the actual numbers in the main report. At Expert Market Research, we aim to bring you the latest insights and trends in the market. Using our analyses and forecasts, stakeholders can understand the market dynamics, navigate challenges, and capitalize on opportunities to make data-driven strategic decisions.*
The global catering services market reached a value of USD 175.45 Billion in the year 2025.
The market is expected to grow at a CAGR of 6.60% between 2026 and 2035.
The market is expected to reach a value of nearly USD 332.45 Billion by 2035.
The major drivers of the market include the rising population, increasing demand in the organised sector, rising number of companies, growing health consciousness, and increasing preference for catering services for smaller events.
The increase in penetration of mobile-based payment solutions, growing emphasis on the adoption of technology to improve customer experience, increase in demand for healthier fresh food, and stringent norms and regulations are the key trends propelling the market’s growth.
The major regions in the market are North America, Latin America, the Middle East and Africa, Europe, and Asia Pacific.
The service types in the market are contractual and non-contractual.
The major applications in the market are wedding catering, corporate catering, and social events catering, among others.
The major players in the market are Compass Group plc, Sodexo S.A, Aramark Corporation, AVI Foodsystems, Inc., ISS Facility Services Inc., and Mitie Group plc, among others.
Explore our key highlights of the report and gain a concise overview of key findings, trends, and actionable insights that will empower your strategic decisions.
| REPORT FEATURES | DETAILS |
| Base Year | 2025 |
| Historical Period | 2019-2025 |
| Forecast Period | 2026-2035 |
| Scope of the Report |
Historical and Forecast Trends, Industry Drivers and Constraints, Historical and Forecast Market Analysis by Segment:
|
| Breakup by Service Type |
|
| Breakup by Application |
|
| Breakup by Region |
|
| Market Dynamics |
|
| Competitive Landscape |
|
| Companies Covered |
|
Datasheet
One User
USD 2,499
USD 2,249
tax inclusive*
Single User License
One User
USD 3,999
USD 3,599
tax inclusive*
Five User License
Five User
USD 4,999
USD 4,249
tax inclusive*
Corporate License
Unlimited Users
USD 5,999
USD 5,099
tax inclusive*
*Please note that the prices mentioned below are starting prices for each bundle type. Kindly contact our team for further details.*
Flash Bundle
Small Business Bundle
Growth Bundle
Enterprise Bundle
*Please note that the prices mentioned below are starting prices for each bundle type. Kindly contact our team for further details.*
Flash Bundle
Number of Reports: 3
20%
tax inclusive*
Small Business Bundle
Number of Reports: 5
25%
tax inclusive*
Growth Bundle
Number of Reports: 8
30%
tax inclusive*
Enterprise Bundle
Number of Reports: 10
35%
tax inclusive*
How To Order

Select License Type
Choose the right license for your needs and access rights.

Click on ‘Buy Now’
Add the report to your cart with one click and proceed to register.

Select Mode of Payment
Choose a payment option for a secure checkout. You will be redirected accordingly.
Strategic Solutions for Informed Decision-Making
Gain insights to stay ahead and seize opportunities.

Get insights & trends for a competitive edge.

Track prices with detailed trend reports.

Analyse trade data for supply chain insights.

Leverage cost reports for smart savings

Enhance supply chain with partnerships.

Connect For More Information
Our expert team of analysts will offer full support and resolve any queries regarding the report, before and after the purchase.
Our expert team of analysts will offer full support and resolve any queries regarding the report, before and after the purchase.
We employ meticulous research methods, blending advanced analytics and expert insights to deliver accurate, actionable industry intelligence, staying ahead of competitors.
Our skilled analysts offer unparalleled competitive advantage with detailed insights on current and emerging markets, ensuring your strategic edge.
We offer an in-depth yet simplified presentation of industry insights and analysis to meet your specific requirements effectively.


