

Consumer Insights
Uncover trends and behaviors shaping consumer choices today
Procurement Insights
Optimize your sourcing strategy with key market data
Industry Stats
Stay ahead with the latest trends and market analysis.
The global chlorine market attained a value of USD 39.95 Billion in 2025 and is projected to expand at a CAGR of 4.50% through 2035. The market is further expected to achieve USD 62.04 Billion by 2035. The insistence on water disinfection standards in many developing countries has become a major factor in the demand for long-term chlorine contracts. As a result, producers are globally adjusting their strategies with a focus on reliability, traceability and regulatory compliance rather than on short-term spot market exposure.
Demand in the chlorine market dynamics are being fundamentally changed as a result of stricter safety standards and end-use specialization. Municipal water treatment facilities, chemical manufacturers, and the pharmaceutical industry are becoming more focused on having a reliable quality supply rather than a flexible volume. On the other hand, producers are matching their chlorine manufacturing to captive consumption or contract-based offtake. In the current market environment, product planning is more about purity, packaging design, and digital tracking of storage and transport.
Industrial chlorine demand is boosting due to the integration of downstream chemical and city infrastructure-led consumption. PVC producers are monitoring their chlorine suppliers to understand their production rates. In September 2025, DCM Shriram and Aarti Industries agreed long-term chlorine supply deal with dedicated pipeline to serve Aarti’s Gujarat plant, boosting reliability and safety. At the same time, the electronics and pharmaceutical segments are demanding higher purity chlorine. Such industry pressures are driving chemical manufacturers to separate product streams more aggressively, driving the chlorine market value. Flexibility in operation and formulations tailored to the customer are becoming the factors that set companies apart from each other.
Moreover, companies like Olin Corporation are continuing the implementation of their chlor-alkali optimization strategy in their United States facilities, with a special emphasis on employing more efficient membrane cell technology, to maintain the level of chlorine production despite the fluctuations in vinyl chain. According to the chlorine market analysis, 95% of world chlorine production is obtained by the membrane-based chlor-alkali process, significantly cutting down on energy intensity. Hence, producers are increasingly focused on operational resilience, especially considering the irregular PVC-demand cycles downstream.
Compound Annual Growth Rate
4.5%
Value in USD Billion
2026-2035
Tidal Metals signed MoU with Alexander Chemical to market chlorine from its seawater magnesium facility, strengthening North American distribution channels. Integrated supply and regional distribution partnerships can help companies secure offtake stability and expand chlorine footprint in coastal markets, leveraging such trends in the chlorine market.
Asahi Kasei introduced hydrogen-utilizing chlor-alkali technology to enhance decarbonization, improving energy efficiency and lowering emissions across chlorine manufacturing operations. Companies can invest in low-carbon chlor-alkali technologies to meet sustainability mandates and attract environmentally conscious industrial buyers.
Lords Chloro Alkali announced plans to expand chlorinated paraffin wax capacity to 100 TPD, supporting downstream chlorine derivative demand. Expanding value-added chlorine derivatives enables firms to capture higher margins and strengthen presence in specialty chemicals segments.
ABB introduced Chlorostar analyzer family for accurate, real-time chlorine measurement, improving safety, compliance, and digital process optimization. Smart monitoring solutions create chlorine market opportunities for automation providers and chemical producers to enhance operational efficiency and regulatory compliance.
Chlorine manufacturers are pushing the transition to membrane cell technology at an increasing pace as a way to lower energy consumption and emissions. The use of advanced membranes by companies results not only in improved yield stability but also in less production downtime. These enhancements also facilitate tight purity specifications required by pharmaceutical and semiconductor customers. Membrane conversion is regarded by producers as a move that helps them maintain their profit margins even when the chlorine market is volatile. In October 2025, thyssenkrupp nucera launched BM2.7 v7 and e-BiTAC v7 bipolar membrane tech for more efficient, lower-energy chlor-alkali electrolysis in Germany.
Chlorine demand is being primarily driven by water infrastructure projects supported by the government. The safety of drinking water remains a priority for public administrations in Asia, Africa, and Latin America. At large scale, chlorine is, by far, the most economical disinfectant. Producers are bringing their supply chains closer to municipal treatment facilities in order to lower transportation risk. The emphasis here is on the company's reliability and quick emergency response capability. Hence, there is a preference for companies that provide integrated storage and dosing support. In July 2025, Kemira announced new ACH production line to bolster drinking water treatment solutions in Spain, accelerating the chlorine market penetration.
PVC production remains tightly linked to chlorine consumption. Chemical producers with integrated vinyl chains are restructuring operations to balance chlorine utilization internally to reduce merchant exposure. Producers are optimizing chlorine output to match downstream requirements to improve asset utilization. Integrated players benefit from cost control and supply certainty. Meanwhile, independent chlorine suppliers face pressure unless they secure contract-based offtake. The trend in the chlorine market encourages vertical integration and discourages speculative capacity additions. In April 2025, Prayag Polymers rolled out complete PVC-O pipes for high-pressure water distribution, irrigation and industrial use.
The usage of high purity chlorine in applications like pharmaceuticals, electronics, and specialty chemicals is growing rapidly. All these segments demand strict contamination control. Manufacturers are installing purification and monitoring systems. Regulatory authorities are introducing more stringent quality standards for products used in medical and electronic manufacturing. This is compelling chlorine suppliers to tailor their products to different grades. Higher profit margins are within reach but only with capital investment. Suppliers going after this niche must constantly have well-aligned compliance records to accelerate the chlorine market value. In December 2025, Indian Peroxide Limited (IPL) announced plans to build a 400 TPD caustic soda/chlor-alkali plant in Gujrat scalable to 800 TPD, boosting domestic supply.
Globally, regulations on the handling of chlorine are being tightened. Authorities are imposing more stringent requirements for the management of hazardous chemicals. To comply with these rules, manufacturers are opting for digital monitoring for leak detection and transport safety. Apart from lowering the risk of incidents, these investments also lead to lower insurance expenses. Enterprises that have implemented comprehensive compliance infrastructures are the ones that earn trust. Safety, therefore, has become a key factor in chlorine market competitiveness. For example, in June 2024, Riken Keiki launched SC-9000 portable detector that simultaneously identifies up to three toxic gases, improving industrial safety monitoring.
Read more about this report - REQUEST FREE SAMPLE COPY IN PDF
The EMR’s report titled “Global Chlorine Market Report and Forecast 2026-2035” offers a detailed analysis of the market based on the following segments:
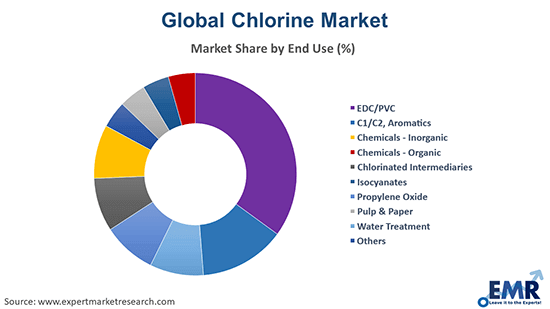
Market Breakup by End Use
Key Insight: EDC and PVC currently capture the dominant share in the chlorine market revenue due to captive consumption. On the other hand, water treatment drives growth through regulatory pressure. Inorganic and organic chemicals demand consistent quality. Chlorinated intermediates support pharmaceuticals and agrochemicals. Isocyanates and propylene oxide depend on construction and manufacturing cycles. Pulp and paper focus on process efficiency. Producers segment supply based on risk tolerance and logistics needs, as their balanced portfolios protect margins.
Market Breakup by Region
Key Insight: Asia Pacific dominates the global industry in terms of scale, vertical integration, and export-driven production models. In November 2024, ADAMA commissioned a new state-of-the-art chlor-alkali plant, adding capacity to the Indian chlorine market, improving the efficiency of the chlor-alkali process, and lowering the overall environmental footprint of the facility. North America continues to drive growth with steady demand from industrial and municipal water treatment applications. Europe focuses on meeting regulatory requirements, improving energy efficiency, and modernizing the chlor-alkali model. Latin American countries are slowly posting growth with improvements in infrastructure and increasing chlorine chemical demand due to construction activity. The Middle East and Africa are also advancing capacity with ongoing desalination and industrial water treatment services.
By end use, EDC PVC dominates chlorine consumption due to captive vinyl integration demand
EDC and PVC remain the dominant end use for chlorine due to tight vinyl chain integration. Integrated producers prioritize chlorine utilization stability to sustain PVC operating rates. This limits merchant exposure and improves cost control. EDC production absorbs large chlorine volumes, making this segment structurally dominant. Product strategies focus on consistent purity and uninterrupted supply rather than packaging flexibility. During the downturns in construction, chlorine producers with captive PVC units usually keep offtake predictable.
Governments are going to extensive lengths in tightening the standards for drinking water and sanitation, which is why water treatment is the fastest growing end use category that is boosting the chlorine market revenue. Municipal authorities seek disinfectants that are not only reliable but also have proven effectiveness. Urbanization and infrastructure upgrades are the main factors for growth in this segment. Chlorine suppliers are also offering handling support and safety services to improve customer retention. In September 2025, De Nora introduced Oxicore, a modular underwater system delivering up to 99% chlorine dioxide yield for safer, scalable water disinfection.


Asia Pacific clocks in the leading position in the market due to vinyl capacity concentration
Asia Pacific emerges to be the leading regional chlorine industry because of the heavy concentration of PVC and chemical manufacturing capacities. Chlorine usage in the region is largely led by a number of big integrated complexes. In fact, the producers that work in these markets on such massive scales typically prioritize the utilization of their own production over external sales. Additionally, the industrial clusters in the regional countries get support from the local governments. Moreover, in April 2025, by launching a joint initiative, Asahi Kasei, Nobian, Furuya Metal, and Mastermelt decided to recycle precious metals from chlor-alkali electrolyzer components, thus contributing to the sustainable production of chlorine and circular supply chains within the Japanese industry.
The Middle East and Africa chlorine market experiences accelerated growth pace, mainly due to the massive expansion of water treatment systems. Local governments in the region are making notable investments in projects for desalination and sanitation. Many producers are thus gearing their supply towards the specific timelines of infrastructure development. There is also the factor of demographic increase and urban development contributing to the region’s growth.
Leading chlorine market players are focusing on balancing their output with the amount of captive downstream demand in order to safeguard margins. Energy efficiency and safety compliance are essential aspects of the competitive edge. There are some opportunities in securing long-term municipal contracts as well as supplying high-purity chlorine to the specialty sectors.
Chlorine companies are upgrading their membrane cells in order to keep the power costs in check. Production is becoming more regional to avoid transportation risks. Vinyl-integrated players are able to maintain volume stability. Digital monitoring and safety systems are becoming core differentiators. Besides pricing, the biggest factors that act as competitive advantages are operational reliability, regulatory credibility, and integration.
Olin Corporation, which was established in 1892 and has its headquarters in Clayton, Missouri, United States, is operating one of the largest chlor-alkali platforms. The company’s primary focus is on membrane-based chlorine production, which is integrated with vinyl operations. Their strategy mainly aims at reducing exposure to spot chlorine price volatility.
Occidental Petroleum Corporation, which was founded in the year 1920, has its headquarters in California, United States. The company is active in the chlorine market through its chemicals segment. Occidental strives to create a synergy between chlorine and downstream chemical production. The company is highly focused on energy efficiency and optimizing the use of feedstock.
Ineos AG, which was started in 1998 and is headquartered in the United Kingdom, runs chlorine production as one of the integrated chemical value chains. The company’s major focus is on compliance in Europe and on the modernization of its assets. Ineos provides chlorine for PVC as well as for various industrial applications.
Hanwha Chemical Corporation, which was founded in 1952, and has its headquarters in Seoul, South Korea, meets chlorine demand through integrated chemical operations. The company is focused on the Asian markets. Internal use of chlorine helps in supporting the supply of downstream products. Hanwha puts a strong emphasis on cost control and operational stability.
*Please note that this is only a partial list; the complete list of key players is available in the full report. Additionally, the list of key players can be customized to better suit your needs.*
Unlock the latest insights with our chlorine market trends 2026 report. Discover regional growth patterns, consumer preferences, and key industry players. Stay ahead of competition with trusted data and expert analysis. Download your free sample report today and drive informed decisions in the market.
Upto 15% Off
USD
$2499 $2249
$3999 $3599
$4999 $4249
$5999 $5099


*While we strive to always give you current and accurate information, the numbers depicted on the website are indicative and may differ from the actual numbers in the main report. At Expert Market Research, we aim to bring you the latest insights and trends in the market. Using our analyses and forecasts, stakeholders can understand the market dynamics, navigate challenges, and capitalize on opportunities to make data-driven strategic decisions.*
In 2025, the market reached an approximate value of USD 39.95 Billion.
The market is projected to grow at a CAGR of 4.50% between 2026 and 2035.
The market is estimated to witness healthy growth in the forecast period of 2026-2035 to reach a value of around USD 62.04 Billion by 2035.
Stakeholders are optimizing integrated operations, investing in energy efficient technology, securing long-term municipal contracts, regionalizing supply chains, and strengthening safety systems while aligning chlorine output closely with downstream consumption planning.
The key trends guiding the market include the growing demand for clean water in developing nations and the rising utilisation of chlorine in the manufacturing of composites and automotive components.
The major regions in the market are North America, Latin America, the Middle East and Africa, Europe, and the Asia Pacific.
The major end uses of chlorine are EDC/PVC, C1/C2, aromatics, chemicals – inorganic, chemicals – organic, chlorinated intermediaries, isocyanates, propylene oxide, pulp and paper, and water treatment, among others.
The key players in the market include OLIN Corporation, Occidental Petroleum Corporation (OXY), Ineos AG, and Hanwha Chemical Corporation, among others.
Chlorine producers face energy cost volatility, strict safety regulations, hazardous logistics constraints, downstream demand cyclicality, and pressure to modernize legacy production assets while maintaining uninterrupted supply commitments globally.
Explore our key highlights of the report and gain a concise overview of key findings, trends, and actionable insights that will empower your strategic decisions.
| REPORT FEATURES | DETAILS |
| Base Year | 2025 |
| Historical Period | 2019-2025 |
| Forecast Period | 2026-2035 |
| Scope of the Report |
Historical and Forecast Trends, Industry Drivers and Constraints, Historical and Forecast Market Analysis by Segment:
|
| Breakup by End Use |
|
| Breakup by Region |
|
| Market Dynamics |
|
| Competitive Landscape |
|
| Companies Covered |
|
| Report Price and Purchase Option | Explore our purchase options that are best suited to your resources and industry needs. |
| Delivery Format | Delivered as an attached PDF and Excel through email, with an option of receiving an editable PPT, according to the purchase option. |
Datasheet
One User
USD 2,499
USD 2,249
tax inclusive*
Single User License
One User
USD 3,999
USD 3,599
tax inclusive*
Five User License
Five User
USD 4,999
USD 4,249
tax inclusive*
Corporate License
Unlimited Users
USD 5,999
USD 5,099
tax inclusive*
*Please note that the prices mentioned below are starting prices for each bundle type. Kindly contact our team for further details.*
Flash Bundle
Small Business Bundle
Growth Bundle
Enterprise Bundle
*Please note that the prices mentioned below are starting prices for each bundle type. Kindly contact our team for further details.*
Flash Bundle
Number of Reports: 3
20%
tax inclusive*
Small Business Bundle
Number of Reports: 5
25%
tax inclusive*
Growth Bundle
Number of Reports: 8
30%
tax inclusive*
Enterprise Bundle
Number of Reports: 10
35%
tax inclusive*
How To Order

Select License Type
Choose the right license for your needs and access rights.

Click on ‘Buy Now’
Add the report to your cart with one click and proceed to register.

Select Mode of Payment
Choose a payment option for a secure checkout. You will be redirected accordingly.
Strategic Solutions for Informed Decision-Making
Gain insights to stay ahead and seize opportunities.

Get insights & trends for a competitive edge.

Track prices with detailed trend reports.

Analyse trade data for supply chain insights.

Leverage cost reports for smart savings

Enhance supply chain with partnerships.

Connect For More Information
Our expert team of analysts will offer full support and resolve any queries regarding the report, before and after the purchase.
Our expert team of analysts will offer full support and resolve any queries regarding the report, before and after the purchase.
We employ meticulous research methods, blending advanced analytics and expert insights to deliver accurate, actionable industry intelligence, staying ahead of competitors.
Our skilled analysts offer unparalleled competitive advantage with detailed insights on current and emerging markets, ensuring your strategic edge.
We offer an in-depth yet simplified presentation of industry insights and analysis to meet your specific requirements effectively.


