

Consumer Insights
Uncover trends and behaviors shaping consumer choices today
Procurement Insights
Optimize your sourcing strategy with key market data
Industry Stats
Stay ahead with the latest trends and market analysis.
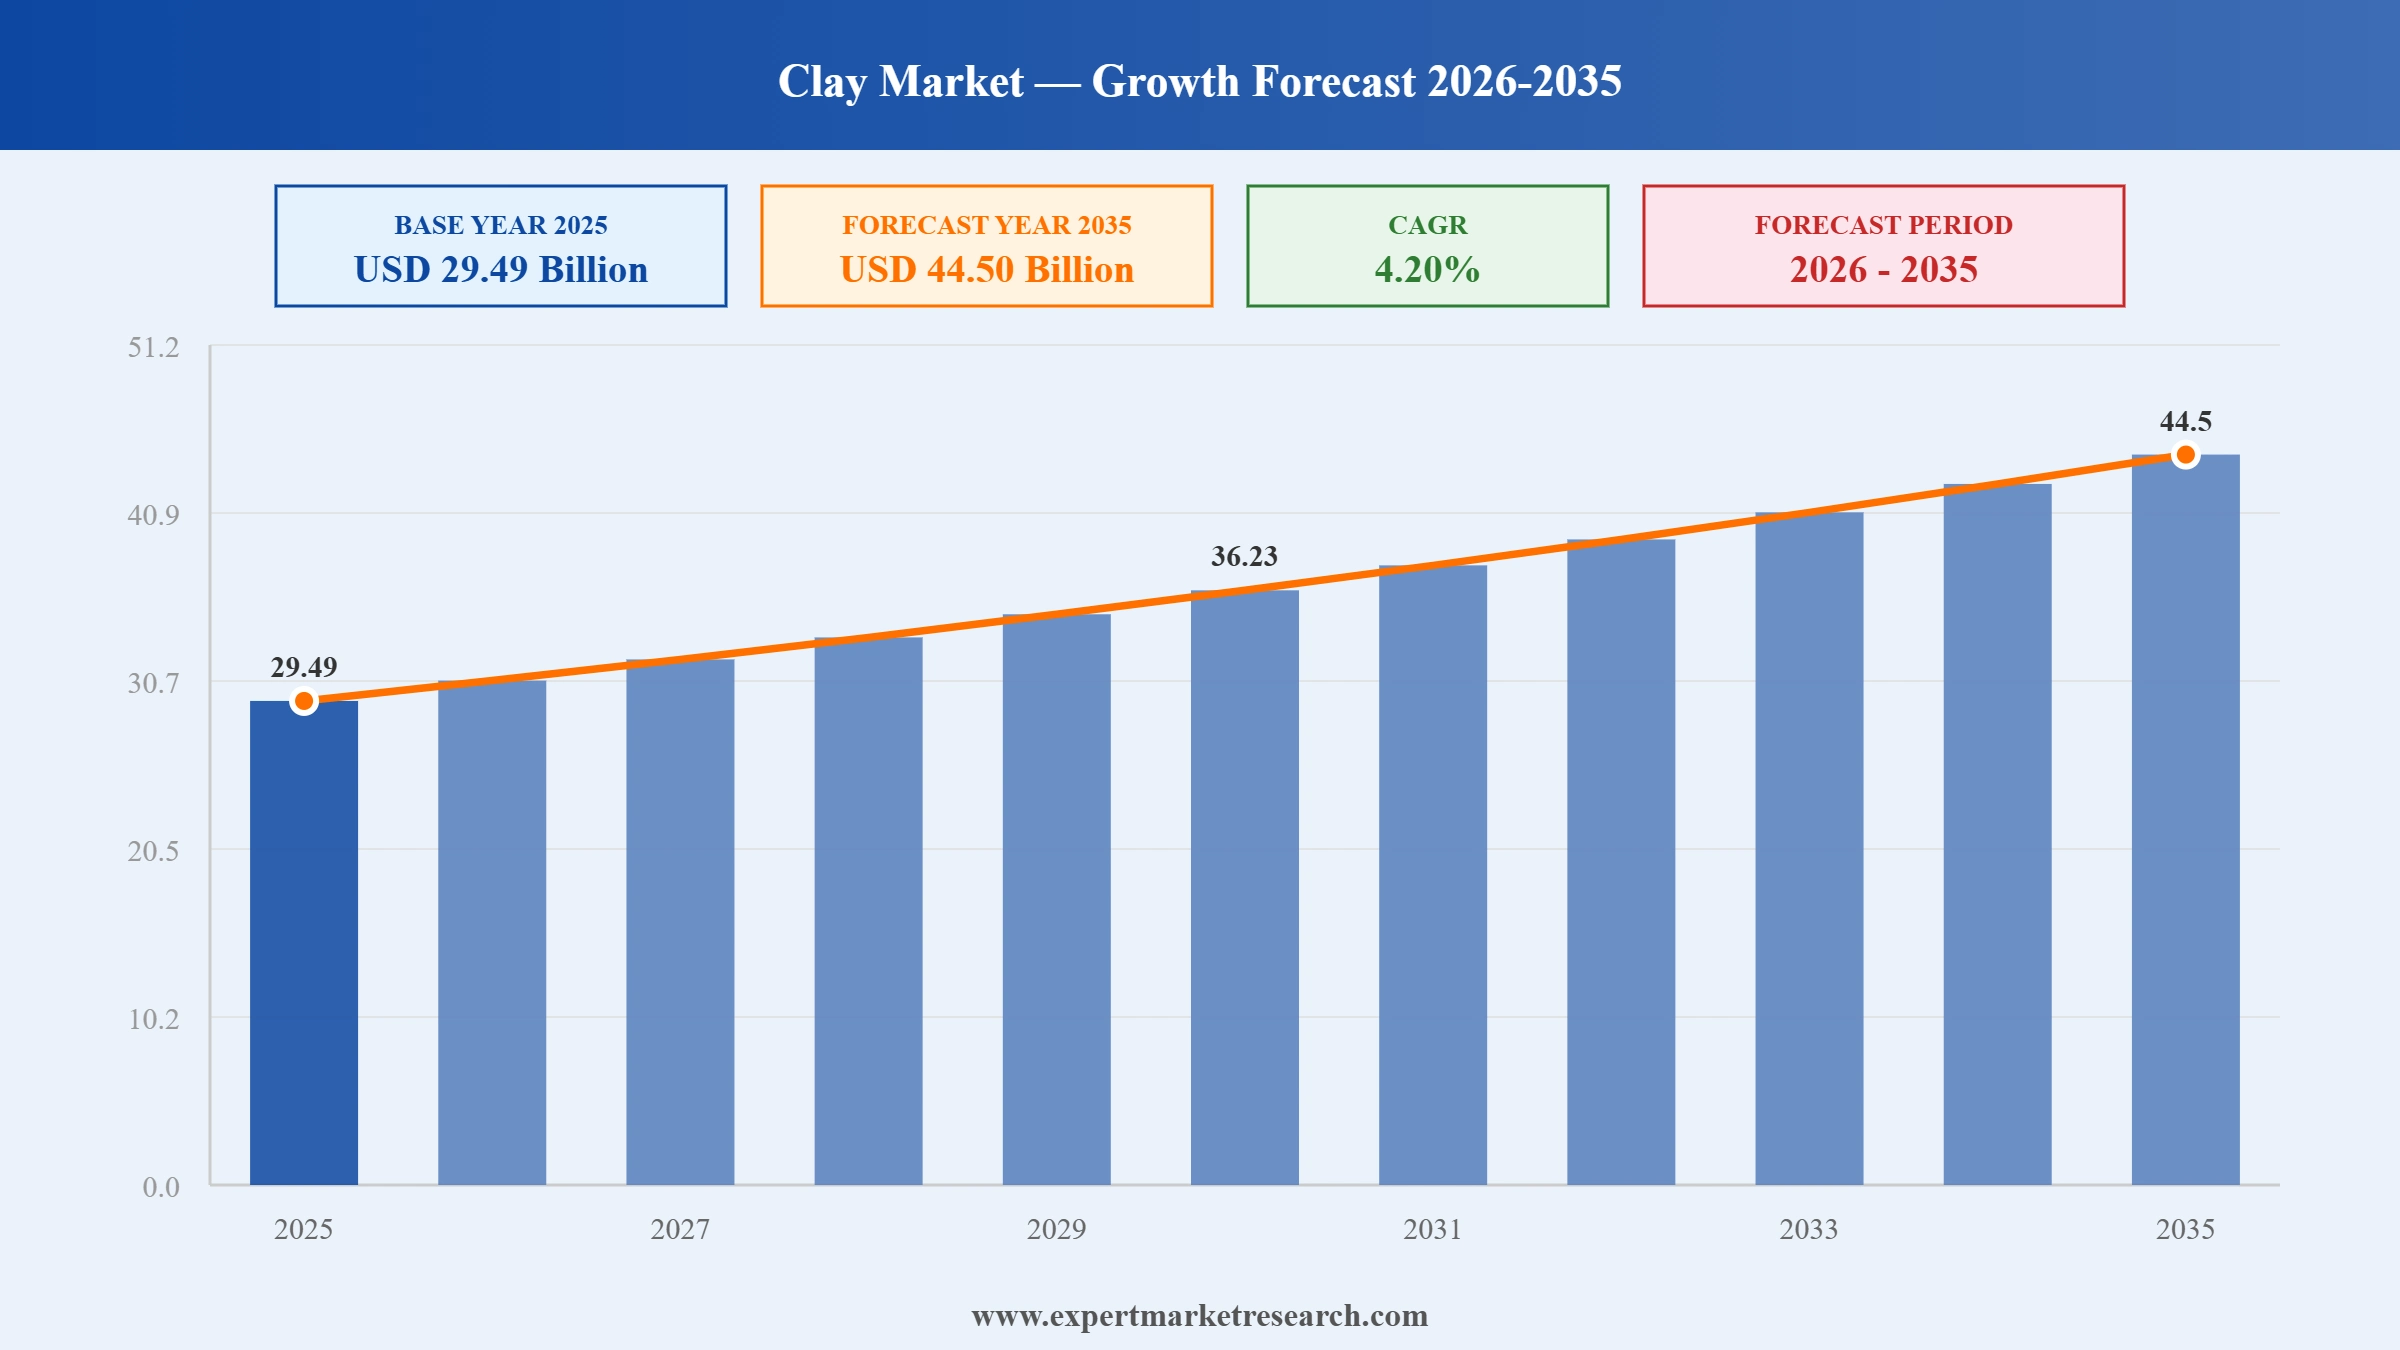
The clay market reached a value of USD 29.49 Billion at 2025 and is projected to expand at a CAGR of around 4.20% during the forecast period of 2026-2035. Backed by rising construction activity, scaling ceramics output across Asia, a shift towards cleaner extraction methods, and a steady push into specialty applications, the market is expected to reach USD 44.50 Billion by 2035.
Market Size (2025): USD 29.49 Billion
Projected Market Size (2035): USD 44.50 Billion
Compound Annual Growth Rate (CAGR) (2026-2035): 4.20%
Read more about this report - REQUEST FREE SAMPLE COPY IN PDF
The clay industry is undergoing a quiet but meaningful repositioning. Major producers are putting capital behind cleaner extraction, AI driven process optimisation, and bolt on acquisitions that widen their specialty mineral portfolios, while restructured supply partnerships across Europe point to a sharper focus on logistics performance and service consistency rather than pure tonnage.
In September 2025, KaMin LLC introduced a dedicated eco-friendly clay range engineered to meet tightening environmental standards across North America and Europe. The launch positions the company as a preferred supplier to paper, rubber, and coatings buyers who increasingly demand verified sustainability credentials.
In July 2025, Sibelco announced a strategic partnership with a technology firm to deploy AI driven solutions across its clay extraction and processing operations. The collaboration applies machine learning to mineralogical, energy, and quality data, targeting yield gains and lower emissions across its UK, US, and Czech sites.
In May 2025, Imerys committed nearly GBP 18 million to a new dry mining facility at its Littlejohns Pit site in mid Cornwall. The switch from wet hydraulic extraction is set to cut on site electricity use by about 10% and extend reserve life, with operations scheduled to begin in 2026 and finished kaolin already exported to over 75 countries.
On 5 May 2025, KaMin LLC and Omya announced a restructured supply partnership for kaolin into the European packaging and paper market. Omya retains sales and technical support roles while KaMin assumes order processing, logistics, and inventory management, sharpening delivery reliability for paper and board customers across the region.
Bricks, ceramic tiles, roof tiles, and sanitary ware continue to anchor the clay market, with India's reaffirmation in March 2025 of its 10 million affordable housing target under PMAY locking in years of brick kiln throughput and supporting steady clay market growth through 2035.
Rising energy costs, water use rules, and ESG procurement pressure are pushing producers to upgrade kaolin extraction. Imerys' GBP 18 million dry mining investment in Cornwall, announced in May 2025, is the clearest recent signal that the global clay market is genuinely pivoting toward lower impact methods.
Ceramic additive manufacturing is moving faster than expected. Lithoz GmbH introduced its CeraMax Vario V900 in January 2025, a Laser Induced Slipcasting machine for large industrial parts, creating a premium pull for high purity kaolin and ball clay feedstock within the clay market.
In October 2024, the European Commission finalised soil health regulations under the EU Soil Strategy for 2030, explicitly recognising bentonite and montmorillonite for sustainable land management. The shift opens a credible procurement pathway for clay industry suppliers across European agriculture markets.
Major suppliers are widening their specialty mineral mix to lift margins beyond commodity construction grades. Imerys closed its Chemviron diatomite and perlite acquisition in January 2025, extending its filtration footprint and reinforcing its position as a multi mineral partner in the global clay market trends.
The report by Expert Market Research titled "Clay Market Report and Forecast 2026-2035" offers a detailed analysis of the market based on the following segments:
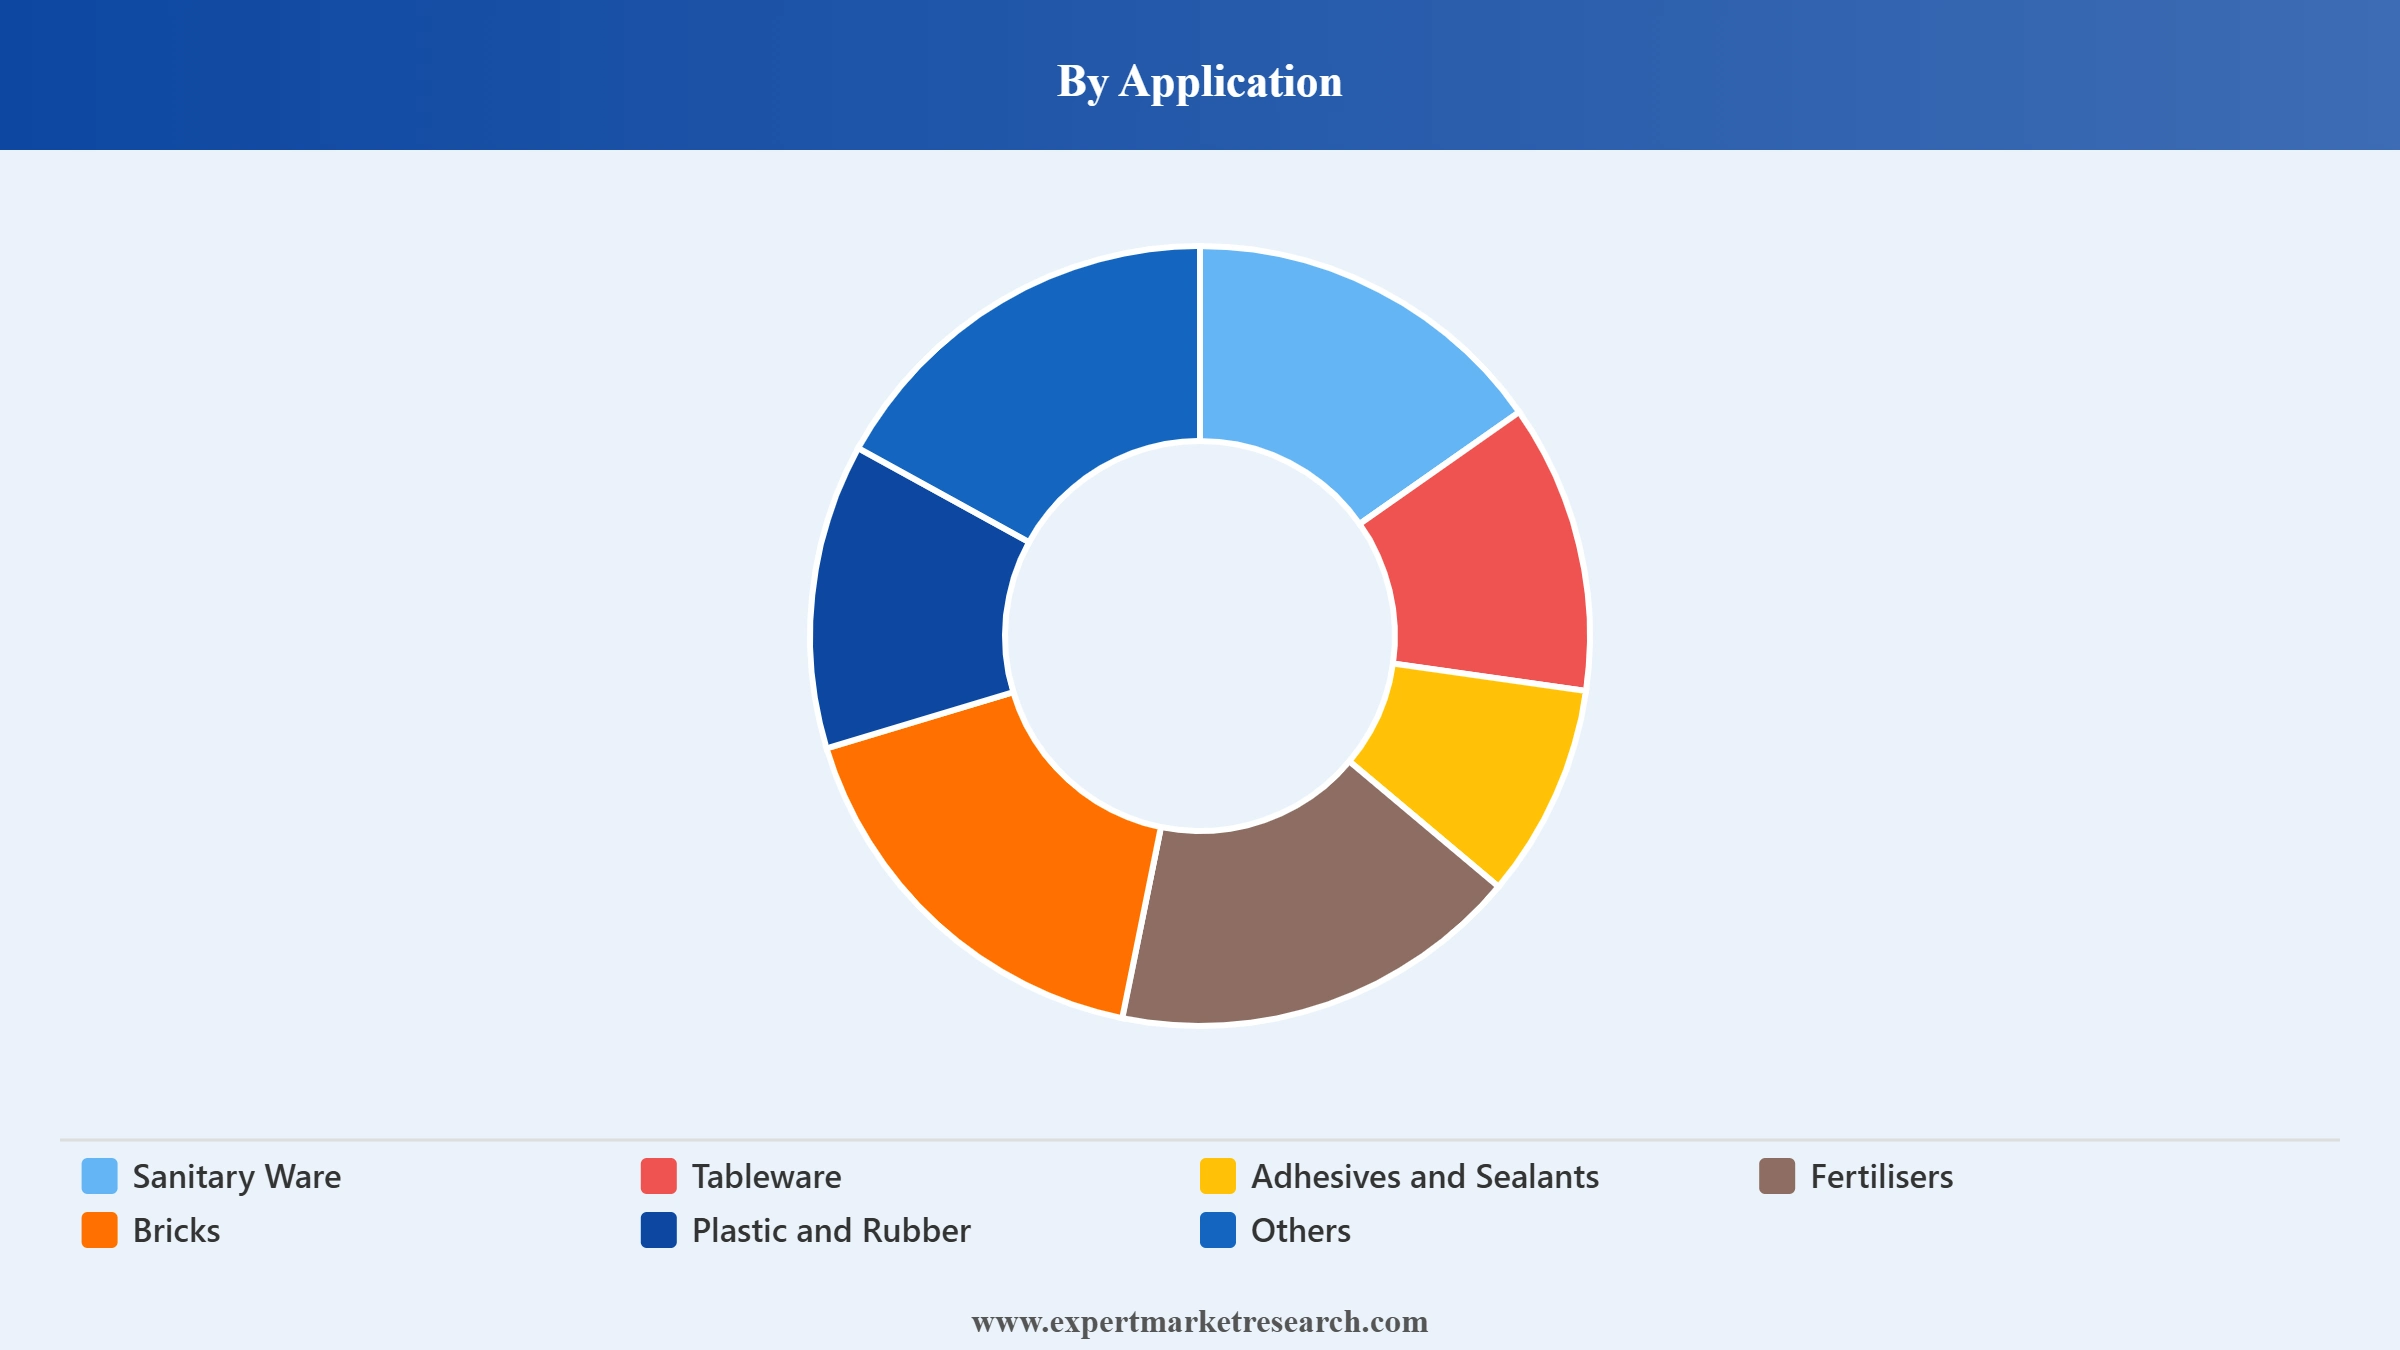
Market Breakup by Application
Key Insight: Bricks take the largest share of global clay consumption by volume, and that is unlikely to shift through 2035 given the scale of construction work across South and Southeast Asia. The more interesting story sits at the margins. Sanitary ware, though smaller by volume, commands premium pricing as ball clay grades for this application have to fire white, hold their shape, and meet tight tolerances. Tableware, adhesives, plastic and rubber, and fertilisers operate in a similar zone, modest volumes but better margins per tonne. Producers with strong processing capability tend to invest disproportionately in these specialty pockets of the clay market.
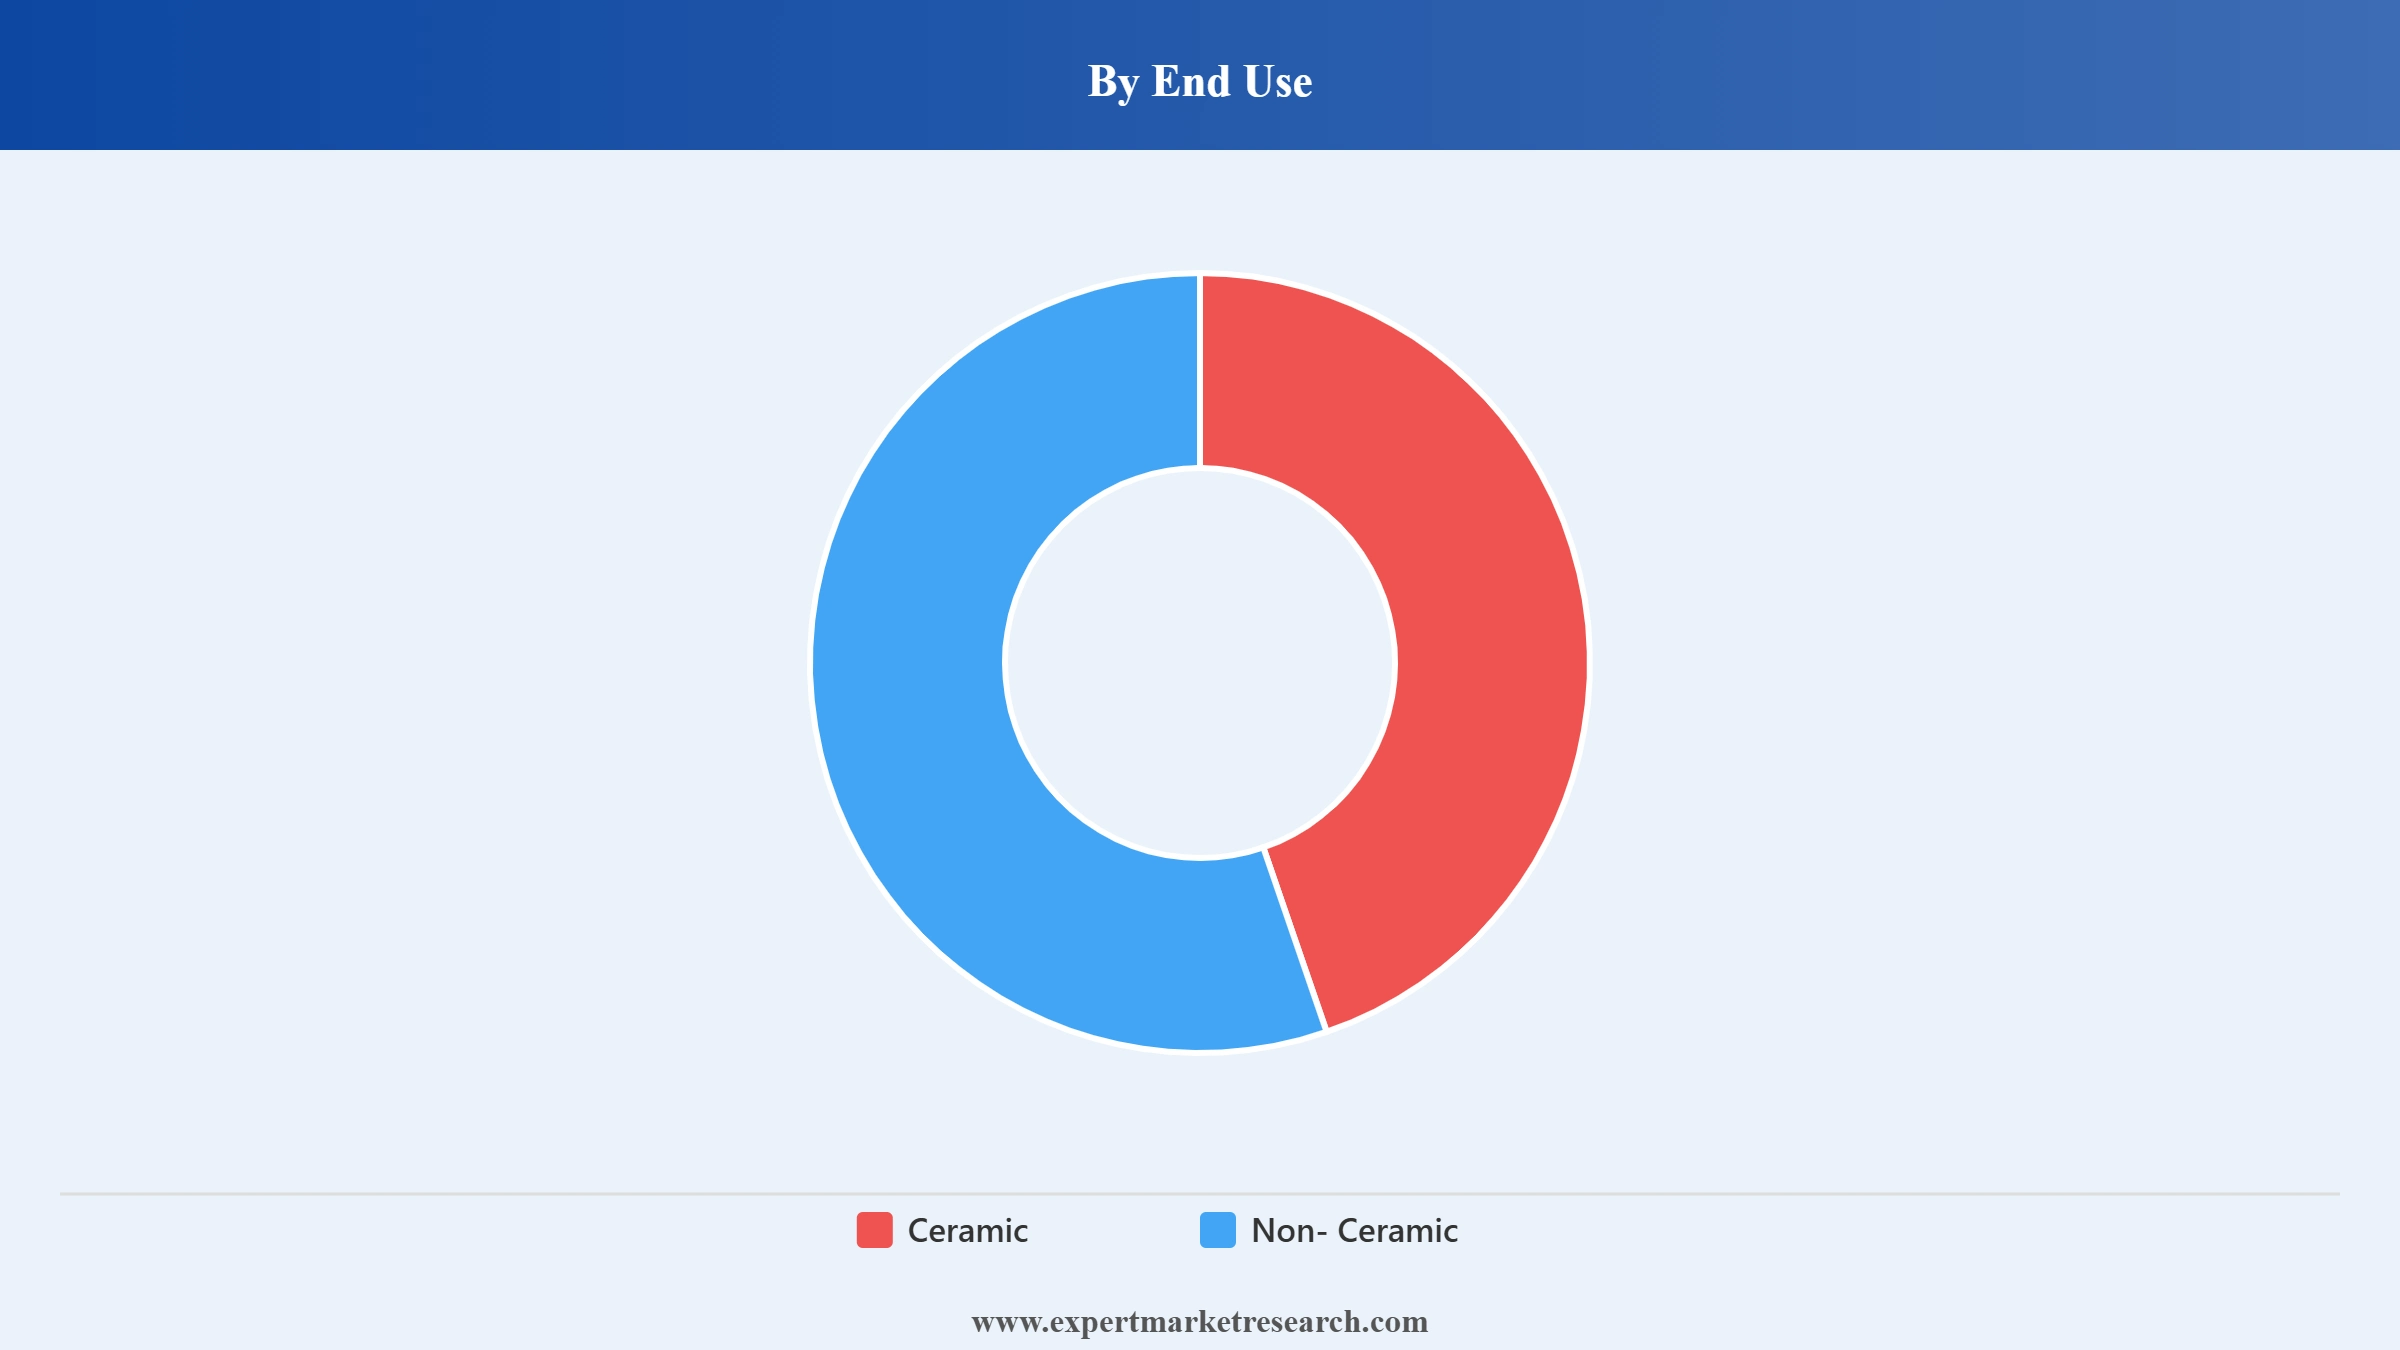
Market Breakup by End Use
Key Insight: Ceramic still dominates, and by a wide margin. Tiles, bricks, sanitary ware, tableware, and technical refractories together account for the bulk of what the global clay market produces, with China's tile industry alone setting the pace regionally. The non ceramic side, though smaller, is the more strategically interesting place to be right now. Paper coating uses kaolin for brightness and ink holdout, rubber compounding relies on calcined kaolin as a reinforcing filler, and pharmaceutical grade bentonite supports tablet formulations and wound care. None are new, but they all carry better margins and demand technically demanding clay grades that fewer producers can consistently deliver.
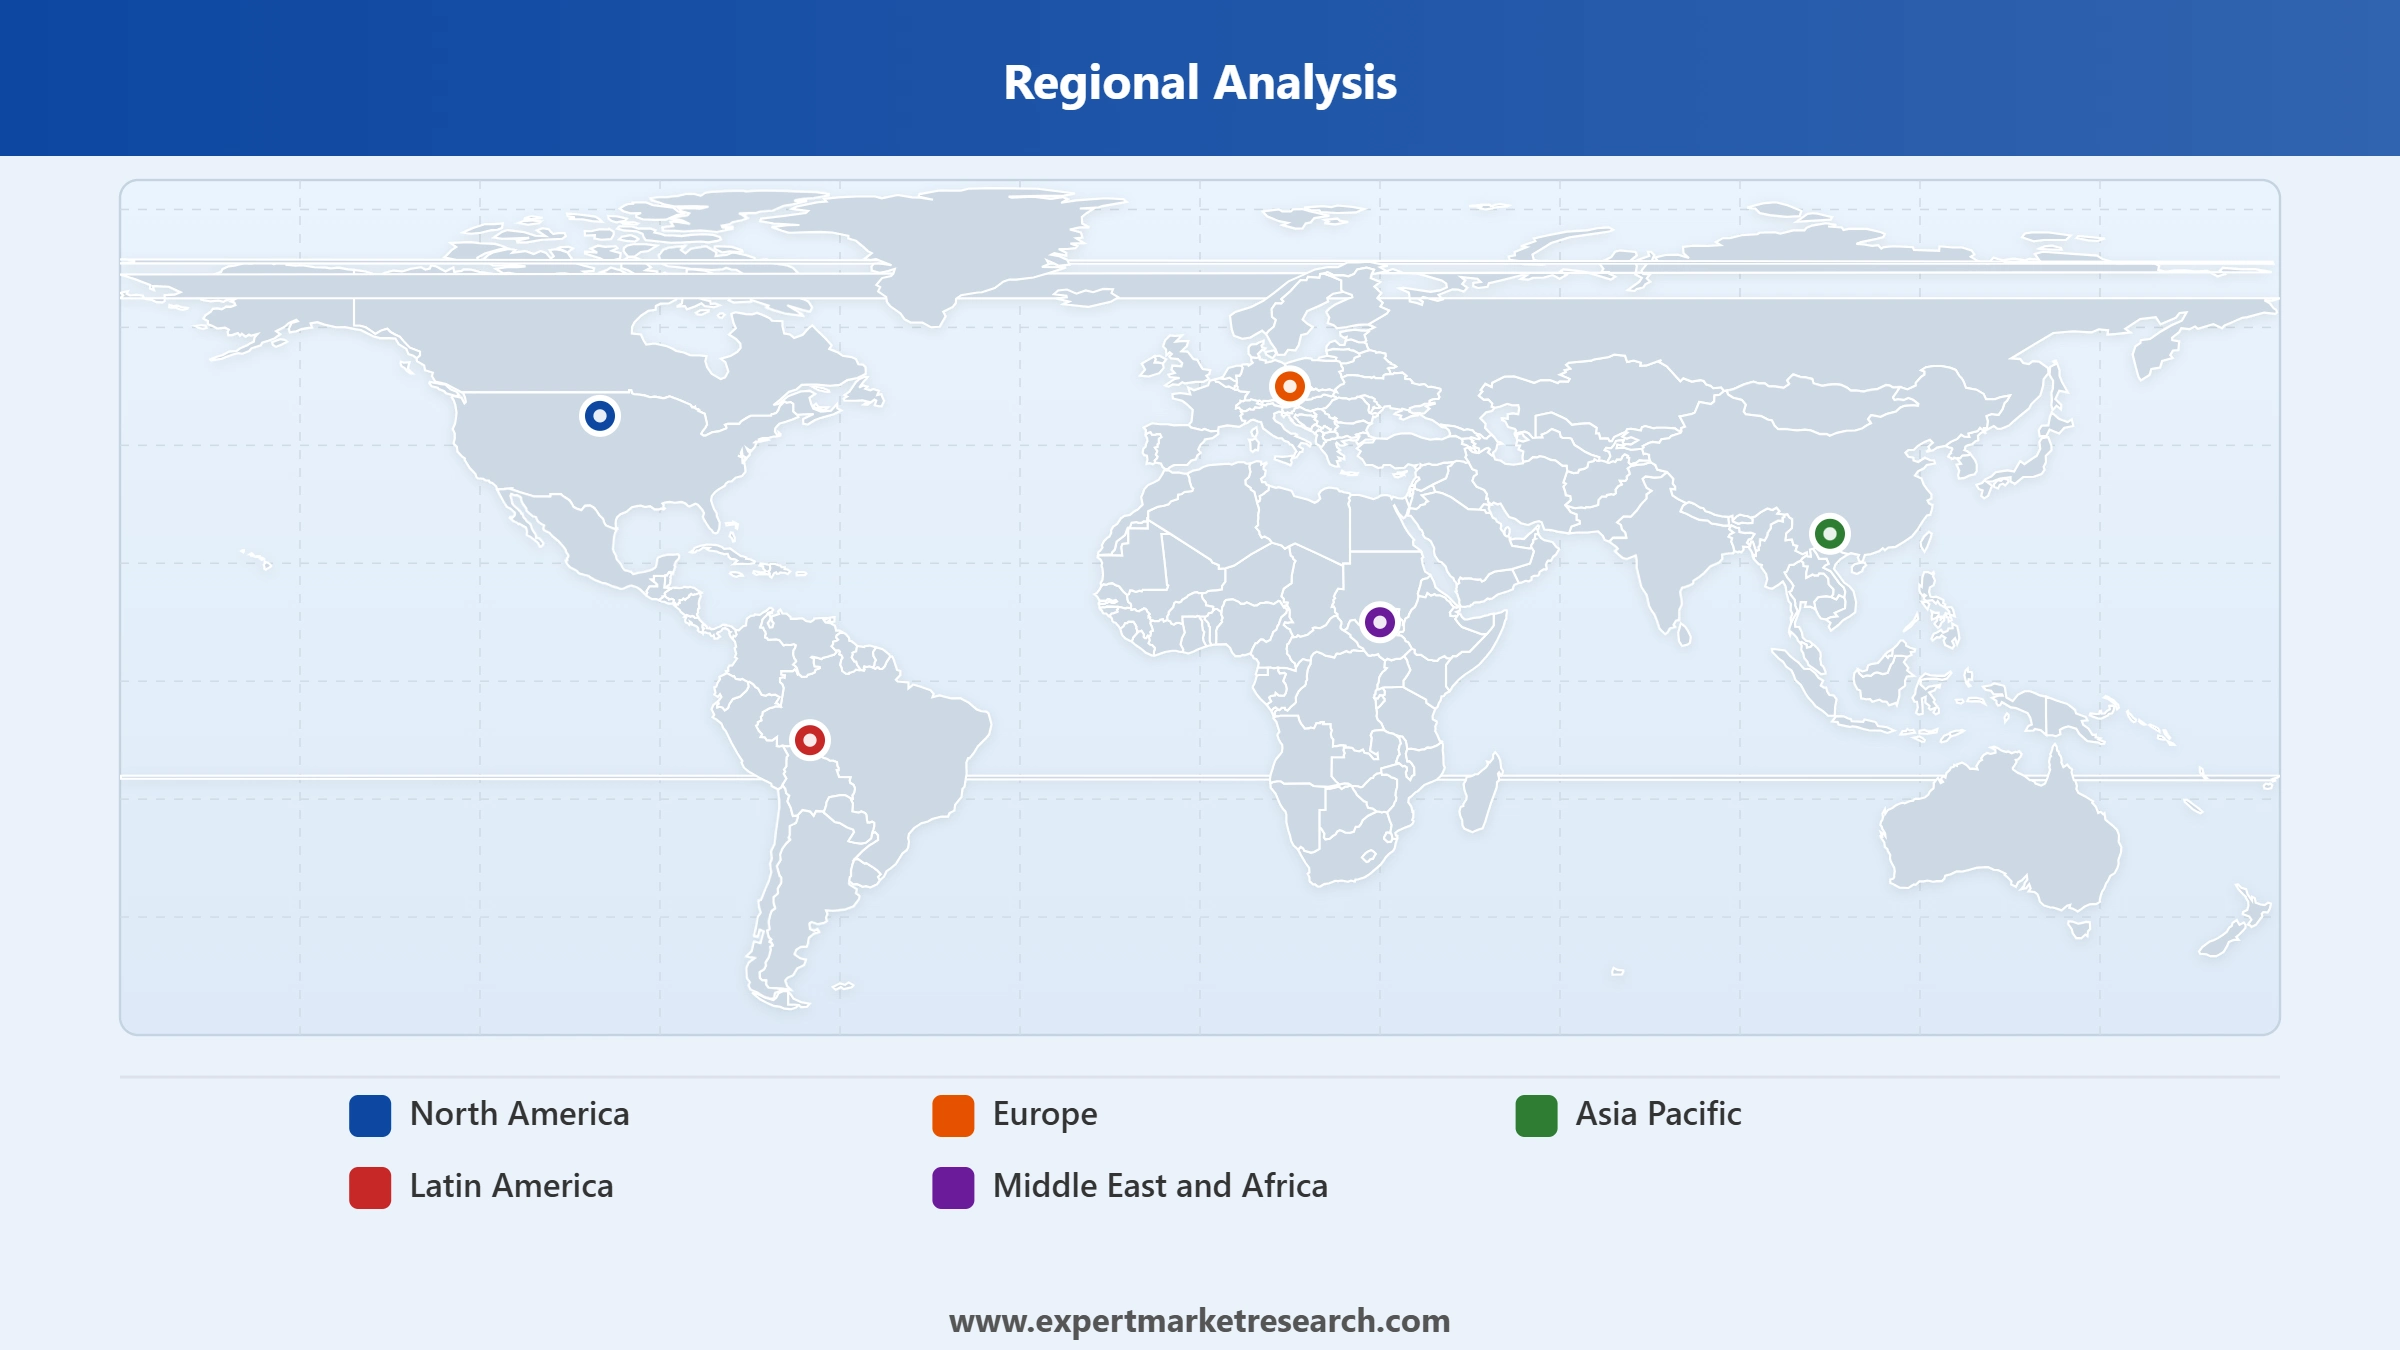
Market Breakup by Region
Key Insight: Asia Pacific is where the volume sits and where growth is concentrated. China remains the anchor as both the largest consumer and a major producer, with its ceramic tile, porcelain, and brick sectors absorbing hundreds of millions of tonnes annually. India is the growth engine to watch most closely, supported by housing programmes, an expanding domestic ceramics base, and active policy backing for mineral processing. Vietnam and Indonesia round out the regional picture with steady demand tied to manufacturing and urbanisation. North America runs a more mature, kaolin heavy profile, while Europe leverages its ceramics tradition and growing pull from specialty applications. Latin America and the Middle East and Africa remain smaller but expanding markets, with construction led demand setting a reliable demand floor.


Read more about this report - REQUEST FREE SAMPLE COPY IN PDF
By Application, Bricks dominate the market due to the sheer scale of housing demand across Asia
Bricks take the largest share of the clay market by application, almost entirely explained by geography and scale. The brick kilns of China, India, Bangladesh, and Pakistan collectively consume volumes that dwarf every other application combined, and the picture is not changing soon. Affordable housing programmes in India alone keep millions of fired clay bricks moving out of kilns every week, and similar trends in Indonesia and Vietnam reinforce the trajectory. While bricks rarely command premium pricing, they offer the kind of volume stability that makes the clay industry growth story so consistent year after year.
Read more about this report - REQUEST FREE SAMPLE COPY IN PDF
Sanitary ware comes second in significance, smaller in volume but considerably stronger in revenue terms. The clay grades behind sanitary ware must fire white, resist deformation, and meet tight dimensional tolerances, allowing producers to charge well above brick clay rates. The category continues to scale alongside middle class housing demand in urban India, Southeast Asia, and parts of sub Saharan Africa. In June 2025, Imerys flagged a fresh capacity expansion at its Devon ball clay operation to supply European sanitary ware producers, reinforcing how specialty grade demand keeps shaping clay market growth at the high end.
By End Use, Ceramic accounts for the dominant share of the market due to broad demand across tiles, sanitary ware, and tableware
Ceramic applications take the majority share of the global clay market across volume, revenue, and the breadth of end user industries served. The umbrella stretches from mass market floor tiles produced at industrial scale in China to precision technical ceramics used in semiconductor and automotive parts. Tableware sits as the largest revenue sub segment within ceramic clay applications, supported by European and East Asian porcelain manufacturers who pay a premium for refined kaolin. Tiles, sanitary ware, and refractories together keep the ceramic clay market on a steady, demand led growth trajectory through 2035.
Read more about this report - REQUEST FREE SAMPLE COPY IN PDF
The non ceramic segment is smaller but moving faster in proportional terms. Paper coating remains the largest non ceramic application, though a mature one given the structural decline of papermaking in developed economies. The real momentum sits in rubber compounding, specialty adhesives, and pharmaceutical and agricultural applications. In April 2025, BASF announced an expansion of its specialty kaolin sourcing for agricultural carrier formulations in Europe, a reminder that non ceramic clay industry growth is increasingly tied to processing investment and technical service rather than tonnage.
Asia Pacific dominates the market due to its scale of construction activity and ceramics manufacturing concentration
It is difficult to discuss the global clay market without spending real time on Asia Pacific. The region is where the market's centre of gravity sits, both for current demand and for almost everything that is expected to play out across the 2026-2035 forecast period. China remains the anchor, with the world's largest ceramic tile sector by a wide margin and brick production volumes that match the pace of its urban construction push. India has emerged as the standout growth story in the regional clay market, with the government reaffirming its 10 million home target under PMAY in March 2025 and the domestic ceramics industry steadily expanding capacity. Vietnam, Indonesia, and the Philippines round out the picture with consistent tile and brick demand tied to ongoing urbanisation and housing rollouts.
Read more about this report - REQUEST FREE SAMPLE COPY IN PDF
Europe is the fastest evolving region driven by specialty applications and cleaner processing investments
Europe's clay market does not carry the volume story Asia does, but it offers something arguably more valuable, depth of application and sophistication of demand. Germany, Italy, the UK, and France between them support a ceramics industry that is genuinely world class, delivering everything from high end tableware and sanitary ware to technical refractories and precision ceramics for automotive and electronics. The UK in particular remains a meaningful kaolin producer, with Cornish material reaching over 75 countries. Imerys' GBP 18 million dry mining investment in Cornwall, announced in May 2025, is a clear vote of confidence in the region's clay industry future, while broader European demand for paper coating, specialty adhesives, pharmaceutical formulations, and environmental engineering grades continues to lift the value mix above the global average.
The global clay market does not look like one competitive landscape so much as two stacked on top of each other. At the top sits a relatively concentrated tier of multinational mineral companies, including Imerys, Sibelco, and KaMin, who control the world's most valuable kaolin and ball clay deposits and serve buyers where specification consistency and technical service genuinely matter.
Below that operates a far more fragmented network of regional producers serving local construction and ceramics industries with adequate but undifferentiated grades. The two tiers are pulling apart. Majors are investing in cleaner processing, portfolio diversification, and digital operations, while smaller players run ageing infrastructure with limited capital. As sustainability rules tighten and premium buyers ask harder questions about provenance, this gap is set to widen over the forecast period.
Headquartered in Paris and founded in 1880, Imerys is the benchmark for what a global industrial minerals company looks like. It runs 240 industrial sites across more than 40 countries, producing kaolin, ball clay, calcium carbonate, talc, and a growing list of specialty minerals. Its UK arm alone supplies finished kaolin to 75 countries, with notable strength in pharmaceuticals, ceramics, paints, rubber, and plastics, backed by R&D infrastructure at its Par Moor centre in Cornwall.
Founded in Antwerp in 1872, Sibelco operates across five mineral segments, with Clays being one of its core areas alongside Silica, Feldspathics, Olivine, and Recycled Glass. The company runs clay production at sites in the UK, US, and Czech Republic, and announced a USD 500 million greenfield expansion programme through 2027. Its July 2025 AI partnership signals a sharper focus on operational efficiency alongside capacity growth, particularly across European and North American ceramic and construction markets.
Germany headquartered Stephan Schmidt Group is a specialist rather than a generalist in the global clay market. The company focuses on high quality natural and processed clay minerals for ceramics and refractories, building its reputation on consistency and technical reliability. Its operations sit close to Europe's ceramics core, with strong product depth in stoneware clay, chamotte, and blended ceramic body formulations for sanitary ware and tableware applications. It offers a credible regional alternative to the global majors.
Set up by the Gujarat state government in 1963 and headquartered in Ahmedabad, GMDC is one of India's largest publicly held mineral enterprises. Its portfolio spans lignite, bauxite, and clay, with clay supply feeding directly into Gujarat's heavyweight ceramic and tile manufacturing cluster. As Indian construction output rises and domestic ceramics capacity scales further, GMDC's geographic positioning and integrated mineral supply role become progressively more strategic within the regional clay industry.
Other key players in the market are Modkha Marine Sdn Bhd, Jaichand Lal Daga Group, Old Hickory Clay Company, MOTA Ceramic Solutions, Associated Soapstone Distribution Company Pvt. Ltd., and Others.
*Please note that this is only a partial list; the complete list of key players is available in the full report. Additionally, the list of key players can be customized to better suit your needs.*
Get the latest perspective on the clay market with our 2026 report. Track the volume growth in construction led applications, the margin shift in specialty grades, and the competitive moves reshaping the global supply base. Whether you are sourcing kaolin for paper, planning ceramics capacity, or evaluating an acquisition in the industrial minerals space, the report delivers the clarity you need. Download your free sample now and explore the opportunities reshaping the thriving clay industry.
Upto 15% Off
USD
$2499 $2249
$3999 $3599
$4999 $4249
$5999 $5099


*While we strive to always give you current and accurate information, the numbers depicted on the website are indicative and may differ from the actual numbers in the main report. At Expert Market Research, we aim to bring you the latest insights and trends in the market. Using our analyses and forecasts, stakeholders can understand the market dynamics, navigate challenges, and capitalize on opportunities to make data-driven strategic decisions.*
The clay market forecast indicates a promising growth rate of a CAGR of 4.20% in the forecast period of 2026-2035.
The rising applications of clay in the building and construction sector, increasing demand in ceramic production, growing demand for kaolin and bentonite, and rapid urbanisation are the major drivers of the market.
The key trends in the market include the emergence of 3D printing of clay and growing efforts by the local and international clay manufacturers to provide sustainable services.
Sanitary ware, tableware, adhesives and sealants, fertilisers, bricks, and plastic and rubber, among others, are the major applications of clay in the market.
Ceramic and non- ceramic are the major end uses of clay.
Clay is made of silica, alumina, or magnesia, among other minerals.
Clay is found in different geological locations including soil horizons, geothermal fields, and in marine sediments.
The key players in the market include Imerys S.A., Modkha Marine Sdn Bhd, Stephan Schmidt Group, Sibelco, Jaichand Lal Daga Group, Old Hickory Clay Company, Gujarat Mineral Development Corporation Ltd, MOTA Ceramic Solutions, Associated Soapstone Distribution Company Pvt. Ltd., and Others.
At 2025, the market reached an approximate value of USD 29.49 Billion.
The market is estimated to witness a healthy growth in the forecast period of 2026-2035 to reach about USD 44.50 Billion by 2035.
North America, Europe, Asia Pacific, Latin America, the Middle East, and Africa are the major regions covered in the market report.
Explore our key highlights of the report and gain a concise overview of key findings, trends, and actionable insights that will empower your strategic decisions.
| REPORT FEATURES | DETAILS |
| Base Year | 2025 |
| Historical Period | 2019-2025 |
| Forecast Period | 2026-2035 |
| Scope of the Report |
Historical and Forecast Trends, Industry Drivers and Constraints, Historical and Forecast Market Analysis by Segment:
|
| Breakup by Application |
|
| Breakup by End Use |
|
| Breakup by Region |
|
| Market Dynamics |
|
| Competitive Landscape |
|
| Companies Covered |
|
Datasheet
One User
USD 2,499
USD 2,249
tax inclusive*
Single User License
One User
USD 3,999
USD 3,599
tax inclusive*
Five User License
Five User
USD 4,999
USD 4,249
tax inclusive*
Corporate License
Unlimited Users
USD 5,999
USD 5,099
tax inclusive*
*Please note that the prices mentioned below are starting prices for each bundle type. Kindly contact our team for further details.*
Flash Bundle
Small Business Bundle
Growth Bundle
Enterprise Bundle
*Please note that the prices mentioned below are starting prices for each bundle type. Kindly contact our team for further details.*
Flash Bundle
Number of Reports: 3
20%
tax inclusive*
Small Business Bundle
Number of Reports: 5
25%
tax inclusive*
Growth Bundle
Number of Reports: 8
30%
tax inclusive*
Enterprise Bundle
Number of Reports: 10
35%
tax inclusive*
How To Order

Select License Type
Choose the right license for your needs and access rights.

Click on ‘Buy Now’
Add the report to your cart with one click and proceed to register.

Select Mode of Payment
Choose a payment option for a secure checkout. You will be redirected accordingly.
Strategic Solutions for Informed Decision-Making
Gain insights to stay ahead and seize opportunities.

Get insights & trends for a competitive edge.

Track prices with detailed trend reports.

Analyse trade data for supply chain insights.

Leverage cost reports for smart savings

Enhance supply chain with partnerships.

Connect For More Information
Our expert team of analysts will offer full support and resolve any queries regarding the report, before and after the purchase.
Our expert team of analysts will offer full support and resolve any queries regarding the report, before and after the purchase.
We employ meticulous research methods, blending advanced analytics and expert insights to deliver accurate, actionable industry intelligence, staying ahead of competitors.
Our skilled analysts offer unparalleled competitive advantage with detailed insights on current and emerging markets, ensuring your strategic edge.
We offer an in-depth yet simplified presentation of industry insights and analysis to meet your specific requirements effectively.


