

Consumer Insights
Uncover trends and behaviors shaping consumer choices today
Procurement Insights
Optimize your sourcing strategy with key market data
Industry Stats
Stay ahead with the latest trends and market analysis.
The global data visualization market was valued at USD 11.10 Billion in 2025. The market is expected to grow at a CAGR of 9.40% during the forecast period of 2026-2035 to reach a value of USD 27.26 Billion by 2035. Increasing enterprise adoption of business intelligence and analytics platforms is driving the overall growth in the market.
Compound Annual Growth Rate
9.4%
Value in USD Billion
2026-2035
North America is anticipated to hold a significant market share, as it has the United States, which is a prominent market for data visualisation. The United States data visualisation market is witnessing healthy growth due to the increasing amount of data generated in small- and medium-scale firms. Factors like the growth of big data and the need for analytics in the retail industry are driving data visualisation applications in North America. As a significant market for technology-based solutions, North America is seeing an increase in the requirement to track data from multiple sources and aggregate it into various data representations to make important business choices.
Asia Pacific is expected to be the fastest-growing region in the global market over the forecast period. Big Data has proliferated the Asia Pacific region, which can be observed with the growing internet usage, smartphone penetration, rapid urbanisation, development in ML, and the need for customer and behavioural analytics. These factors have propelled the market's growth for data visualisation in the region. Further, increasing data generation may result from rising IoT use and a growing trend toward smart industries. Large amounts of created data necessitate data preparation, and this demand is projected to drive the data visualisation sector forward.
Based on component, the software segment has the largest market share and is expected to grow further during the forecast period. The increasing use of business intelligence tools by organisations to improve data analysis and knowledge insights is fuelling the growth of the data visualisation market for this segment. The increasing adoption of on-premises-based data visualisation tools due to highly secure data encryption and total data visibility and improved control over data in terms of location and real-time availability of data for extracting insights has been aiding the market growth.
Read more about this report - REQUEST FREE SAMPLE COPY IN PDF
The representation of data or information using graphs, maps, charts, and other visual tools is known as data visualisation. It entails identifying trends and patterns using dashboards, scorecards, analytics, big data, and business intelligence (BI) tools. The technologies allow for uniform visualisation, which is useful for determining client preferences and sustaining demand and supply for existing and new products.
Market Breakup by Deployment
Market Breakup by End Use
Market Breakup by Region


The increasing adoption of visualisation platforms for software advisory and predictive analysis is one of the major factors driving the growth of the global data visualisation industry. The increasing organisational demand for interactive and simplified projection of data is providing a push to the global market growth. Medium and large-scale enterprises extensively utilise data visualisation systems through smartphones, desktops, tablets, and web-based applications to generate customised reports and graphical representations of the data. In addition, the growing need for interactive dashboards based on unstructured data gathered from email service providers, social media platforms, and smart devices is fuelling the market's expansion. Other growth-inducing factors include technological advancements, such as the integration of connected devices with cloud computing, artificial intelligence (AI), and virtual reality (VR) solutions. Through business intelligence (BI), organisations can analyse cost-effective and scalable data and identify key performance indicators (KPIs). Other factors, such as the growing use of data visualisation tools in the retail industry and major improvements in global IT infrastructure, are expected to propel the market forward. The existence of a large number of firms in the industry with diverse solution offerings for varied business demands also contributes to the market's growth.
The report gives a detailed analysis of the following key players in the global data visualisation industry, covering their competitive landscape, capacity, and latest developments like mergers, acquisitions, and investments, expansions of capacity, and plant turnarounds:
The comprehensive EMR report provides an in-depth assessment of the market based on the Porter's five forces model along with giving a SWOT analysis.
Upto 15% Off
USD
$3999 $3599
$2499 $2249
$4999 $4249
$5999 $5099


*While we strive to always give you current and accurate information, the numbers depicted on the website are indicative and may differ from the actual numbers in the main report. At Expert Market Research, we aim to bring you the latest insights and trends in the market. Using our analyses and forecasts, stakeholders can understand the market dynamics, navigate challenges, and capitalize on opportunities to make data-driven strategic decisions.*
The market is projected to grow at a CAGR of 9.40% between 2026 and 2035.
The major drivers of the market include the increasing amount of data generated in small- and medium-scale firms, increasing organisational demand for interactive and simplified projection of data, growing internet usage and smartphone penetration, rapid urbanisation, growing need for interactive dashboards and technological advancements.
Rapid adoption of data visualisation tools on various platforms and growth of big data are the key industry trends propelling the growth of the market.
The major regions in the industry are North America, Latin America, the Middle East and Africa, Europe, and the Asia Pacific.
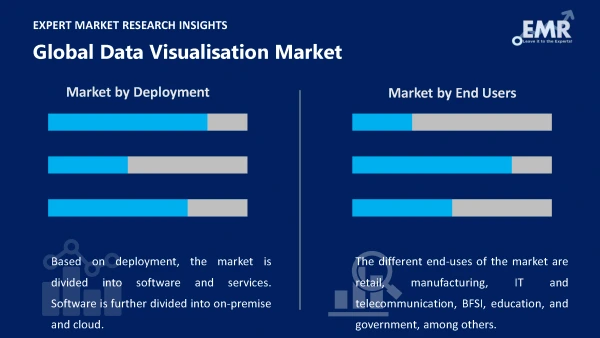
Based on deployment, the market is divided into software and services. Software is further divided into on-premise and cloud.
The different end-uses of the market are retail, manufacturing, IT and telecommunication, BFSI, education, and government, among others.
The major players in the industry are IBM Corporation, Oracle Corporation, SAS Institute Inc., MicroStrategy Inc., TIBCO Software Inc., and SAP SE, among others.
In 2025, the global data visualization market reached an approximate value of USD 11.10 Billion.
The market is poised to reach USD 27.26 Billion by 2035, driven by expanding demand for data-driven decision-making.
Explore our key highlights of the report and gain a concise overview of key findings, trends, and actionable insights that will empower your strategic decisions.
| REPORT FEATURES | DETAILS |
| Base Year | 2025 |
| Historical Period | 2019-2025 |
| Forecast Period | 2026-2035 |
| Scope of the Report |
Historical and Forecast Trends, Industry Drivers and Constraints, Historical and Forecast Market Analysis by Segment:
|
| Breakup by Deployment |
|
| Breakup by End Use |
|
| Breakup by Region |
|
| Market Dynamics |
|
| Competitive Landscape |
|
| Companies Covered |
|
| Report Price and Purchase Option | Explore our purchase options that are best suited to your resources and industry needs. |
| Delivery Format | Delivered as an attached PDF and Excel through email, with an option of receiving an editable PPT, according to the purchase option. |
Single User License
One User
USD 3,999
USD 3,599
tax inclusive*
Datasheet
One User
USD 2,499
USD 2,249
tax inclusive*
Five User License
Five User
USD 4,999
USD 4,249
tax inclusive*
Corporate License
Unlimited Users
USD 5,999
USD 5,099
tax inclusive*
*Please note that the prices mentioned below are starting prices for each bundle type. Kindly contact our team for further details.*
Flash Bundle
Small Business Bundle
Growth Bundle
Enterprise Bundle
*Please note that the prices mentioned below are starting prices for each bundle type. Kindly contact our team for further details.*
Flash Bundle
Number of Reports: 3
20%
tax inclusive*
Small Business Bundle
Number of Reports: 5
25%
tax inclusive*
Growth Bundle
Number of Reports: 8
30%
tax inclusive*
Enterprise Bundle
Number of Reports: 10
35%
tax inclusive*
How To Order

Select License Type
Choose the right license for your needs and access rights.

Click on ‘Buy Now’
Add the report to your cart with one click and proceed to register.

Select Mode of Payment
Choose a payment option for a secure checkout. You will be redirected accordingly.
Strategic Solutions for Informed Decision-Making
Gain insights to stay ahead and seize opportunities.

Get insights & trends for a competitive edge.

Track prices with detailed trend reports.

Analyse trade data for supply chain insights.

Leverage cost reports for smart savings

Enhance supply chain with partnerships.

Connect For More Information
Our expert team of analysts will offer full support and resolve any queries regarding the report, before and after the purchase.
Our expert team of analysts will offer full support and resolve any queries regarding the report, before and after the purchase.
We employ meticulous research methods, blending advanced analytics and expert insights to deliver accurate, actionable industry intelligence, staying ahead of competitors.
Our skilled analysts offer unparalleled competitive advantage with detailed insights on current and emerging markets, ensuring your strategic edge.
We offer an in-depth yet simplified presentation of industry insights and analysis to meet your specific requirements effectively.


