

Consumer Insights
Uncover trends and behaviors shaping consumer choices today
Procurement Insights
Optimize your sourcing strategy with key market data
Industry Stats
Stay ahead with the latest trends and market analysis.
The EPA and DHA market is poised to grow at a CAGR of 8.00% during the forecast period of 2026-2035. The market growth is driven by increasing awareness of cardiovascular and cognitive health benefits, rising demand for dietary supplements, expanding infant nutrition applications, growing preventive healthcare adoption, and continuous advancements in omega-3 ingredient technologies.
German chemicals major BASF detailed expanded algal DHA omega-3 capacity at its Spanish facility through April, supporting infant nutrition customers including Nestle Wyeth and Reckitt Mead Johnson alongside dietary supplement brands. The investment supports continued substitution of marine-sourced fish oil with algae-derived DHA amid sustainability and IFFO Marin Trust certification pressure, the Financial Times reported.
The Global Organization for EPA and DHA Omega-3s reported sustained omega-3 supplement demand growth in March across the United States, Europe and Asia, anchored on cardiovascular, cognitive and pregnancy health claims supported by published clinical research. Members including DSM-firmenich, Croda, Polaris and Epax outlined continued investment in sustainable marine ingredients and traceability, Reuters reported.
Compound Annual Growth Rate
8%
2026-2035
Read more about this report - REQUEST FREE SAMPLE COPY IN PDF
The market is experiencing steady growth driven by increasing consumer awareness of the health benefits associated with long-chain omega-3 fatty acids. EPA and DHA are widely utilized in dietary supplements, infant nutrition, pharmaceuticals, and functional food products due to their roles in supporting cardiovascular, cognitive, eye, and maternal health. Growing demand for preventive healthcare solutions, expanding applications in clinical nutrition, and rising adoption of fortified products are supporting market expansion. Additionally, advancements in sustainable sourcing technologies and increasing investment in omega-3 innovation continue to strengthen industry development worldwide. The market is expected to grow at a CAGR of 8.00% during the forecast period (2026-2035).
Read more about this report - REQUEST FREE SAMPLE COPY IN PDF
Market Breakup by Type
The type segment includes EPA and DHA, representing key omega-3 fatty acids widely utilized across nutrition and healthcare applications, influencing product development, clinical positioning, consumer demand, and formulation strategies.
Market Breakup by Form
The form segment includes triglycerides and ethyl esters, reflecting commercially important delivery structures that affect product stability, manufacturing approaches, ingredient utilization, and formulation preferences across diverse end-use applications.
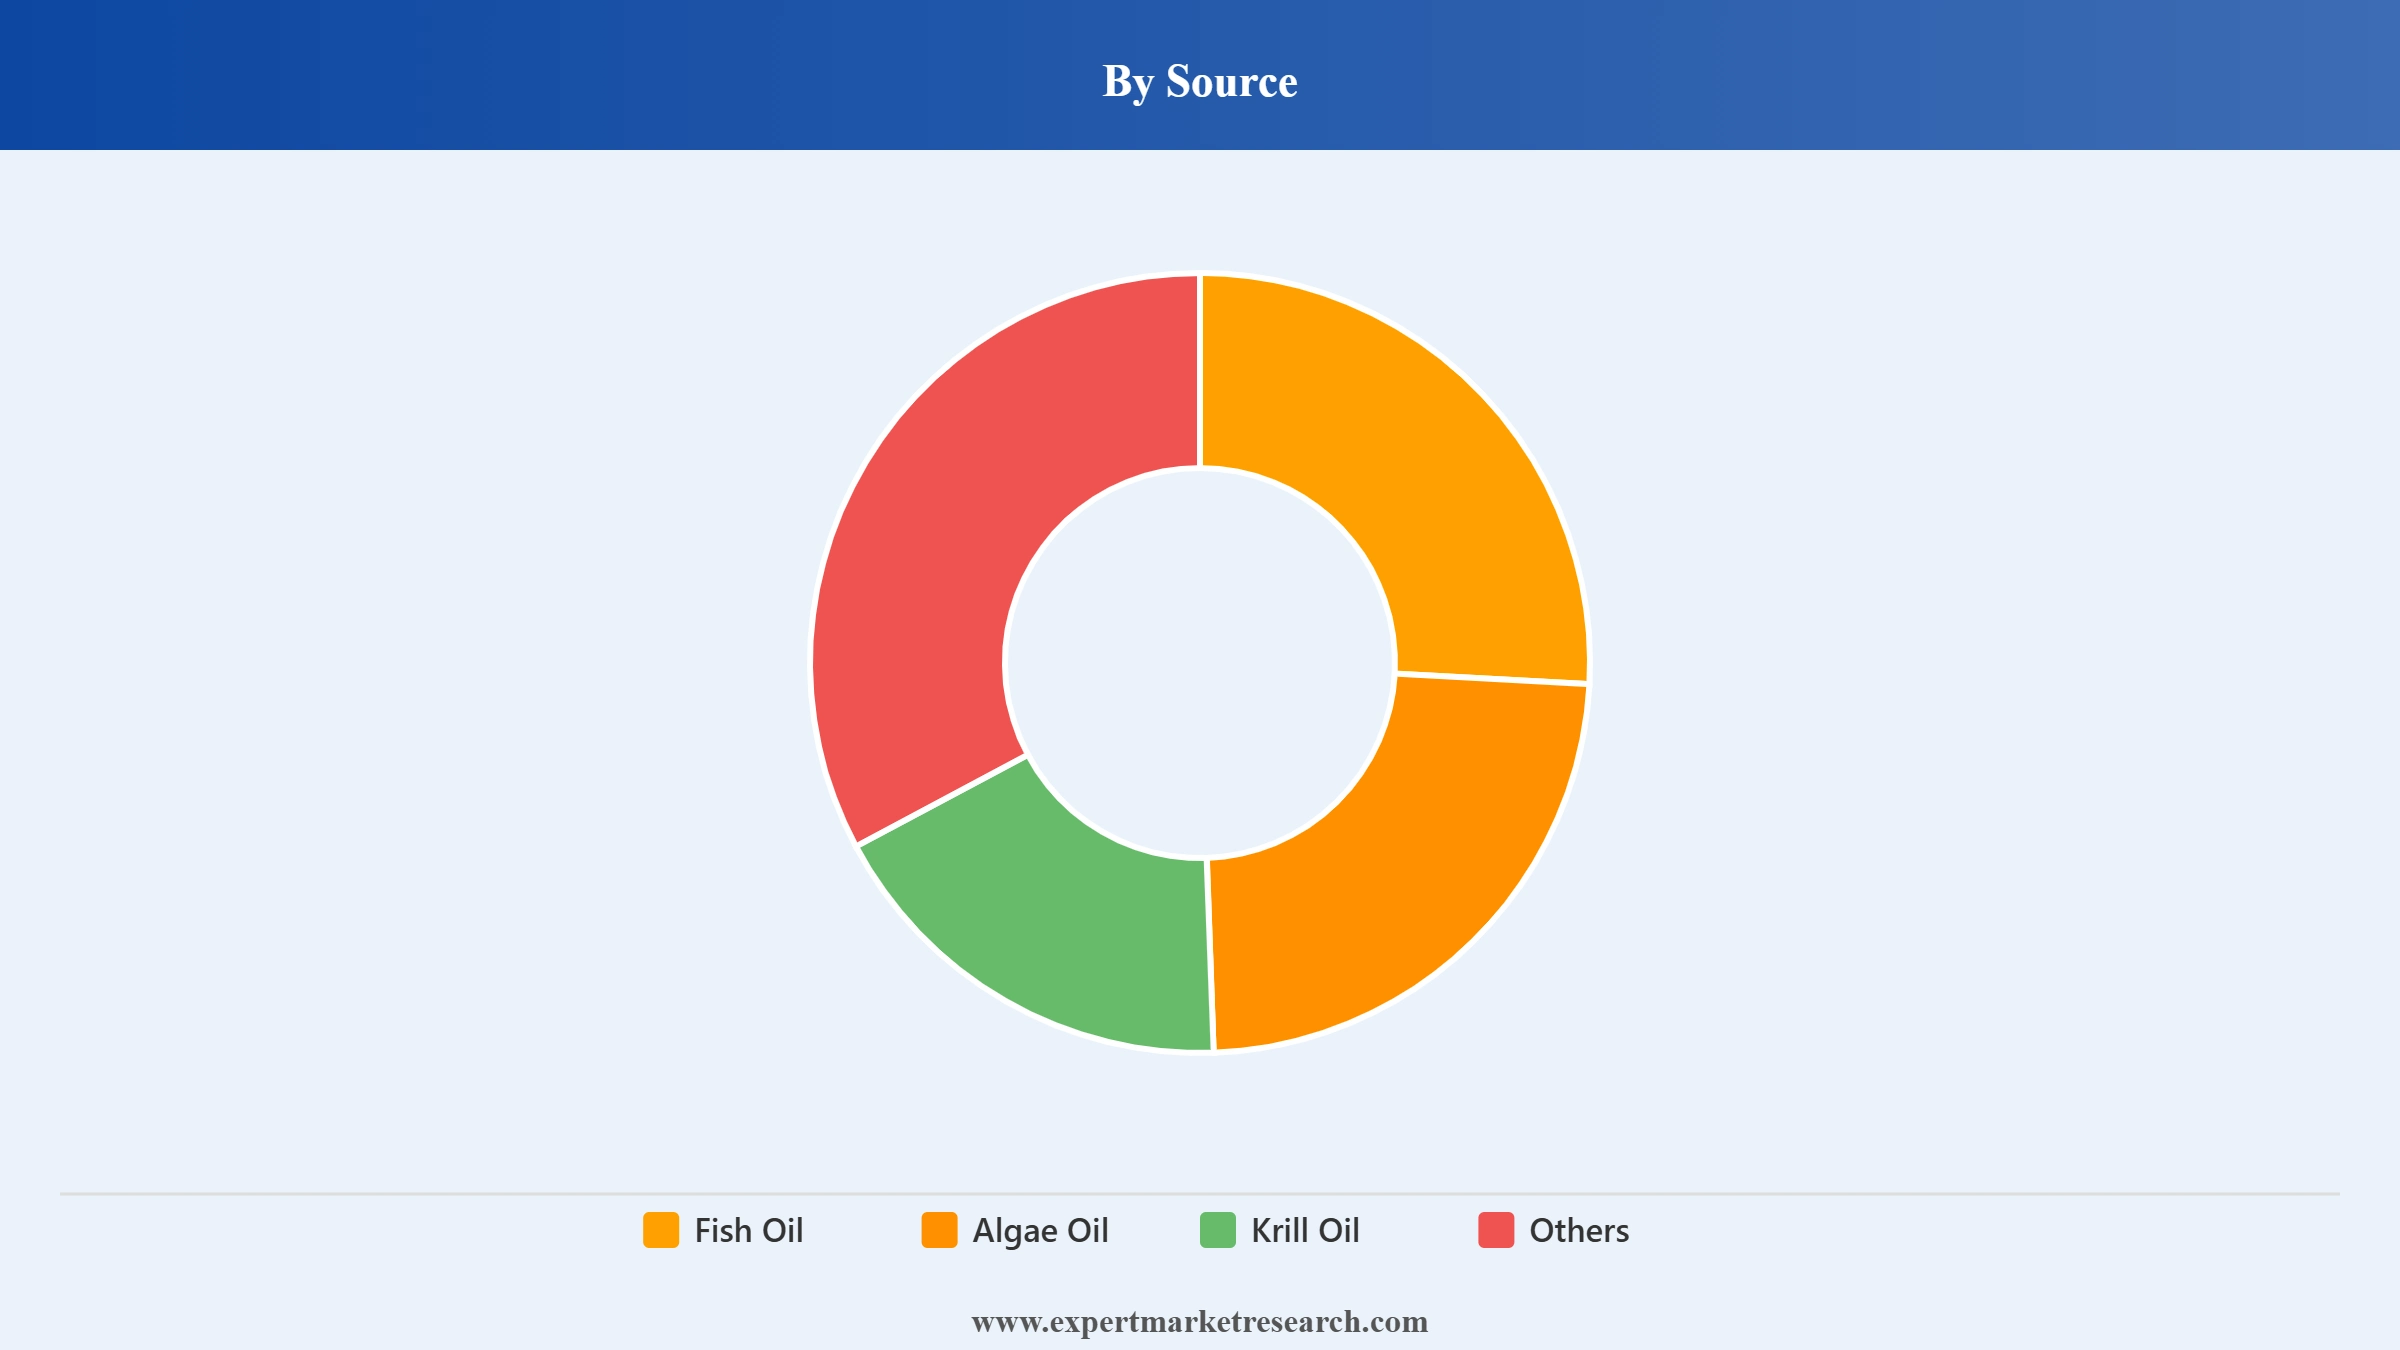
Market Breakup by Source
The source segment includes fish oil, algae oil, krill oil, and others, highlighting major raw material categories that support supply chains, sustainability initiatives, product differentiation, and evolving consumer purchasing preferences.
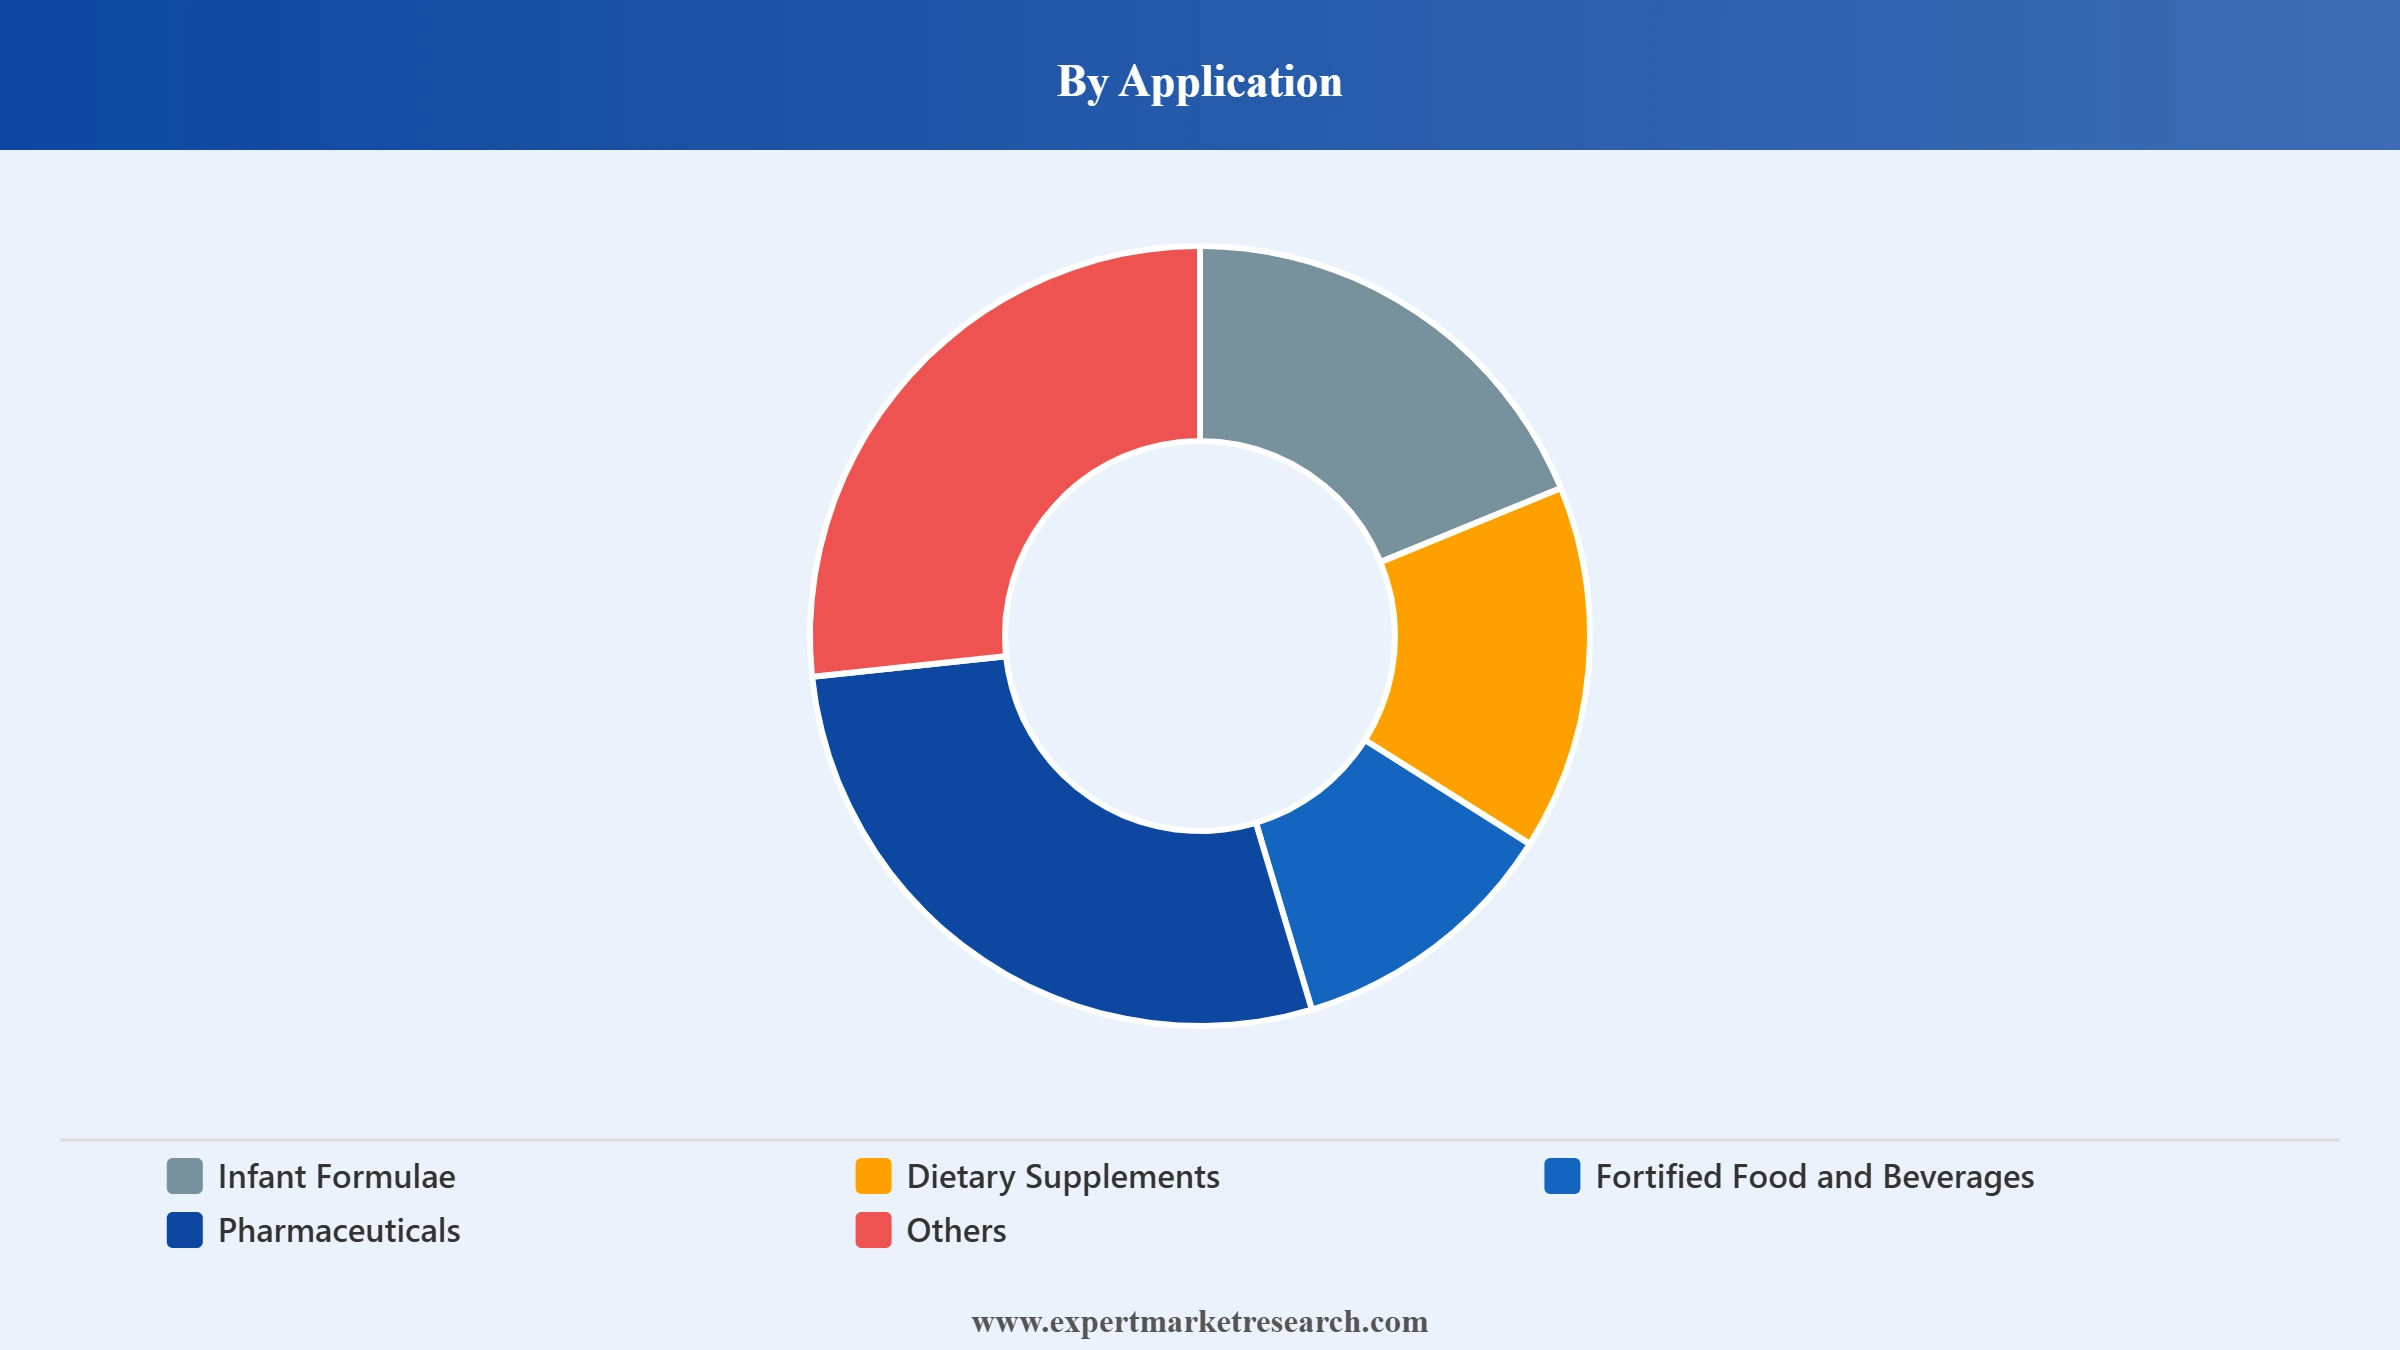
Market Breakup by Application
The application segment includes infant formulae, dietary supplements, fortified food and beverages, pharmaceuticals, and others, demonstrating broad utilization across nutrition and healthcare sectors that drive innovation, commercialization, and market expansion.
Market Breakup by Region
The regional segment includes North America, Europe, Asia Pacific, Latin America, and the Middle East and Africa, encompassing diverse consumption patterns, regulatory landscapes, industry developments, and commercial growth opportunities.


Read more about this report - REQUEST FREE SAMPLE COPY IN PDF
|
Analysis Type |
Factors |
Example |
|
Market Drivers |
Rising demand for high-potency EPA and DHA products, smaller capsule formats, heart and brain health positioning, and premium supplement formulation. |
In May 2026, GC Rieber VivoMega debuted VivoMega 90% TG Premium fish oil at Vitafoods Europe, delivering 520 mg EPA and 310 mg DHA per gram. |
|
Market Restraints |
Marine raw material dependence, reduced anchovy quotas, fish oil supply pressure, higher sourcing costs, and need for alternative input diversification. |
In April 2026, Peru approved its first anchovy season quota at 1.91 million tonnes, 36.2% below the 2025 level. |
|
Market Opportunities |
Algal oil innovation, fish-free EPA and DHA supply, sustainable sourcing, personalized nutrition, and wider use in supplements, functional foods, and pet nutrition. |
In April 2026, Fermentalg launched OMEGA ΩRIGINS EPA/DHA, a microalgae-derived oil range using patented fermentation and multiple ratios. |
This section analyzes key factors influencing market growth, including rising demand for preventive healthcare, increasing omega-3 supplementation, expanding pharmaceutical applications, sustainable sourcing initiatives, product innovation, regulatory developments, and evolving consumer nutrition preferences.
High-Potency Fish Oil Launch Accelerating Market Value
Rising demand for concentrated softgels, stronger heart and brain health positioning, and preference for smaller capsules are supporting market growth for EPA and DHA products. For instance, in May 2026, GC Rieber VivoMega debuted VivoMega 90% TG Premium fish oil at Vitafoods Europe, delivering 520 mg EPA and 310 mg DHA per gram. The launch should help brands improve dosage convenience during the forecast period, strengthen premium formulations, and expand high-potency supplement ranges across retail channels and pharmacies worldwide.
Read more about this report - REQUEST FREE SAMPLE COPY IN PDF
Reduced Anchovy Quota Intensifies Marine Input Supply Risk Restraining Market Growth
Expanding supplement use, steady aquaculture demand, and reliance on marine raw materials support EPA and DHA consumption, but feedstock pressure remains a market restraint. For instance, in April 2026, Peru approved its first anchovy season quota at 1.91 million tonnes, 36.2% below the 2025 level, following scientific recommendations for stock sustainability. This reduction may tighten fish oil availability during the forecast period, raise sourcing costs, and encourage manufacturers to diversify inputs through algae oils and alternative supply contracts worldwide.
Algal Oil Innovation Unlocks Sustainable Market Development
Consumer preference for fish-free ingredients, sustainability concerns, and personalized nutrition needs are creating market opportunities for EPA and DHA suppliers. For instance, in April 2026, Fermentalg launched OMEGA ΩRIGINS EPA/DHA, a microalgae-derived oil range using patented fermentation and multiple ratios for supplements, functional foods, and pet nutrition. The launch should support differentiated formulations during the forecast period, widen non-marine sourcing options, and help brands target longevity, sports nutrition, cognitive health, and visual wellness applications across premium channels globally.
Traceability Programs Reinforce Supply Integrity Bolstering Market Demand
Rising quality expectations, sustainability scrutiny, and demand for verified sourcing are shaping market trends across EPA and DHA products. For instance, in January 2026, GOED announced new board leadership and plans to create an official member traceability program to strengthen consumer trust and supply-chain integrity. The initiative should improve documentation practices during the forecast period, support responsible sourcing claims, and help suppliers demonstrate cleaner product histories across fisheries, crude oil suppliers, refiners, concentrators, and finished product brands worldwide.
DHA Segment Likely to Dominate the Market Segment by Product Type
The DHA segment accounted for approximately 57% of the market share in the historical period. Strong utilization in infant nutrition, dietary supplements, and functional health products continues to support segment expansion. Increasing consumer focus on cognitive wellness, eye health, and healthy aging has encouraged manufacturers to incorporate DHA into a wide range of formulations. Ongoing investments in product development and ingredient quality further strengthen commercial adoption. The DHA segment is likely to dominate the market due to its extensive applications and established consumer demand.
North America represented about 40% of the market share in the historical period. High awareness of preventive healthcare, widespread consumption of nutritional supplements, and strong demand for clinically supported ingredients continue to drive market activity. The region benefits from advanced research capabilities, established distribution networks, and the presence of leading industry participants. Continuous innovation in nutrition and wellness products further supports commercial growth. North America is likely to dominate the market, supported by its mature consumer base and developed healthcare ecosystem.
Founded in 1865 and headquartered in Ludwigshafen, Germany, BASF is a global chemical and ingredient manufacturer. Its omega-3 portfolio includes high-purity EPA and DHA ingredients, nutritional lipids, and solutions supporting dietary supplement, pharmaceutical, and food applications.
Established in 1988 and headquartered in Bexbach, Germany, KD Pharma specializes in omega-3 concentrates and lipid-based ingredients. Its portfolio includes pharmaceutical-grade EPA and DHA products, customized formulations, and nutritional solutions for healthcare and supplement markets.
Founded in 1925 and headquartered in Goole, England, United Kingdom, Croda develops specialty ingredients for health and nutrition industries. Its portfolio includes omega-3 oils, marine-derived lipids, and advanced formulations serving dietary supplement and pharmaceutical sectors.
Established in 1913 and headquartered in Houston, Texas, United States, Omega Protein produces marine-based nutritional ingredients. Its portfolio includes fish oil-derived EPA and DHA products, specialty oils, and ingredients for human nutrition and animal health applications.
Other key players in the market include Aker BioMarine ASA, Koninklijke DSM N.V., GC Rieber VivoMega AS, OLVEA Omega Solutions, Golden Omega S.A., and Clover Corporation Limited.
*Please note that this is only a partial list; the complete list of key players is available in the full report. Additionally, the list of key players can be customized to better suit your needs.*
This report is developed through a robust mixed-methods research design combining:
Upto 15% Off
USD
$3299 $2969
$5499 $4949
$6999 $5949
$8199 $6969


*While we strive to always give you current and accurate information, the numbers depicted on the website are indicative and may differ from the actual numbers in the main report. At Expert Market Research, we aim to bring you the latest insights and trends in the market. Using our analyses and forecasts, stakeholders can understand the market dynamics, navigate challenges, and capitalize on opportunities to make data-driven strategic decisions.*
Explore our key highlights of the report and gain a concise overview of key findings, trends, and actionable insights that will empower your strategic decisions.
| REPORT FEATURES | DETAILS |
| Base Year | 2025 |
| Historical Period | 2019-2025 |
| Forecast Period | 2026-2035 |
| Scope of the Report |
Historical and Forecast Trends, Industry Drivers and Constraints, Historical and Forecast Market Analysis by Segment:
|
| Breakup by Type |
|
| Breakup by Form |
|
| Breakup by Source |
|
| Breakup by Application |
|
| Breakup by Region |
|
| Market Dynamics |
|
| Competitive Landscape |
|
| Companies Covered |
|
| Report Price and Purchase Option | Explore our purchase options that are best suited to your resources and industry needs. |
| Delivery Format | Delivered as an attached PDF and Excel through email, with an option of receiving an editable PPT, according to the purchase option. |
Datasheet
One User
USD 3,299
USD 2,969
tax inclusive*
Single User License
One User
USD 5,499
USD 4,949
tax inclusive*
Five User License
Five User
USD 6,999
USD 5,949
tax inclusive*
Corporate License
Unlimited Users
USD 8,199
USD 6,969
tax inclusive*
*Please note that the prices mentioned below are starting prices for each bundle type. Kindly contact our team for further details.*
Flash Bundle
Small Business Bundle
Growth Bundle
Enterprise Bundle
*Please note that the prices mentioned below are starting prices for each bundle type. Kindly contact our team for further details.*
Flash Bundle
Number of Reports: 3
20%
tax inclusive*
Small Business Bundle
Number of Reports: 5
25%
tax inclusive*
Growth Bundle
Number of Reports: 8
30%
tax inclusive*
Enterprise Bundle
Number of Reports: 10
35%
tax inclusive*
How To Order

Select License Type
Choose the right license for your needs and access rights.

Click on ‘Buy Now’
Add the report to your cart with one click and proceed to register.

Select Mode of Payment
Choose a payment option for a secure checkout. You will be redirected accordingly.
Strategic Solutions for Informed Decision-Making
Gain insights to stay ahead and seize opportunities.

Get insights & trends for a competitive edge.

Track prices with detailed trend reports.

Analyse trade data for supply chain insights.

Leverage cost reports for smart savings

Enhance supply chain with partnerships.

Connect For More Information
Our expert team of analysts will offer full support and resolve any queries regarding the report, before and after the purchase.
Our expert team of analysts will offer full support and resolve any queries regarding the report, before and after the purchase.
We employ meticulous research methods, blending advanced analytics and expert insights to deliver accurate, actionable industry intelligence, staying ahead of competitors.
Our skilled analysts offer unparalleled competitive advantage with detailed insights on current and emerging markets, ensuring your strategic edge.
We offer an in-depth yet simplified presentation of industry insights and analysis to meet your specific requirements effectively.


